HAL Id: hal-01612065
https://hal.sorbonne-universite.fr/hal-01612065
Submitted on 6 Oct 2017
HAL is a multi-disciplinary open access
archive for the deposit and dissemination of
sci-entific research documents, whether they are
pub-lished or not. The documents may come from
teaching and research institutions in France or
abroad, or from public or private research centers.
L’archive ouverte pluridisciplinaire HAL, est
destinée au dépôt et à la diffusion de documents
scientifiques de niveau recherche, publiés ou non,
émanant des établissements d’enseignement et de
recherche français ou étrangers, des laboratoires
publics ou privés.
electrostatic repulsions on the behavior of PS-b-PAA
monolayers at the air-water interface
Zineb Guennouni, Michel Goldmann, Marie-Claude Fauré, Philippe Fontaine,
Patrick Perrin, Denis Limagne, Fabrice Cousin
To cite this version:
Zineb Guennouni, Michel Goldmann, Marie-Claude Fauré, Philippe Fontaine, Patrick Perrin, et al..
Coupled effects of spreading solvent molecules and electrostatic repulsions on the behavior of
PS-b-PAA monolayers at the air-water interface. Langmuir, American Chemical Society, 2017, 33 (43),
pp.12525-12534. �10.1021/acs.langmuir.7b02664�. �hal-01612065�
Langmuir is published by the American Chemical Society. 1155 Sixteenth Street N.W., Washington, DC 20036
Published by American Chemical Society. Copyright © American Chemical Society.
Article
Coupled effects of spreading solvent molecules and electrostatic repulsions
on the behavior of PS-b-PAA monolayers at the air-water interface
Zineb Guennouni, Michel Goldmann, Marie-Claude Fauré, Philippe
Fontaine, Patrick Perrin, Denis Limagne, and Fabrice Cousin
Langmuir, Just Accepted Manuscript • DOI: 10.1021/acs.langmuir.7b02664 • Publication Date (Web): 03 Oct 2017
Downloaded from http://pubs.acs.org on October 4, 2017
Just Accepted
“Just Accepted” manuscripts have been peer-reviewed and accepted for publication. They are posted online prior to technical editing, formatting for publication and author proofing. The American Chemical Society provides “Just Accepted” as a free service to the research community to expedite the dissemination of scientific material as soon as possible after acceptance. “Just Accepted” manuscripts appear in full in PDF format accompanied by an HTML abstract. “Just Accepted” manuscripts have been fully peer reviewed, but should not be considered the official version of record. They are accessible to all readers and citable by the Digital Object Identifier (DOI®). “Just Accepted” is an optional service offered to authors. Therefore, the “Just Accepted” Web site may not include all articles that will be published in the journal. After a manuscript is technically edited and formatted, it will be removed from the “Just Accepted” Web site and published as an ASAP article. Note that technical editing may introduce minor changes to the manuscript text and/or graphics which could affect content, and all legal disclaimers and ethical guidelines that apply to the journal pertain. ACS cannot be held responsible for errors or consequences arising from the use of information contained in these “Just Accepted” manuscripts.
Coupled effects of spreading solvent molecules and electrostatic
re-pulsions on the behavior of PS-b-PAA monolayers at the air-water
interface
Zineb Guennouni
a,b‡, Michel Goldmann*
,a,c,dMarie-Claude Fauré
a,c, Philippe Fontaine
d, Patrick
Perrin
e,f, Denis Limagne
aand Fabrice Cousin*
,ba
Sorbonne Universités, UPMC Univ Paris 06, CNRS-UMR 7588, Institut des NanoSciences de Paris, 4 place Jussieu F-75005 Paris, France
b Laboratoire Léon Brillouin, CEA Saclay, 91191 Gif sur Yvette Cedex, France c
Faculté des Sciences Fondamentales et Biomédicales, Université Paris Descartes, 45 rue des Saints Pères, 75006 Paris, France
d Synchrotron SOLEIL, L’Orme des Merisiers, Saint-Aubin, BP 48, 91192 Gif-sur-Yvette, France e
Ecole Supérieure de Physique et de Chimie Industrielles de la Ville de Paris (ESPCI), ParisTech, PSL Research Uni-versity, Sciences et Ingénierie de la Matière Molle (SIMM), CNRS UMR 7615, 10, Rue Vauquelin, F-75231 Cedex 05 Paris, France
f Sorbonne-Universités, UPMC Univ Paris 06, SIMM, 10, Rue Vauquelin, F-75231 Cedex 05 Paris, France
ABSTRACT: We describe the surface behavior of PS-b-PAA monolayers at the air/water interface using
N,N-dimethyformamide (DMF) as spreading solvent. At low pH, when the PAA blocks are neutral, the surface pressure versus molecular area isotherm shows a pseudoplateau associated with the presence of remaining solvent spreading molecules in the monolayer, as we described in a former study (Guennouni et al, Langmuir, 2016). We show here that the width of the plateau decreases when increasing pH up to its complete disappearance at high pH, when PAA blocks are fully charged, although there still exist two regimes of compressibilities on the isotherm. A refined structural study at pH 9 combining Specular Neutron Reflectivity (SNR), Grazing-Incidence Small-Angle X-rays Scattering (GISAXS) and Atomic Force Mi-croscopy (AFM) in liquid measurements show that: (i) PAA blocks are stretched in solution, as expected from polyelectro-lyte brushes in osmotic regime; (ii) the system undergoes a spinodal decomposition during deposit at the air/water inter-face in presence of DMF. Upon compression, the Qxy* position of the peak associated with the spinodal structure remains
almost constant but its intensity evolves strongly and passes through a maximum at intermediate pressures. This reveals two operating processes in the system: strong electrostatic repulsions between chains that prevent in-plane reorganiza-tions and force such reorganizareorganiza-tions to occur from the surface to the volume and progressive expulsion of the DMF mole-cules from the monolayer. These processes have antagonist effects on the intensity of the peak: the increase of the repul-sions makes it more pronounced whereas the expulsion of solvent makes it vanish due to the loss of contrast.
INTRODUCTION
Monolayers of charged amphiphilic block copolymers at the air/water interface have a huge potential for appli-cations because their physical properties can be moni-tored over a wide range through the tuning of electrostat-ic interactions in the aqueous subphase [1][2][3][4][5]. In particular, their further transfer onto solid substrate[6], if controlled, opens the way to the design of pH-responsive systems. In turn, the description of their surface behav-iour is an intricate problem to address since many physi-cochemical parameters may influence the mechanisms driving such behaviour, namely the respective masses and hydrophilicity/hydrophobicity of the blocks, the choice of solvent spreading, the pH, ionic strength, and linear
charge density of the charged block that control the elec-trostatic interactions.
In this framework, we aim here at probing the concur-rent influences of electrostatic interactions and solvent spreading effects on the surface behaviour of
polystyrene-b-(acrylic acid) (PS-b-PAA) copolymers. This system is a
tool of choice for such a study because it has at the same time a very hydrophobic anchor (PS) and a hydrophilic block whose pKa is located at intermediate pH (~ 4.7). The linear charge density of this block can thus be finely tuned by varying the pH from totally neutral up to fully charged, enabling to decouple influence of electrostatic effects on surface behaviour from other ones, contrarily to copolymers with strong polyelectrolytes blocks such as
1 2 3 4 5 6 7 8 9 10 11 12 13 14 15 16 17 18 19 20 21 22 23 24 25 26 27 28 29 30 31 32 33 34 35 36 37 38 39 40 41 42 43 44 45 46 47 48 49 50 51 52 53 54 55 56 57 58 59 60
poly(hydrogenated isoprene)-b-poly(styrene sulfonate)[3] [4]. The neutral case makes it possible to compare with PS-b-PEO whose behavior has been very well described in the literature [7][8][9][10].
We first underline that finding a good spreading sol-vent for PS-b-PAA is not easy considering the two blocks different affinities, contrary to the case of PS-b-PEO or PS-b-PMMA where the volatile chloroform can be used. One often use spreading solvent formed by hydro-philic−hydrophobic solvent mixtures which respective concentrations can be adjusted to the relative weight of each block [5][11][12][13]. However, the use of a pure sol-vent guarantees the absence of possible biases, for exam-ple related to differences in evaporation rate. To this aim, the DMF, which dissolves both blocks, appears as a good choice, although it presents the drawback to dissolve into the aqueous subphase instead of being evaporated at room temperature. Indeed, it is miscible with water, has a high boiling point (153°C) and a low vapor pressure.
Surface pressure versus surface density isotherm of the PS-b-PAA system for different pH of the subphase were firstly presented by Currie et al using a 60% dioxane-40% toluene solvent and for different pH of the subphase [5]. The main observed features are the following: at low pH, the compression isotherm evidences a surface pressure plateau usually associated to a first order transition of the organic monolayer. This plateau is not observed anymore at high pH and Currie et al associated it to a mushrooms-brushes transition of the PAA block. Wang et al studied these monolayers at pH 7 by BAM using DMF as solvent [14]. They confirm the presence of the “pseudoplateau” that they interpreted as a pancake to brush transition too, although the PAA chains are likely to be totally charged at such pH. They also observed by BAM an aggregation process in the monolayer that they attributed to the DMF slow dissolution in the subphase. However, the aggregates where not recovered when observing the film by AFM after transfer by the LB procedure. We note that the sam-ples were dried for 24h before AFM measurement. The-odoly et al [15] studied the microscopic structure of these films by GISAXS at pH 11 using dioxane as solvent. There-fore, micelles exist in the spreading solution as dioxane is not a good solvent for PS. No pseudo-plateau was ob-served at such high pH. The data have been interpreted by the presence of hexagonally packed surface micelles which dissociated into a brush under the film compres-sion. Combining neutron reflectivity and GISAXS meas-urements, we recently characterized the microscopic structure of PS-b-PAA layer deposited from a DMF solu-tion at the air/water interface [16]. Clearly, at pH 2, the compression isotherm exhibits a surface pressure pseudo-plateau. Our GISAXS results however demonstrated that the PS-b-PAA monolayers were not homogenous but do not form surface micelles. Moreover, by neutron reflectiv-ity, we demonstrated that the PAA chains remain ad-sorbed at the interface irrespective of the pressure and never reach the brushes configuration. This pointed out the influence of the spreading solvent as the structure of the monolayer was different from those described by
Currie et al. To explain our results at low pH, we have proposed a new model based on the possibility that some DMF molecules (from the spreading solvent) remain adsorbed within the monolayer at low surface pressure. These molecules are desorbed below the interface when a critical surface pressure is reached. This corresponds to the onset of the plateau on which the DMF molecules are continuously desorbed under compression. The end of the plateau corresponds to the full expulsion of the DMF. However, at higher pH, when PAA blocks are fully charged [11], the possible formation of brushed may strongly change the behavior of the monolayer. This prompted us to study the isotherm of the system on a large pH range and to make a proper structural study by SNR and GISAXS at pH 9 complemented by AFM exper-iments on transferred film. In this latter case, we insured that the organic film has always been in liquid environ-ment.
MATERIALS AND METHODS
Materials. Polystyrene-poly(acrylic acid) diblock
co-polymer PSD-b-PAA were provided by Polymer Source
Inc., Canada. It consists of 33 deuterated styrene repeti-tion units (Mn=3500 g/mol) and 143 acrylic acid repetirepeti-tion units (10800 g/mol) with polydispersity index, Pi=1.12.
Silicon wafers (thickness= 281 ± 25 µm, orientation = (100), no dopant, roughness= 5 Å) were purchased from ACM (France).
Isotherms. The copolymers were dissolved in
N,N-dimethyformamide (DMF) to form spreading solutions of typical concentrations of order of 2 10-4 mol/L. In a previ-ous publication, we checked the total solubilization of the copolymer chains in DMF [16]. A few microliters of the solution were deposited drop by drop with a micro-syringe (Hamilton) onto the air/liquid interface of a Langmuir trough equipped with 1 or 2 movable barrier(s) for film compression. After deposit, it was waited for a minimum time of 10 minutes to let the monolayer equili-brate before starting to compress. The surface pressure was measured according to the Wilhelmy plate method. The plate is made of filter paper and the measurement device is a microbalance from Riegler&Kirstein GmbH (Germany). The subphase consisted of Milli-Q Millipore ultra-pure water (18.2 MΩ.cm) into which either HNO3 or
NaOH (Sigma Aldrich, purity better than 98 %) was add-ed to set the pH at the desiradd-ed values. The temperature was regulated at 18 ± 0.5 °C using a circulating water bath. Prior to the deposit of each monolayer, the Teflon® trough was cleaned with Hellmanex® and rinsed several times with ultra-pure water. Before any experiment we checked that the subphase surface was not polluted. Each iso-therm was performed three or four times to check the reproducibility of the results. It was always very good in all the conditions probed.
All isotherms were performed at a constant speed com-pression of 35 Å2/molecule/min. The typical time of iso-therm cycle (compression-expansion) is about 1h15. The speed compression has no influence on the isotherm. We
1 2 3 4 5 6 7 8 9 10 11 12 13 14 15 16 17 18 19 20 21 22 23 24 25 26 27 28 29 30 31 32 33 34 35 36 37 38 39 40 41 42 43 44 45 46 47 48 49 50 51 52 53 54 55 56 57 58 59
checked it by performing isotherms at two very different compression speeds, 3 Å2/molecule/min and 400 Å2/molecule/min (10 times slower and faster than the usual speed), and we did not detect any change in the isotherms (data not shown).
We also performed some experiments where pH was changed in situ from pH 2 to pH 9, or the reverse. For such experiments, we used the following protocol. A complete first cycle of compression-expansion isotherm of the copolymer monolayer was first carried out at the initial pH. To modify the pH of the subphase, the copol-ymer film was then compressed again a second time until the complete stop of the barriers of the trough. Beyond the two barriers, the necessary amounts of HNO3 (or
NaOH) were gradually added to change pH to the desired value. The monolayer was then completely expanded and left to stand. After about ten minutes, a complete new cycle of compression-expansion isotherm was performed at the new pH. In order to ensure the reproducibility of the results, all the reversibility measurements were re-peated several times, varying different parameters such as the monolayer rest time after the pH change and the number of isothermal cycles performed before and after the pH change.
Specular Neutron Reflectivity (SNR). Specular
neu-tron reflectivity experiments were carried out in situ on a Langmuir trough, thermalized at 18°C, on the horizontal time-of-flight reflectometer EROS at LLB [17]. The Qz
-range that was probed lied between 0.008 and 0.18 Å-1, with a ∆Q/Q resolution of ~ 0.12. The incoherent scatter-ing was measured independently and subtracted from the SNR curves before any modelling. All experimental details can be found in ref [16] or in Supporting Information.
Two conditions of subphase contrasts were thus used to take benefit from the fact that the PS part of the copoly-mer was deuterated : (i) a mixture of 67%/33% H2O/D2O
that has a Scattering Length Density (SLD) NB of 1.7 10 -6
Å
-2
and matches exactly the SLD of the PAA chains, making only the PSD part observable; (ii) pure deuterated water (NB = 6.39 10-6 Å-2.) which is very close to the SLD of
deu-terated polystyrene (6.5 10-6 Å-2) makes the PAA part ob-servable. The SLD of the hydrogenated DMF used for the deposit is 0.70 10-6 Å-2.
Data were analyzed by model fitting using the Parratt formalism. The interface was described by a series of layers, each of them being characterized by a thickness, a scattering length density and a roughness. The experi-mental resolution of the spectrometer was taken into account in the calculation.
Grazing Incidence Small angle X-ray Scattering (GISAXS). GISAXS measurements were performed on a
dedicated PTFE Langmuir trough at the ID10B beamline at the ESRF synchrotron source (Grenoble, France). All experimental details, as well as the respective electronic scattering length densities of the component can be found in Supporting Information or in ref [16]. The surface pressure was kept constant during a scan.
AFM measurement in liquid mode after transfer of the monolayer on hydrophobic substrates. Silicon
wafers substrates were first cleaned by an immersion in an active “piranha” solution (30%H2O2/70%H2SO4, high-ly corrosive), extensivehigh-ly rinsed with Milli-Q water and dried with a nitrogen flow. They were immediately si-lanized with a mixture of Octadecytrichlorosilane (OTS) at a concentration of 0.15 vol% in anhydrous toluene for 2h at ambient temperature [18]. This treatment allowed us to obtain highly hydrophobic substrates for the further transfer of the PS-b-PAA monolayer.
Such transfer was achieved either by the Langmuir-Schaefer technique or Langmuir-Blodgett technique, using the same Langmuir trough as for the isotherm. For such purpose, new protocols were designed to transfer the PS-b-PAA monolayer at a settled pressure onto the hydrophobic wafer that ensures that sample stays main-tained at every step within the aqueous buffer up to their measurement by AFM. This avoided the damaging of the deposited copolymers monolayer, a mandatory prerequi-site given that dewetting effects are usually observed for such PS-b-PAA monolayers [19]. These protocols are pre-sented in Supporting Information.
Finally, the structure of the PS-b-PAA monolayer was probed by an Atomic Force Microscope (AFM, nanoscope 3100, Veeco) in liquid environment in the contact mode.
RESULTS
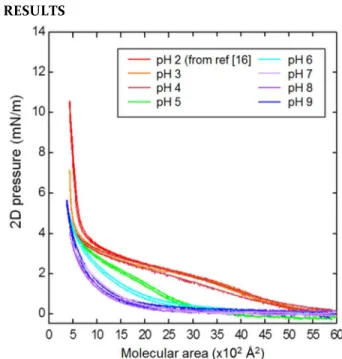
Figure 1: Surface pressure isotherm cycles of PS-b-PAA
copolymers at different pH, at T = 18 °C and at a compres-sion rate of 35 Å2/mol/min with a deposited volume such as the initial molecular area corresponds to 6000 Å2/molecule. The data at pH 2 come from reference [16] and have been measured exactly in the same conditions.
Isotherms
In order to obtain a full understanding of the behavior of the PS-b-PAA amphiphilic diblock copolymers at the
1 2 3 4 5 6 7 8 9 10 11 12 13 14 15 16 17 18 19 20 21 22 23 24 25 26 27 28 29 30 31 32 33 34 35 36 37 38 39 40 41 42 43 44 45 46 47 48 49 50 51 52 53 54 55 56 57 58 59 60
air/liquid interface, we have characterized the PS-b-PAA monolayers by using the Langmuir technique on a wide range of pH lying from pH 3 to pH 9 since the pKa of the carboxylic groups of PAA is 4.7. The same copolymers solution was used and this completes the data we already obtained at pH 2 in ref [16] (Figure 1).
Stability and reproducibility of the isotherms.
Figure 2. Surface pressure isotherm cycles of PS-b-PAA
copolymers film formed at pH 9 (concentration of spread-ing solution = 2 10-4 mol/L, T = 18 °C) and starting from a maximal area of: A: 6000 Å2/molecule; B: 800 Å2/molecule. Inset shows the same data in log-log scale.
When the solution is deposited onto the surface, a monolayer is formed, as shown by Wang et al [14] by Brewster microscopy, although some part of material is lost in the subphase because the DMF spreading solvent is miscible with water. Although this loss of material is negligible at low pH when the PAA chains are neutral [16], it becomes important at high pH when the PAA chains are charged and thus very hydrophilic. This raises the question of the correct area per molecule on the iso-therm, which is usually calculated from 3 experimental parameters making the hypothesis that all material is deposited on the surface: the concentration of the spread solution, the volume of deposited solution and the availa-ble surface of the air/water interface on the trough. In-deed, if one of these parameters changes, the calculation becomes inaccurate. This is illustrated in Figure 2 which shows two isotherms performed on the same trough and obtained with a given solution at a concentration of 2 10-4 mol/L with two different deposited volumes. Although the shape of the isotherm remains similar (see inset of Figure 2), the limit area and lift off vary indicating a greater loss of material in the case of the largest deposited volume since the isotherm appears shifted towards low molecular area. At least, the correct reliable parameter defining the film state is the surface pressure value (and the temperature of course), and results will be later dis-cussed as function of such parameter. In the following, we
have decided to present the areas per molecule calculated as if no material was lost in the subphase but we remind the reader that they are only effective values.
The two isotherms of figure 2 were obtained with the conditions that we used for the different experiments of the paper. The maximal area of 6000 Å2/molecule was those we use for probing the influence of pH (Figure 1). It was chosen to allow a proper comparison with the iso-therm at pH 2 of reference [16]. The maximal area of 800 Å2/molecule was used for GISAXS and NR measurements. It was chosen to optimize measurements with the Lang-muir trough available at the large facilities.
Influence of pH on isotherms. Once a monolayer of
PS-b-PAA was deposited, we waited at least 10 minutes to insure the removal of DMF excess. Several successive cycles of compression and expansion were then per-formed on the monolayer. At the lowest pH (2 to 4), the PS-b-PAA copolymers form a stable monolayer at the interface, all isotherms are reversible upon decompres-sion and superimpose without hysteresis after several cycles as previously observed [16] at pH 2. On the contra-ry, at high pH, when the PAA chains are charged, the isotherms cycles are progressively shifted very slightly toward the smaller molecular area and present a weak hysteresis, without markedly altering the shape of the isotherm (see Figure SI.1 that shows 3 cycles of compres-sion/expansion at pH 9 in supporting information). This probably results from a very limited loss of some copoly-mers in the aqueous subphase.
Figure 3. Surface pressure isotherm cycles of PS-b-PAA
copolymers starting from a maximal area of 800 Å2/molecule at pH 9 and T = 18 °C (conditions used for GISAXS and SNR measurements). The different arrows correspond to the different points of GISAXS and SNR measurements. The colors code is respected for GISAXS and SNR figures. Inset: 2D pressure versus compressibility
Cs.
When the pH of the subphase varies from 2 to 9 (Figure 1), the shape of the isotherm progressively changed with
1 2 3 4 5 6 7 8 9 10 11 12 13 14 15 16 17 18 19 20 21 22 23 24 25 26 27 28 29 30 31 32 33 34 35 36 37 38 39 40 41 42 43 44 45 46 47 48 49 50 51 52 53 54 55 56 57 58 59
three typical behaviors, which point out the role of elec-trostatics : (i) At low pH (pH < 4), the PAA chains are neutral and one recovers the “pseudo-plateau” as in pre-vious publications at about 3mN/m surface pressure [5] [16]; (ii) when the pH increases to intermediate values (4 ≤ pH ≤ 7), the width of the pseudo-plateau gradually de-creases continuously, the most important changes occur-ring at ~ pH 5, i.e. in the vicinity of the pKa of the PAA chains; (iii) finally, at high pH (pH > 7), the PAA chains are fully charged and the pseudoplateau is no longer ob-served. In this last regime, the surface pressure remains almost null at large molecular areas down to a molecular area, and then increases upon further compression. The lack of pseudoplateau at pH 9 was interpreted by Currie
et al [5] as the existence of only one PAA regime, the
brush one, at every surface pressure due to the strong electrostatic repulsions between charged PAA blocks.
We remind that we demonstrated that the pseudoplat-eau observed at low pH was associated to the expulsion of DMF solvent from the monolayer. At intermediate pH value, this regime of high isothermal compressibility, i.e. ܥ௦ൌ ቀെଵడడగቁ், is still present but the value of
compressi-bility taken at the middle of the pseudoplateau, progres-sively decreases. It indicates that some repulsions coun-teract either the dissolution of the DMF, either the in-plane reorganizations of the systems that occur in this “expelling regime”. Thereby, the presence of such repul-sions, presumably of electrostatic origin, reduces the width of the plateau. Ultimately, at high pH, although the pseudoplateau seems to have disappeared at first glance, the two regimes can be still identified when calculating Cs
(see inset of Figure 3). The change occurs at a surface pressure of about 6.5 mN/m (Figure 3). It finally appears that there are not two distinct behaviours at low pH and high pH, but the different faces of the same given prob-lem with specific effects arising from electrostatic repul-sions between PAA blocks once they are charged.
In situ change of the pH of the subphase. We have
also probed the evolution of the isotherm when changing
in situ the pH of the subphase in order to pass from
un-charged blocks at pH 2 to un-charged blocks at pH 9, and
vice versa. Isotherms are shown in Figure SI.2 in support-ing information. When passsupport-ing from pH 2 to pH 9, one
recovers an isotherm which shape is identical to those obtained when deposited at pH 9, although it is shifted towards large molecular areas. This shift results from the fact that the loss of materials at pH 9 is obviously more important than at pH 2. When passing from pH 9 to pH 2, the isotherm exhibits the pseudo-plateau at the same surface pressure as usually observed but its width has decreased by half. This shows that there was less DMF solvent remaining in the monolayer formed at pH 9 than at pH 2. These experiments demonstrate that the deposit conditions have a large impact with respect to the amount of lost materials and/or of trapped solvent but that the behavior of the system is reversible upon pH changes once monolayer is formed.
Specular Neutron Reflectivity
The sample was probed at three surface pressures (0.8 mN/m, 3.8 mN/m, 8 mN/m) by SNR measurements on an aqueous subphase at pH 9 in the two contrasts condi-tions. The different measurements points are indicated by arrows on the isotherm of Figure 3. The Fresnel curve, i.e. the SNR signal from the pure subphase, was systematical-ly measured first. The layer was then deposited, first compressed up to 8 mN/m to check that one recovers the isotherm and expanded up to large molecular area. Then it was re-compressed again for measurements. All meas-urements were performed at constant surface pressure. For all of the three surface pressures the experimental SNR curves markedly differ from the Fresnel one, contra-rily to what was observed at pH 2 [16].
Figure 4. (a) SNR of the single subphase (100% D2O) at
pH 9 and T = 18 °C, covered by a PSD-b-PAA copolymer
monolayer at various surface pressures. Continuous lines correspond to the best fits. (b) ΦPAA(z), as obtained from
the fits. The dashed lines correspond to a Gaussian profile (see text).
For the 100% D2O subphase contrast, they present a
lower intensity than the Fresnel ones and some interfer-ence Kiessig fringes (see results in Figure 4 that are dis-played in the Fresnel representation (R(Qz)Qz4 versus
(a) (b) 1 2 3 4 5 6 7 8 9 10 11 12 13 14 15 16 17 18 19 20 21 22 23 24 25 26 27 28 29 30 31 32 33 34 35 36 37 38 39 40 41 42 43 44 45 46 47 48 49 50 51 52 53 54 55 56 57 58 59 60
f(Qz)). In such contrast (PSD almost contrast-matched),
the contribution to the scattering originates essentially from the PAA blocks (SLD of 1.7 10-6 Å-2), as well as some potential DMF within the layer (SLD of 0.7 10-6 Å-2). These spectra show that the PAA blocks are stretched in water, since a swollen PAA layer in D2O presents a lower mean
SLD than the one of pure D2O, and form a rather thick
layer at the interface because of the strong electrostatic repulsions induced by the deionization of the carboxyl groups.
The Kiessig fringes are not very marked at 0.8 mN/m, suggesting that the surface density of PAA remains low, whereas they are very marked at 3.8 mN and at 8 mN/m, suggesting a significant densification of the PAA layer. Moreover, the fringes are progressively shifted towards low Q from 0.8 mN/m to 8 mN/m, i.e. an overall increase of the thickness of the layer, revealing a thicker layer associated to a stretching of chains upon compression.
The SLD profiles NB(z) have been obtained from the
best fits of the experimental data. These profiles have been then converted into ΦPAA(z) profiles considering
only PAA, PSD and D2O and are shown on Fig 4.b. The
potential presence of DMF would contribute to NB(z) due
to its low SLD. The ΦPAA(z) profiles are therefore probably
not accurate in terms of absolute volume fraction. In particular, ΦPAA(0) must be overestimated. Despite this,
the shape of the profiles and its evolution due to com-pression are representative. At 0.8 mN/m, ΦPAA(z) is very
low. The PAA chains form a layer of thickness of 170 Å, which is well below the fully stretched length of the PAA blocks (about 350 Å, taking N = 143 and a monomer size of 2.5 Å). When the film is compressed up to 3.8 mN/m, the thickness of the PAA layer only slightly increases, but its surface density increases greatly. At 8 mN/m, the pro-file is very similar to the one at 3.8 mN/m, with a slight increase of both the surface density and the thickness. Please note that for this last pressure ΦPAA(z) is practically
accurate since the DMF is fully expelled (see discussion). The shape of the two dense profiles has been compared to a Gaussian function Φ(z) = Φ0 exp(-(z2/l2)) where Φ0 is the
density at the surface and l is the specific length of the profile, as expected for polyelectrolyte brushes in the osmotic regime; i.e. high surface density and low ionic strength [20][21][22][23]. They are in good accordance with such Gaussian behaviour (with respectively Φ0 =
0.325 and l = 85 Å at 3.8 mN/m and Φ0 = 0.36 and l = 95 Å
at 8mN/m) up to a distance from the interface of ~ 100 Å. At further distance, there is an excess of PAA chains. This excess can be interpreted by the diving of some copoly-mers from the interface to the volume under the effect of the increase in surface pressure.
Figure 5 shows the SNR curves for the 67%/33% H2O/D2O subphase contrast (PAA blocks are
contrast-matched), where the PSD anchoring blocks, that
poten-tially contain some DMF, are probed. At low pressure (0.8 mN/m), there is already a noticeable layer at the surface since the intensity of the SNR curve is much higher than the Fresnel one. This SNR curve can be modelled with a
single layer of 20 Å with a SLD of 2.5 10-6 Å-2. These values are the ones enabling the modelling with the lowest χ2, even so several profiles allow to fit the data for such a low thickness within errors bars with thickness/SLD pairs lying in the range (18 Å - 22 Å and 2.2 10-6 Å-2 - 2.8 10-6 Å-2). This enables to determine ΦPSD by assuming that PSD
blocks lay within water at the interface, a reasonable as-sumption given that the PAA chains are solvated and that copolymers form surface aggregates (see next part). The potential presence of DMF in the PS layer may affect the determination of ΦPSD but such modification is weak due
to contrast issues. Indeed, one gets ΦPSD ~ 0.16 by
consid-ering that the layer does not contain DMF, and ΦPSD ~
0.19 if there remains 40%v/v of DMF within the PS, as observed in bulk on PS-b-PAA copolymer micelles [24]. This low volume fraction is in accordance with the large molecular area of the layer at such a surface pressure.
Figure 5. (a) SNR of the single subphase (67%/33% H2O/D2O) at pH 9 and T = 18 °C, covered by a PSD-b-PAA
copolymer monolayer at various surface pressures. Con-(a) (b) 1 2 3 4 5 6 7 8 9 10 11 12 13 14 15 16 17 18 19 20 21 22 23 24 25 26 27 28 29 30 31 32 33 34 35 36 37 38 39 40 41 42 43 44 45 46 47 48 49 50 51 52 53 54 55 56 57 58 59
tinuous lines correspond to the best fits. (b) ΦPS(z), as
obtained from the fits.
When the surface pressure is increased up to 3.8 mN/m, the intensity of the SNR curve strongly increases, evidencing a large enrichment in PSD at the surface. The shape of the SNR curve also changes, as some damped fringes are present at low Qz. This reveals that a second
layer with a large thickness appears below the dense thin anchoring layer of PSD at the surface. It has not been
pos-sible to model the SNR curve by a single layer and a two-layers model has been used to fit the experimental SNR curve (see figure SI.3 in supporting information that com-pares models with respectively 1 or 2 layers). The dense small layer has a thickness of 19 Å and a SLD of 3.7 10-6 Å-2, (ΦPSD ~ 0.4) and the second layer is ~ 100 Å thick with an
SLD of 1.85 10-6 Å-2, that gives Φ
PSD of around 0.03 (see
Figure 5.b). When the surface pressure layer is increased up to 8 mN/m, the same behaviour is recovered. The thickness of first layer remains at 19 Å but its SLD in-creases to 4.7 10-6 Å-2, i.e. a ΦPSD value of 0.6. The second
layer has around the same thickness (110 Å) and the same SLD (1.9 10-6 Å-2) as for 3.8 mN/m. As the evaluation of ΦPSD is poorly affected by DMF for such contrast, it has
been possible to check the consistency of the model by verifying that the mass of PSD remains constant at the interface. This mass is proportional to Γ*A, where Γ is the excess mass and A the molecular area. Γ is proportional to
∫
∞ Φ 0 ) (z dzPSD . The values for all surface pressures are
re-ported in table SI.1, and demonstrate such mass conserva-tion (see supporting informaconserva-tion).
The appearance of an additional PSD layer at surface pressure ranging between 0.8 mN/m and 3.8 mN/m is in accordance with the behaviour of the PAA blocks, whose profiles also deviate from those of pure osmotic brushes at the same pressures. This confirms that part of the PS blocks dive into the volume under the effect of the in-crease of the surface pressure, a behaviour that was not observed at low pH [16].
Grazing Incidence Small angle X-ray Scattering
The in-plane structure of the system at pH 9 was probed by GISAXS from 3 mN/m to 10 mN/m. A strong correlation peak readily marked is present on the GISAXS pattern up to a surface pressure of 8 mN/m that disap-pears for highest pressures. It arises from a surface scat-tering as it appears as a vertical line on the Qxy-Qz 2D
pattern (Figure 6.a). A similar correlation peak was ob-served at pH 2 and originates from the presence of DMF trapped in PS. Indeed DMF has an electronic scattering length density very different from those of water, PS and PAA (see supporting information). Here also the correla-tion peak arises from the presence of DMF. The charac-teristic thickness of the scattering layer is ~ 10 - 20 Å, as derived from the rodscan analysis at Qxy* which
corre-sponds to the maximum intensity of the correlation peak
(supporting information). This thickness value is of the same order as the PS thickness determined from SNR.
The 2D pattern was integrated along Qz from 0 to 0.2
Å−1 to obtain I(Q
xy). The result for different surface
pres-sures is shown in Figure 6.b. At low surface pressure, the position Qxy* of the correlation peak is located about ~
0.031 Å-1, which corresponds to ~ 190 Å in direct space (2π/Qxy*). This characteristic distance is large so it can
only results from the formation of surface aggregates. It is however notably lower than those obtained at pH 2 (that lay in the 300 Å – 450 Å range [16]). Moreover, it appears that this value remains almost fixed upon compression while its intensity varies strongly.
Figure 6. (a) Typical 2D GISAXS pattern for a PSD-b-PAA monolayer at 5.8 mN/m and T = 18°C; (b) Integrated X-ray scattered intensity I versus Qxy for a PSD-b-PAA monolayer at different surface pressures. Each curve is shifted for clarity by a factor 3 with respect to the previous curve. An example of reproducibility is presented at 5.8 mN/m and 3.8 mN/m, back indicating the expansion cycle.
In order to get a more quantitative description of the correlation peak, I(Qxy) has been modelled by a Gaussian
(b) (a) 1 2 3 4 5 6 7 8 9 10 11 12 13 14 15 16 17 18 19 20 21 22 23 24 25 26 27 28 29 30 31 32 33 34 35 36 37 38 39 40 41 42 43 44 45 46 47 48 49 50 51 52 53 54 55 56 57 58 59 60
function, as we formerly did for the pH 2 case in ref [16], to extract both its intensity and its position Qxy* (see
supporting information). Data are reported in figure 7.
Two regimes clearly appear depending on the surface pressure, the crossover between them corresponding to the difference of compressibility identified on the iso-therm.
Figure 7. (a) Intensity of the correlation peak as function of
surface pressure, as obtained from a simple modelling of the correlation peak by a Gaussian; (b) Qxy* as function of sur-face pressure.
In the regime of low surface pressures (3 mN/m – 5.8 mN/m), Qxy* has a constant value of 0.031 Å
-1
upon com-pression, i.e. the characteristic distance d* does not vary (Figure 7.b). This dismisses the possible formation of surface micelles since d* would scales with the square of the molecular area A1/2. At the same time, the intensity of the peak strongly increases and reaches a maximum be-tween 4.8 mN/m and 5.8 mN/m. These results, similar to first order transition, indicate a strong reorganization of the nanostructures at the interface during compression. The fact that d* does not vary upon a decrease of molecu-lar area A is a priori counterintuitive. Nevertheless, it can be consistent with a transfer of material from the inter-face to the volume without change of the interinter-face struc-ture during the compression of the film.
In the regime of large surface pressures (5.8 mN/m – 9.6 mN/m), the situation changes noticeably, which points out a structural reorganization of the surface. First, the correlation peak is progressively and slightly shifted towards low Q upon compression, i.e. largest distances in real space, from the value 0.031 Å-1 at 5.8 mN/m up to 0.029 Å-1 at 8 mN/m. Second, after the intensity of the correlation peak reached a maximum between 4.8 mN/m and 5.8 mN/n, it decreases up to complete disappearance above 8 mN/m. Such a disappearance can be explained by the expulsion of DMF from the surface aggregates. In-deed, the behaviour is reminiscent from what was ob-served at pH 2 where the peak disappeared when passing from the regime of high compressibility to low compress-ibility because of the loss of electronic contrast between aggregates and their surrounding vicinity when the DMF is fully expelled.
AFM in liquid
Figure 8. Topographic AFM pictures (1μm * 1μm) in liquid
medium of a monolayer of PS-b-PAA copolymers formed at the air-water interface at pH = 9 and transferred onto hydro-phobic silicon wafers. (a) Deposit at 3.8 mN/m. Inset is a corresponding FFT transform of the picture. (b) Deposit at 14 mN/m. (b) (a) 1 2 3 4 5 6 7 8 9 10 11 12 13 14 15 16 17 18 19 20 21 22 23 24 25 26 27 28 29 30 31 32 33 34 35 36 37 38 39 40 41 42 43 44 45 46 47 48 49 50 51 52 53 54 55 56 57 58 59
We succeeded in transferring the monolayer on highly hydrophobic substrates at pH 9, which demonstrates that the outer layer of the monolayer was hydrophobic when PAA blocks are charged. Figure 8 presents AFM images in contact mode in liquid for 2 different surface pressures at 3.8 mN/m, and 14 mN/m. At 3.8 mN/m, one clearly ob-serves an in-plane surface structure with a marked corre-lation size, which corresponds to the structural feature obtained from a spinodal decomposition. The thickness variation range is ~ 50 Å. A 2D Fast Fourier Transform of the picture at 3.8 mN/m gives a maximum at ~ 250 Å, of the order of what is obtained with GISAXS experiments (see inset of Figure 8.a). At 14 mN/m, the image appears featureless, in agreement with the absence of correlation peak in GISAXS experiments. For such a pressure, a hole was made with the AFM tip within the monolayer to check the presence of a real homogeneously layer onto the surface (see Figure SI.7 in supporting information).
Since the SNR measurements showed that the PAA blocks are stretched in water, the question arises of the origin of the thickness variations on the monolayer trans-ferred at 3.8 mN/m. This may be related to variations in composition of the zones leading to stiffness variations and thus to a change in the response of the tip of the AFM when it interact with the surface. The thick areas may be associated with DMF swollen PS chains and solvated PAA chains while the thin ones are associated only with the solvated PAA chains. When the DMF is expelled from the monolayer (14 mN/m), we observe only one single homo-geneous zone, which is associated with a layer composed solely of PS and PAA chains.
DISCUSSION
Based on the combined structural information from SNR, GISAXS and AFM measurements, Figure 9 proposes a synoptic scheme of evolution of the monolayer over a cycle of compression/expansion deposited on a pH 9 subphase. Contrary to the pH 2 case, there is a thick PAA layer for all surface pressures, in agreement with a brush configuration of the charged PAA block. Concerning the PS block, there is a thin layer at large surface area which gets denser under compression with the apparition of a second buried layer, thick and of low density, when the surface pressure reaches 3.8 mN/m. We interpret these results by the diving of some copolymers below the mon-olayer when the surface pressure is high enough.
The GISAXS and AFM experiments reveal that the in-plane microstructure is not homogeneous between 3 mN/m and 8 mM/m. Indeed, the AFM image is similar to the one expected in case of a spinodal decomposition. The in-plane typical distance d* obtained at 3 mN/m remains constant upon compression up to about 5 mN/m while it GISAXS intensity increases continuously. At higher surface pressure, this intensity starts decreasing
and vanishes at 8 mN/m as the d* slightly increases. The-se results can be interpreted by the combination of the two phenomena: (i) the immersion of some PS-b-PAA copolymer chains with increasing surface pressure; (ii) the desorption of some DMF solvent molecules from surface, but at a different surface pressures than observed at pH 2. Indeed, up to 5 mN/m, domains with fixed DMF concen-tration remain at the interface. Increasing the surface pressure by compressing the layer induces the release of some PS-b-PAA chains from the interface to the volume, without changing significantly the DMF concentration within the layer as well as the monolayer structure. At higher surface pressure (> 6 mN/m ), the second regime of compressibility is reached: the remaining DMF mole-cules are finally expelled within the subphase like liquid molecules are expelled from a compressed sponge. This leads to a variation of the surface concentration inducing simultaneously a decrease of the correlation peak intensi-ty and its shift to lower Q. The surface coalescence of aggregates is impossible because of the strong electrostat-ic repulsions between the charged PAA blocks. Since nanostructures cannot rearrange themselves within the plane, the surface pressure increase forces some copoly-mer chains to dip from the surface to the volume. At a given point, when this sinking frees enough space at the surface, a better exploration of the phase space is possible for the system. Surface strains are also relaxed. Some in-plane reorganization may then occur. This phenomenon is completed for surface–pressure above 8 mN/m. The correlation peak is no longer observed and the surface appears finally homogeneous by AFM at the highest sur-face pressures.
Such a refined structural study performed at pH 9 com-bined with the evolution of the isotherms on a large range of pH demonstrates that DMF plays a huge role in the behavior of the PS-b-PAA monolayers, whatever the pH. It indeed extends the conclusions we obtained at pH 2 when blocks are neutral up to the charged polymer chains case. DMF stays partially within PS blocks and is progres-sively expelled upon compression. DMF does not com-pletely dissolve in the water subphase but a part remains at the surface in the monolayer due to solubility issues, as seen previously in bulk experiments on PS-b-PAA aggre-gates in water [24]. Then, the partition of DMF between PS and water partially controls the behavior of the mono-layer. Such monolayer acts thus like as a sponge with respect to DMF. Thus, when an expansion is performed after a compression, the DMF comes back swell the layer as soon as the PS domains of the surface nanostructures become accessible again. It is worth noting that the pres-ence of DMF enables inner reorganizations within the monolayer since PS blocks are not frozen at room tem-perature, whereas they should be frozen without DMF (Tg
of PS is around 40°C for a molar mass of 3000 g/mol [25]).
1 2 3 4 5 6 7 8 9 10 11 12 13 14 15 16 17 18 19 20 21 22 23 24 25 26 27 28 29 30 31 32 33 34 35 36 37 38 39 40 41 42 43 44 45 46 47 48 49 50 51 52 53 54 55 56 57 58 59 60
Figure 9. Schematic representations of the surface evolution of the PS-b-PAA at pH9 under surface pressure variations. (PS is
depicted in red domains, PAA in green domains, DMF in yellow, and water in blue. Black arrows indicate the barriers displace-ment and yellow arrows indicate the DMF motion. The color of PS domains changes with 2D pressure, as it depends on the amount of DMF that remains trapped inside the monolayerThe same scheme is provided in supplementary information from the point of view of electronic contrast.
Since PS-b-PAA copolymer chains are perfectly solubil-ized in the initial deposit solution [16], the association of chains onto the surface results from a spinodal decompo-sition process that occurs just after deposit during DMF removal in the out-of-equilibrium ternary system PS-b-PAA/DMF/water at the air/water interface. When all DMF molecules in excess have gone into water, the pro-cess is over, which fixes the characteristic wavelength and therefore the typical size of the domains. Such spinodal decomposition process is influenced by pH and solvation of PAA blocks in the subphase at the time of molecules deposit. The typical size of the domain is indeed smaller at pH 9 than at pH 2 where the uncharged PAA blocks stay adsorbed at the surface. Such typical size sets the amount of DMF that remains in the monolayer. Indeed, the experiments where pH is in situ adjusted from pH 2 to pH 9 demonstrate that less solvent molecules stay within the monolayer when the deposit is made at pH 9 than at pH 2.
Apart from the spreading solvent, electrostatic repul-sions play a strong role. We remind that the ionic strength remains lower than 2.3 10-5 mol/L at maximum in the pH range where PAA blocks are charged (5 < pH < 9),
i.e. the Debye length extends up to distances larger than
50 nm. PAA blocks are stretched and repel themselves. This is consistent with SNR that enable to recover an osmotic brush behavior. These strong repulsions make the monolayer poorly compressible and hinder in-plane reorganizations. This forces a part of the nanostructures present on the surface to be transferred from the interface to the volume when the surface pressure increases, as shown by the apparition of the second thick PS layer in SNR measurements. However, this transition from surface nanostructures to volume is reversible, as shown by GISAXS curves over several compression/decompression cycles. This reversibility suggests that the copolymer film starts buckling and deforms by creating invaginations between the interface and volume when increasing sur-face pressure. Indeed, if this transfer to the volume were definitive, there would be a significant loss of material, which is not observed. The loss is indeed very limited and
must take place as aggregates, presumably micelles owing to the packing parameter resulting from the ratio of the PAA to PS block units of the copolymer chains [26].
CONCLUSIONS
Our results on both subphases, pH 2 and pH 9 lead at least to the same conclusion. Contrary to most usual sur-factant small molecules, the solvent used for the surface deposit plays an active role when the deposited layer consists of long amphiphilic molecules such as copolymer chains. The presence of the pseudoplateau and its evolu-tion as funcevolu-tion of pH is the signature of such solvent effect on the surface-pressure versus surface density iso-therms. Moreover, there is a subtle interplay between the conjugate effects of spreading solvent spreading and elec-trostatic interactions within the monolayer than can in-duce structural changes. The use of neutrons and X-rays surface scattering techniques appears as a mandatory tool to probe the film behavior.
ASSOCIATED CONTENT
Supporting Information. All experimental details
concern-ing Specular Neutron Reflectivity; all experimental details concerning GISAXS measurements; description of protocols designed to transfer the PS-b-PAA monolayer onto the hy-drophobic wafer that ensures that sample stays maintained in liquid environment; isotherm at pH 9 over several cycles of compression/decompression; evolution of isotherms when changing the pH in situ in the subphase in order to pass from pH 2 to pH 9, respectively from pH 9 to pH 2; Table recalling the excess mass Γ obtained from SNR as function of molecu-lar area A; comparison of the fit of SNR data of Figure 5.a with either a one-layer model or a two-layers model; model-ling of I versus Qz at Qxy* in GISAXS experiments; modelling of the correlation peak observed in GISAXS experiment ena-bling to obtain its intensity and its position Qxy*; AFM pic-ture of the monolayer where a hole was made with the AFM tip; schematic representation of the surface evolution of the PS-b-PAA at pH9 from the point of view of electronic con-trast. This material is available free of charge via the Internet at http://pubs.acs.org. 1 2 3 4 5 6 7 8 9 10 11 12 13 14 15 16 17 18 19 20 21 22 23 24 25 26 27 28 29 30 31 32 33 34 35 36 37 38 39 40 41 42 43 44 45 46 47 48 49 50 51 52 53 54 55 56 57 58 59
AUTHOR INFORMATION Corresponding Author *E-mail: michel.goldmann@insp.upmc.fr. *E-mail: fabrice.cousin@cea.fr. Present Addresses ‡
Z.G.: LICORNE, ECE-Paris, 37 quai de Grenelle, 75725 Paris Cedex 15, France.
Notes
The authors declare no competing financial interest.
ACKNOWLEDGMENT
The authors thank Dr Oleg Konovalov and Dr Rana Fahra for their help during GISAXS experiments.
REFERENCES
[1] K. Kita-Tokarczyk, M. Junginger, S. Belegrinou, and A. Taubert, “Amphiphilic Polymers at Interfaces,” Adv. Polym. Sci., vol. 242, pp. 151–201, 2011.
[2] E. Mouri, P. Kaewsaiha, K. Matsumoto, and H. Mat-suoka, “Effect of Salt Concentration on the Nanostructure of Weak Polyacid Brush in the Amphiphilic Polymer Monolayer at the Air/Water Interface,” Langmuir, no. 25, pp. 10604–10611, 2004.
[3] P. Kaewsaiha, K. Matsumoto, and H. Matsuoka, “Salt Effect on the Nanostructure of Strong Polyelectrolyte Brushes in Amphiphilic Diblock Copolymer Monolayers on the Water Sur-face,” Langmuir, no. 22, pp. 7065–7071, 2007.
[4] D. Xie, C. a. Rezende, G. Liu, S. Pispas, G. Zhang, and L. T. Lee, “Effect of hydrogen-bonding complexation on the interfacial behavior of poly(isoprene)-b-poly(ethylene oxide) and poly(isoprene)-b-poly(acrylic acid) Langmuir monolayers,” J. Phys. Chem. B, vol. 113, no. 3, pp. 739–744, 2009.
[5] E. P. K. Currie, a. B. Sieval, G. J. Fleer, and M. a C. Stu-art, “Polyacrylic acid brushes: Surface pressure and salt-induced swelling,” Langmuir, vol. 16, no. 22, pp. 8324–8333, 2000.
[6] K. Ariga, Y. Yamauchi, T. Mori, and J. P. Hill, “25th An-niversary Article : What Can Be Done with the Langmuir-Blodgett Method ? Recent Developments and its Critical Role in Materials Science,” Adv. Mater., vol. 25, pp. 6477–6512, 2013.
[7] H. D. Bijsterbosch, V. O. de Haan, A. W. de Graaf, M. Mellema, F. A. M. Leermakers, M. A. C. Stuart, and A. A. Van Welp, “Tethered Adsorbing Chains: Neutron Reflectivity and Surface Pressure of Spread Diblock Copolymer Monolayers,” Langmuir, vol. 11, no. 14, pp. 4467–4473, 1995.
[8] J. K. Cox, K. Yu, B. Constantine, A. Eisenberg, and R. B. Lennox, “Polystyrene - Poly ( ethylene oxide ) Diblock Copoly-mers Form Well-Defined Surface Aggregates at the Air / Water Interface,” Langmuir, no. 7, pp. 7714–7718, 1999.
[9] R. B. Cheyne and M. G. Moffitt, “Novel Two-Dimensional ‘ Ring and Chain ’ Morphologies in Langmuir - Blodgett Monolayers of PS- b -PEO Block Copolymers : Effect of Spreading Solution Concentration on Self-Assembly at the Air - Water Interface,” Langmuir, vol. 21, pp. 5453–5460, 2005.
[10] M. C. Faure, P. Bassereau, L. T. Lee, A. Menelle, and C. Lheveder, “Phase Transitions in Monolayers of PS - PEO
Copol-ymer at the Air - Water Interface,” Macromolecules, vol. 32, pp. 8538–8550, 1999.
[11] E. P. K. Currie, a. B. Sieval, M. Avena, H. Zuilhof, E. J. R. Sudhölter, and M. a. Cohen Stuart, “Weak Polyacid Brushes: Preparation by LB Deposition and Optically Detected Titra-tions,” Langmuir, vol. 15, no. 21, pp. 7116–7118, 1999.
[12] P. Muller, G. Sudre, and O. Théodoly, “Wetting transi-tion on hydrophobic surfaces covered by polyelectrolyte brush-es,” Langmuir, vol. 24, no. 17, pp. 9541–9550, 2008.
[13] B. Liberelle and S. Giasson, “Friction and Normal In-teraction Forces between Irreversibly Attached Weakly Charged Polymer Brushes,” Langmuir, vol. 24, no. 4, pp. 1550–1559, 2008.
[14] X. Wang, X. Ma, and D. Zang, “Aggregation behavior of polystyrene-b-poly(acrylic acid) at the air–water interface,” Soft Matter, vol. 443, pp. 443–453, 2013.
[15] O. Theodoly, a. Checco, and P. Muller, “Charged di-block copolymers at interfaces: Micelle dissociation upon com-pression,” EPL, vol. 90, no. 2, p. 28004, 2010.
[16] Z. Guennouni, F. Cousin, F. Marie-Claude, P. Perrin, D. Limagne, O. Konovalov, and M. Goldmann, “Self-organization of PS-b-PAA monolayer at the air/water interface: a process driven by the release of the solvent spreading,” Langmuir, vol. 32, no. 8, pp. 1971–1980, 2016.
[17] F. Cousin, F. Ott, F. Gibert, and A. Menelle, “EROS II: A boosted time-of-flight reflectometer for multi-purposes appli-cations at the Laboratoire Léon Brillouin,” Eur. Phys. J. Plus, vol. 126, no. 11, pp. 1–11, 2011.
[18] Y. Han, D. Mayer, A. Offenha, and S. Ingebrandt, “Sur-face activation of thin silicon oxides by wet cleaning and silani-zation,” Thin Solid Films, vol. 510, pp. 175–180, 2006.
[19] T. J. Joncheray, S. A. Bernard, R. Matmour, B. Le-poittevin, R. J. El-Khouri, D. Taton, Y. Gnanou, and R. S. Duran, “Polystyrene-b-poly(tert-butyl acrylate) and polystyrene-b-poly(acrylic acid) dendrimer-like copolymers: two-dimensional self-assembly at the air-water interface.,” Langmuir, vol. 23, no. 5, pp. 2531–8, Feb. 2007.
[20] P. Pincus, “Colloid Stabilization with Grafted Polyelec-trolytes,” Macromolecules, vol. 24, pp. 2912–2919, 1991.
[21] E. B. Zhulina, O. V. Borisov, and T. M. Birshtein, “Structure of grafted polyelectrolyte layer,” J. Phys. II Fr., vol. 2, no. 1, pp. 63–74, 1992.
[22] E. B. Zhulinao and O. V. Borisov, “Structure and inter-action of weakly charged polyelectrolyte brushes : Self-consistent field theory,” J. Chem. Phys., vol. 107, no. 15, p. 5952, 1997.
[23] Y. Tran, P. Auroy, and L. T. Lee, “Determination of the Structure of Polyelectrolyte Brushes,” Macromolecules, vol. 32, no. 26, pp. 8952–8964, 1999.
[24] Y. S. Yu, L. F. Zhang, and A. Eisenberg, “Morphogenic effect of solvent on crew-cut aggregates of apmphiphilic diblock copolymers,” Macromolecules, vol. 31, no. 97, pp. 1144–1154, 1998.
[25] T. G. Fox and P. J. Flory, “Second-Order Transition Temperatures and Related Properties of Polystyrene. I. Influence of Molecular Weight,” J. Appl. Phys., vol. 21, no. 6, p. 581, 1950.
[26] Y. Mai and A. Eisenberg, “Self-assembly of block copol-ymers,” Chem. Soc. Rev., no. 41, pp. 5969–5985, 2012.
1 2 3 4 5 6 7 8 9 10 11 12 13 14 15 16 17 18 19 20 21 22 23 24 25 26 27 28 29 30 31 32 33 34 35 36 37 38 39 40 41 42 43 44 45 46 47 48 49 50 51 52 53 54 55 56 57 58 59 60
12
Insert Table of Contents artwork here
1 2 3 4 5 6 7 8 9 10 11 12 13 14 15 16 17 18 19 20 21 22 23 24 25 26 27 28 29 30 31 32 33 34 35 36 37 38 39 40 41 42 43 44 45 46 47 48 49 50 51 52 53 54 55 56 57 58 59 60