A Demand Responsive Bidding Mechanism
with Price Elasticity Matrix in Wholesale Electricity Pools
by
Jiankang Wang
E.B., Zhejiang University, 2007
Submitted to the Department of Electrical Engineering and Computer Science in partial fulfillment of the requirements for the degree of
Master of Science MASSACHUSETTS INSTrTUTE
OF TECHNOLOGY atthe
MASSACHUSETTS INSTITUTE OF TECHNOLOGY
AUG
07 2009
June 2009
LIRAR
LIBRAR© Massachusetts Institute of Technology MMVIII. All rights resIES 0 Massachusetts Institute of Technology MMVIII. All rights reserved.
Author ...
Department of Electrical Igineering hd Computer Science May 21, 2009
Certified by ..
Certified by ...
[/ "James L. Kirtley
Professor, Department of Electrical Engineering and Computer Science Thesis Supervisor
...
...
..
..
/
Scott KennedyAssociate Professor, Water and Environment Program Masdar Institute of Science and Technology Thesis Supervisor .~-/9 R
Accepted by ...
Terry Orlando Chairman, Department Committee on Graduate Students
A Demand Responsive Bidding Mechanism
with Price Elasticity Matrix in Wholesale Electricity Pools
byJiankang Wang
Submitted to the Department of Electrical Engineering and Computer Science on May 21, 2009, in partial fulfillment of the
requirements for the degree of Master of Science
Abstract
In the past several decades, many demand-side participation features have been applied in the electricity power systems. These features, such as distributed generation, on-site storage and demand response, add uncertainties to both the short-term and long-term operation of the modem power systems. On the contrary, many modem power systems are characterized by the deregulated market structure. How to operate these features under deregulated power markets is worth consideration.
This thesis presents a new demand responsive bidding mechanism in wholesale electricity pools. The proposed bidding mechanism models demand response with Price Elasticity Matrices (PEM). Under the proposed bidding mechanism, the resultant generation schedules and electricity rates become dependent variable on demand response. This relation gives bidding results that are closer to the actual market equilibrium. By applying this bidding mechanism, more efficient market behaviors are achieved in the short term, and generation and transmission resources are better utilizes in the long term. In addition, compared to the market clearing price and generation dispatch schedule settled by the traditional bidding mechanisms, bidding results obtained under our proposed mechanisms are more effective instructions for the design and implementation of demand-side participation programs.
This thesis presents the design of the proposed bidding mechanism in terms of its bidding rules, bidding acceptance rules and settlement rules. The bidding mechanism's mathematical model is formulated as an optimization problem. Bidding results are obtained as closed-formed solution of the optimization problem. In addition, this thesis presents an improved market interaction algorithm to implement the bidding mechanism. Multiple benefits of applying the bidding mechanism are shown by numerical example under various system statuses and end-user response types.
Thesis supervisor: James L. Kirtley Title: Professor of Electrical Engineering
Acknowledgements
I would like to thank my thesis advisor, Professor James L. Kirtley for his guidance and support throughout the course of this thesis. I would like to thank Dr. Scott Kennedy, associate professor at Masdar Institute of Science and Technology, for his advisory work of this thesis. I enjoyed working with you both, and I appreciate your dedication to your students and to the field of engineering.
I want to thank all of the staff members and my fellow students from LEES who were always willing to help out. Special thanks to Yihui Qiu, Yehui Han, Riccardo Signorelli, Jing Ying Hu, Jae-Won George Hwang, Anthony Sagneri and Wei Li to their help in the lab, and to Vivian Mizuno for her support.
Thanks to my sponsor: The MIT Masdar Program.
Most importantly, I want to thank my family and especially my parents Qinghua Wang and Anning Xia, for their love and encouragement. I would not be where I am today if not for you.
Contents
1 Introduction ... 15
1.1 O verview ... ... 15
1.2 Outline and Contributions... 17
2 Background ... 19
2.1 Electricity M arket ... ... 19
2.1.1 Electricity Market Deregulation ... ... 19
2.1.2 Deregulated Electricity Market Structure ... 23
2.1.3 Deregulated Electricity Market Architecture... 27
2.2 Demand Response... 32
2.2.1 Demand Response's Role in the U.S. Power Systems... 32
2.2.2 Demand Response's Working Principles... ... 36
2.2.3 Demand Response's Problems and Challenges in the U.S. Power S y stem s ... 39
2.3 Existing bidding mechanisms ... ... 41
2.3.1 Auctions in Day-Ahead Pool Electricity Markets ... 42
2.2.2 Alternative bidding mechanisms in DA markets ... 45
2.3.3 Settlement Rules in Real-Time Markets ... 51
3 A Demand Responsive Bidding Mechanism with Price Elasticity Matrix ... 55
3.1 The bidding rules ... 56
3.2 Bidding Acceptance Rules and Settlement Rules ... 60
3.2.1 under Traditional Bidding Mechanism ... 60
3.2.2 under Proposed Bidding Mechanism ... 68
3.2.3 Sensitivity Analysis of the Proposed Bidding Mechanism... 76
3.3 The Price Elasticity M atrix ... ... ... 80
3.3.1 Classifications of the Price Elasticity Matrix... 80
3.3.2 Factors Affecting the PEM's Establishment... 82
3.3.3 Estimation of the PEM... ... 88
3.4.1 The Disadvantages of the Market Interaction Algorithm ... 93
3.4.2 The Improved Market Interaction Algorithm ... 97
4 Numerical Examples ... 103
4.1 Simulation Environment and Data Background ... 103
4.2 Examples under Various End-User Types ... 107
4.3 Example under Multiple End-User Types ... 124
4.4 Examples under Systems with Contingencies ... 128
4.5 Examples under the System with Renewable Energy in DA and HA m ark ets .. ... ... ... ... ... ... 139 4.6 Examples of Non-convergences ... 170 5 Conclusion ... ... 185 Appendix A ... 187 A ppendix B ... 189 Bibliography ... ... 219
List of Figures
Fig. 2.1.1 The deregulation of the electricity markets in the United States... 21
Fig. 2.1.2: Carbon dioxide emission in regulated and deregulated electricity market... 23
Fig. 2.1.3 Participants in deregulated electricity markets ... 25
Fig. 2.1.4 Market types and centralization degree of the market ... 28
Fig. 2.2.1 Source: Data from NERC 1998 and 2003 summer assessments. NPCC* data is for 1998 and 2002 ... 35
Fig. 2.2.2 a simplified illustration on how DR works by increasing demand elasticity... 38
Fig. 2.3.1: Net consumer surplus, producer surplus and social welfare in market transactions. ... 48
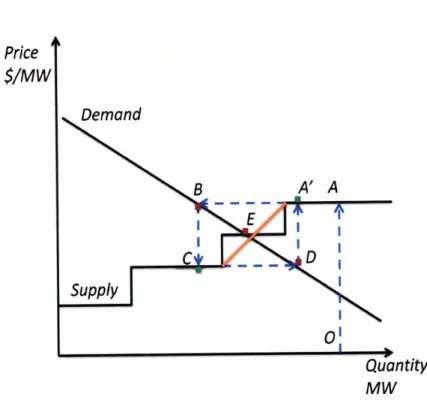
Fig. 3.1.1 Searching the market equilibrium with elasticity, reference points and operation lim its ... ... ... 57
Fig. 3.3.1 End-user response types modeled by PEMs ... 82
Fig. 3.3.2 The row dimension and column dimension of a PEM reflects affecting and affected periods in the timeframe of interest. ... 83
Fig. 3.3.3 the PEM entries' database. ... 85
Fig. 3.3.4 Notification timing of incentive-based demand response programs on load profiles. ... 86
Fig. 3.3.5 the PEM entry varies with demand and price changes ... 89
Fig. 3.4.1 the m arket interaction algorithm ... ... 92
Fig. 3.4.2 The market interaction algorithm with multiple end-user types... 93
Fig. 3.4.3 Non-convergence caused by steep local relative slope of the supply curve... 94
Fig. 3.4.4 Non-convergence caused by demand clears the market ... 97
Fig. 3.4.5: The improved market interaction algorithm ... 98
Fig. 3.4.6: Searching for the market equilibrium under non-convergence ... 99
Fig. 3.4.7 Oscillations happens at multiple hours ... 100
Fig. 4.1.1 Control region map of the NYISO. ... 105
Fig. 4.2.1 Reference load and price of five-period retailers' bids ... 108
Fig. 4.2.2 Reference load and price of 24-period retailers' bids... 108
Fig. 4.2.3: Market equilibriums under the nice end-user types. ... 123
Fig. 4.3.1 Reference load and price of five-period retailers' bids ... 124
Fig. 4.3.2 Reference load and price of 24-period retailers' bids... 125
Fig. 4.3.1 G2's generation cost. ... 129 11
Fig. 4.3.2 G2's generation capacity. ... 129
Fig. 4.3.3 G2's generation cost. ... 130
Fig. 4.3.2 G2's generation capacity. ... 130
Fig. 4.5.1 Updated PEM for hourly bidding process in the HA market. ... 140
Fig. 4.5.2 The measured wind capacity after the 24 hourly biddings in the HA market 167 Fig. 4.5.3 The final payment from the retailers in the HA market under the proposed bidding mechanism ... 167
Fig. 4.5.4 The final payment to the suppliers in the HA market under the proposed bidding m echanism ... ... . 168
Fig. 4.5.5 The final payment from the retailers in the HA market under the SHB... 168
Fig. 4.5.6 The final payment to the suppliers in the HA market under the SHB... 169
Fig. 4.5.1: The non-convergent load profile caused by demand clears the market at a single hour. ... 172
Fig. 4.5.2: The non-convergent market clearing price caused by demand clears the market at a single hour ... . . ... 172
Fig. 4.5.3: The load profile at the market equilibrium ... 173
Fig. 4.5.4: The market clearing price at the market equilibrium. ... 173
Fig. 4.5.5 The non-convergent load profile caused by steep local relative slope of the supply curve ... ... 175
Fig. 4.5.6: The non-convergent market clearing price caused by steep local relative slope of the supply curve ... 175
Fig. 4.5.7 The load profile of the market equilibrium. ... 176
Fig. 4.5.8 The market clearing price of the market equilibrium ... 176
Fig. 4.5.9: The non-convergent load profile caused by demand clears the market and shifting effects... . . ... 178
Fig. 4.5.10: The non-convergent market clearing price caused by demand clears the m arket and shifting effects... 179
Fig. 4.5.11: The load profile of the market equilibrium. ... 179
Fig. 4.5.12 : The market clearing price of the market equilibrium ... 180
Fig. 4.5.13: The non-convergent load profile caused by demand clears the market at m ultiple hours ... ... . 182
Fig. 4.5.14: The non-convergent market clearing price caused by demand clears the m arket at m ultiple hours ... ... 182
Fig. 4.5.15 The load profile of the market equilibrium derived from figure 4.5.13 and figure 4.5.14 ... . 183
Fig. 4.5.16: The market clearing price of the market equilibrium derived from figure 4.5.13 and figure 4.5.14 ... 183
List of Tables
TABLE 2.2.1 Stages of electricity market deregulation... ... 27 TABLE 4.2.1 Generation Param eters ... 107 TABLE 4.2.3 Bidding results of the proposed bidding mechanism under nine end-user types (5 periods)... 112 TABLE 4.2.4 Bidding results of the proposed bidding mechanism under nine end-user types (24 periods)... 117 TABLE 4.3.1 Bidding results of the proposed bidding mechanism under multiple end-user types ... 127 TABLE 4.4.1 Bidding results of the proposed bidding mechanism under system
contingencies (5-period) ... ... 132 TABLE 4.4.2 Bidding results of the demand inelastic bidding mechanism under system contingencies (5-period) ... 133 TABLE 4.4.6 Bidding results of the Single Hourly Bidding (SHB) under system
contingencies (5-period) ... 134 TABLE 4.4.4 Bidding results of the proposed bidding mechanism under system
contingencies (24-period) ... 135 TABLE 4.4.5 Bidding results of the inelastic demand bidding mechanism under system contingencies (24-period) ... 136 TABLE 4.4.6 Bidding results of the Single Hourly Bidding (SHB) under system
contingencies (24-period) ... 137 TABLE 4.5.1 The bidding results of the proposed bidding mechanism with renewable energy in the HA market (Before Processed) ... 142 TABLE 4.5.2 The bidding results of the proposed bidding mechanism with renewable energy in the HA market (After Processed) ... 150 TABLE 4.5.3 The bidding results of the Single Hourly Bidding (SHB) with renewable energy in the HA market ... 158 TABLE 4.4.1 Parameters of Hour 2, Hour 7 and Hour 19 (H2, H7, H19) ... 181
Chapter 1
Introduction
1.1 Overview
During the past several decades, people have been constantly making effort to reduce the conflict between growing demand load and limited generation. To solve these problems, demand-side participation features, such as distributed generation, on-site storage and demand response programs, have been added to the modem power system [1-3]. Although the emergence of these features brings about more flexibility and options to both the supply and demand side, they also increase uncertainties in the power systems. For example, by sending certain price signals, some demand response programs can instruct end users to curtail, store or shift their potentially consumed electric energy. This operation may lead to temporary demand relief and price spike reduction. However, the resultant load profile of each time-period and the total energy to consume becomes different from the forecasted load value. Thus, in short-term power system operations like day-ahead electricity market, it is hard for system operators to predict the demand and to dispatch the generation for the next day; in long-term planning, planners may have difficulties to decide the capacity of the generation and transmission capacity.
So far, electricity market deregulation has been suggested as an effective measure for better utilizing generation and transmission resources as well as reducing electricity cost on both supply and demand sides. In the many deregulated electricity markets, bid-based auctions determine the electricity rate and generation schedules by solving optimization problems. This process makes the resultant electricity rate and generation schedules dependent variables on the forecasted demand. How to design and implement the mentioned features, such as demand response programs, under the complex deregulated market context is another problem in modem power systems [4-6].
The problem generated by the demand-side participation features and the deregulated market structure of modem power systems cannot be solved by only considering the demand-side participation or the electricity market separately [7, 8]. On
one hand, among all these demand-side participation features, demand response programs have the most extensive effect on power systems and all end users. On the other hand, in the deregulated electricity markets, generation schedules and electricity rates are determined through bid-based auctions (which are also called bidding mechanisms). Therefore, a bidding mechanism considering demand-side market participation is a promising direction to solve the mentioned problems arising from both sides. However, the existing bidding mechanisms either ignore the demand-side or only cover limited form of the demand response programs (demand-side bid in emergency market), and fail to address the full mentioned features [8-10].
For this reason, this thesis presents a new demand responsive bidding mechanism in wholesale electricity pools. The proposed bidding mechanism models demand response with Price Elasticity Matrices (PEM). Under the proposed bidding mechanism, the resultant generation schedule and electricity rate become dependent variable on demand response. This relation gives bidding results that are closer to the actual market equilibrium. By applying this bidding mechanism, more efficient market behaviors are achieved in the short term and generation and transmission resources are better utilized in the long term. In addition, compared to the market clearing price and generation dispatch schedule settled by the traditional bidding mechanisms, bidding results obtained under our proposed mechanisms are more effective instructions for the design and implementation of the demand-side participation programs.
1.2 Outline and Contributions
This section includes an outline of the rest of the thesis. Chapter 2 gives the background of electricity markets, demand response and bidding mechanism designs. Section 2.1 introduces the concept of electricity market deregulation, the electricity market structures and architectures after deregulation. Section 2.2 introduces demand response's working principle and its role in the U.S. electricity markets. Furthermore, it states the problems and challenges that demand response brings to the U.S. electricity markets. Section 2.3 presents the designs of bidding mechanisms in electricity markets. It introduces the three parts of a bidding mechanism: bidding rules, bidding acceptance rules and settlement rules. Traditional bidding mechanisms in day-ahead market and real-time market are reviewed by these parts in this section.
After the background chapter, all the material presented is original, except for that which is repeated to show how it can be generalized by or compared to our new results. In Chapter 3 we cover those contributions which are of a theoretical nature.
* We propose a demand responsive bidding mechanism, which considers end-user response with inter-temporal load shifting. Bidding rules, bidding acceptance rules and settlement rules are defined for this bidding mechanism. PEMs are used to model all end-user response types. Bidding results obtained from the proposed bidding mechanism are closer to the actual market equilibrium.
* A mathematical model of the proposed bidding mechanism is formulated as an optimization problem. By deriving the closed-form solution of this problem, we show that the pricing structure of the proposed bidding mechanism is the same as the spot pricing structure proposed in Schweppe's work [11, 12]. In addition, we show that the shadow prices of the generation and demand inter-temporal conditions are included in the market clearing price under the proposed bidding mechanism.
* We give the sensitivity analysis of the proposed bidding mechanism under four disturbances: change in generation cost, changing in generation capacity, change in transmission limits and change in demand response programs. The robust conditions under these four disturbance types are derived.
* We give a full classification of the PEMs based on end-user response types. Furthermore, we point out the factors affecting the PEM's establishment: affecting periods, affected periods and incentive timings of demand response programs. We also present several methods of estimating the PEMs.
* Based on the market interaction algorithm proposed in David's work [13], we propose an improved algorithm for the proposed bidding mechanism. This improved algorithm can detect the two causes for market non-convergence: demand clears the market and steep local relative slope of the supply curve, where the second condition and the concept of relative slope is defined originally in this work. By applying this improved algorithm, market equilibriums are found in the previous non-convergent cases.
Chapter 4 presents numerical examples of the proposed bidding mechanism in day-head and hourly-ahead markets. Section 4.1 states the simulation environment and data background of the numerical examples. Section 4.2 and Section 4.3 give numerical examples under various end-user response types. Section 4.4 gives examples under system with generation-side contingencies. Section 4.5 gives examples under systems with renewable energy. Section 4.6 shows different non-convergence cases and how market equilibriums are found in these cases according to the proposed algorithm.
Chapter 2
Background
2.1 Electricity Market
An electricity market is a system for selling and purchasing electricity, using supply and demand to set the prices and schedules under given physical constraints. The design of an electricity market defines the physical dispatching procedure in the short term, and thus affects the power systems' planning decision in the long term. A basic understanding of electricity markets is essential for us to study the bidding mechanisms and the demand-side participation activities in the environment. This section introduces an important characteristic of modem electricity market deregulation. It also provides an overview of the structures and architectures of deregulated electricity markets.
2.1.1 Electricity Market Deregulation
History of electricity market deregulation
The concept of electricity market deregulation was first raised by Samuel Insull, who was elected president of the National Electric Light Association in 1898. In his historic presidential address to NELA, Insull explained not only why the electricity business was a "natural monopoly" but why it should be regulated and why this regulation should be at the state level, not the local level. Insull argued that
exclusive franchises should be coupled with the conditions of public control, requiring all charges for services fixed by public bodies to be based on cost plus a reasonable profit.
These ideas led directly to regulatory laws passed by New York and Wisconsin in 1907. Unfortunately, the deregulation resultant from the action of these laws was
unsuccessful. Both the end-users and the supply side agreed that competition was inefficient and that providing electricity was a natural monopoly.
Until the early 1980s, the energy market concepts and privatization to electric power systems was again brought up in Chile. The Chilean model was generally perceived as successful in bringing rationality and transparency to power pricing, but it
suffered from the continuing dominance of several large incumbents and the attendant structural problems. Argentina improved on the Chilean model by imposing strict limits on market concentration and by improving the structure of payments to units held in reserve to assure system reliability. During the 1990s, the World Bank was active in introducing a variety of hybrid markets in other Latin American nations, including Peru, Brazil and Colombia, with limited success.
In 1990, the UK Government under Margaret Thatcher privatized the UK Electricity Supply Industry. The process followed by the British was then used as a model or at least a catalyst for the deregulation of several other Commonwealth countries, notably Australia and New Zealand, and regional markets such as Alberta. However, in many of these other instances the market deregulation occurred without the widespread privatization that characterized the UK example.
China dismantled the State Power Corporation on December 29, 2002 and set up 11 new companies in a move to end the corporation's monopoly of the power industry. The former State Power Corporation owned 46% of the country's electricity generation assets and 90% of the electricity supply assets. The new companies include two power grid operators, namely the State Power Grid and China South Power Grid. Each of the five electricity generation companies own less than 20% of China's market. They will compete with each other for signing contracts with the power grid operators. The country also set up the State Power Regulatory Commission on December 30, 2002, to supervise market competition and issue licenses to operators in the power industry [14].
Today, more than a dozen semi-deregulated electricity markets are operating in at least ten countries, with several operating in the United States, shown in figure 2.1.1. Between 1997 and 2007, the amount of competitive generation has increased almost five-fold, from 8.5% to 40% of the total U.S. generation capacity [ 10].
Fig. 2.1.1 The deregulation of the electricity markets in the U.S. The colored regions are the electricity markets that have been deregulated.
Benefits of electricity market deregulation
Until now, competition in wholesale power markets, as one stage of electricity market deregulation has been, and continues to be fostered by national policy. In each major energy bill over the last few decades, Congress has acted to open up the wholesale electric power market by facilitating entry of new generators to compete with traditional utilities. As the third major federal law enacted in the last 30 years to embrace wholesale competition, the Energy Policy Act of 2005 strengthened the legal framework for continuing wholesale competition as federal policy for this country. The Commission has acted quickly and strongly over the years to implement this national policy. The execution of these policies and the electricity market practice for many years has proved that multiple benefits can be achieved through electricity market deregulation. These benefits include [3, 15]:
stronger cost-minimizing incentives than typical "cost-of-service" regulation. These incentives result in suppliers making many kinds of cost-saving innovations more quickly. These include labor saving techniques, more efficient repairs, cheaper construction costs on new plants, and wiser investment choices.
* lower price to marginal cost. Sioshansi [10] argues that this is less of an advantage simply because traditional regulation has stressed this side of the regulatory trade-off. However, more agree that price minimization can still be a significant advantage.
* more accurate pricing. This can be done through demand-side market participation (which is introduced in section 2.3). Because it imposes the real-time wholesale spot prices on the retailer's marginal purchases, wholesale competition should encourage real-time pricing for end-users. As evidence, the amount of load enrolled in demand-response programs [3] in summer 2007, was 20,864 MW of demand-response resources - the equivalent of 40 commercial-sized base-load generation units enrolled in the U.S. deregulated electricity markets.
* less pollution. Competitive electricity markets are not the single driver behind these regional differences, but the efficiency gains, wide geographic footprints and integration of renewable energies that accompany competition will become even more necessary with the approach of new climate change regulations. Restructured markets are clearly leading the way in addressing climate change, shown in figure 2.1.2.
* encouraging innovations. Distributed generation is an area in which innovations arise much more quickly under competition than under regulation; cogeneration is an example. Regulated utilities found such projects extremely awkward at best, so avoided them. A competitive market
easily allows the flexibility that such projects require.
* getting both incentives of innovation and prices right at the same time. Again cogeneration provides an example. Once regulation decided to encourage it, they needed to price cogenerated power. A formula was designed with the
intuition of mimicking a market price. Naturally, political forces intervened and the result was long-term contracts signed at very high prices [15]. These gave strong, probably much too strong, incentives for cogeneration. A competitive market can get both incentives and prices right at the same time.
Carbon Dioxide Emissions in
Restructured vs. Non-Restructured States Per Megawatt Hour
Fig. 2.1.2: Carbon dioxide emission in regulated and deregulated electricity market.[15]
2.1.2 Deregulated Electricity Market Structure
Participants in deregulated electricity markets
The electric power sectors in the United States can be described as generation, transmission, distribution and end-users, from where electricity is generated to where it is
consumed.
The generation of electricity involves the creation of electric energy using falling water, internal combustion engines, steam turbines powered with steam produced with fossil fuels, nuclear fuel and various renewable fuels, wind driven turbines and photovoltaic technologies. Different types of generating plants are characterized by different shares of fixed and variable cost. This cost structure means there is an order for
plant dispatch, the so-called "merit order", which minimizes total costs, bringing plant into operation as demand rises. Hence in a cost-based system, capacity with low variable and high fixed cost, such as nuclear, is operated as much as possible. This type of capacity is called base load. The reverse holds for the type of gas plants referred to above, which are operated at peak or intermediate load.
The transmission of electricity involves the use of wires, transformers and substation facilities to enable the high voltage "transportation" of electricity between generating sites and distribution centers. In regulated electricity markets, the transmission networks are owned by the utilities, who also own the generation and distribution sectors; in deregulated electricity markets, the transmission networks are owned by an Independent System Operator (ISO) or a Regional Transmission Organization (RTO) [8]. The distribution of electricity to end-users and local businesses at relatively low voltages relies on wires and transformers along and under streets and other rights of way. The distribution functions typically involves both the provision of the services of the distribution "wires" to end-users as well as a set of retailing functions. These retailing functions include making arrangements for supplies of power from generators, metering, billing and various demand management services.
End-users are residences and businesses who consume electricity. By their load profiles' characteristics, the end-users are usually classified as industrial, commercial and residential consumers.
Eupli
Competitive Electricity
Market
Supply
tmnd
brond
De mnd Supply
Fig. 2.1.3 Participants in deregulated electricity markets.[8]
Wholesale and retail electricity markets
Financially, after being generated, a single megawatt, is frequently bought and re-sold a number of times before finally being consumed. Those "re-sale" transactions make-up the retail electricity market; the other transactions, which are considered "sales for re-sale," make-up the wholesale electricity market, see figure 2.1.3.
In the retail market, the retailers, who resale electricity, represent the suppliers. The end-users select the retailers for the electricity supply based on their services and prices. This market is out of the scope of this paper.
The wholesale market participants include suppliers who can generate power and connect to the grid, and retailers which are counterparties willing to buy the suppliers' output. The suppliers include utilities, independent power producers (IPPs), as well as some excess generation sold by traditional vertically integrated utilities. Retailers usually own the distribution wires connecting to the end-users. To be a participant in the wholesale market, however, one does not need to either own any generation or serve any end-use customers. Just as with many other commodities - pork bellies, oil or stocks
-individual traders (or power marketers) exist who buy power on the open market and
re-I
Gneato 9Generator#2
Rldfle # R jIer#
C u ---.t o rr, Y #1
sell it. Depending on the market structures, an ISO or TRO is needed to run the transactions in the wholesale markets under given physical conditions of the power systems.
Stages of electricity markets deregulation
Based on the concepts of wholesale and retail markets, the deregulation of electricity markets can be divided into three stages, single buyer, wholesale competition, and retail competition, see table 2.1.1. Single buyer and wholesale competition exist in wholesale market deregulation; retail competition exists in retail market deregulation, and is the final stage of electricity market deregulation. Retail market deregulation allows free choices from end-users on the retailers of electricity services. In contrast, wholesale market deregulation requires end-users connect to the local distribution wires' owners. A number of regions in the U.S, including the Northeast, Mid-Atlantic, much of the Midwest, ERCOT and California allow for retail competition [10].
TABLE 2.2.1 Stages of electricity market deregulation
----
-
-
...
...
...
2.1.3 Deregulated Electricity Market Architecture
An electricity market's architecture is a map of its component "submarkets" given the "market type." Both the submarkets and the market type can be classified according to multiple categories.
Market Types
The most fundamental category of the market type is the transaction content. Based on this category, the market is either an energy market or a transmission-rights market. The transmission-rights market is better than an energy market in the sense that the system operator's role is minimized, and is refrained from trading or pricing energy. On the other hand, people think the transmission-rights market is impractical. A more practical way is that at least in real time, the system operator needs to buy and sell energy directly and needs to set different prices for energy provided at different locations.
Another basic category of the market type is based on the centralization degree of the market, see figure 2.1.4. There are two basic ways to arrange trades between buyers and sellers. One way is that buyers and sellers trade directly, that is, making a bilateral trade. The other way is that suppliers can sell their product to an intermediary who sells it
27
Market model Monopoly Single buyer Wholesale Retail
competition competition
Definition Monopolythrough Generation + retailers + end-user
all sectors competition only competition competition
Generation No Yes Yes Yes
competition?
Retailers No No Yes Yes
competition?
End-user No No No Yes
to end-use customers. In order of increasing centralization, bilateral markets can be search, bulletin-board, or brokered markets, while mediated markets can be dealer markets, exchanges, or pools [9, 10].
Arrangement Type of Market
Bilateral: Mediated:
Search Bulletin Board Brokered
Dealer Exchange Pool
Oeala I NUMEROUS=
Less organized More centralized
Fig. 2.1.4 Market types and centralization degree of the market.
In a bilateral market buyers and sellers trade directly. Such markets are flexible as the trading parties can specify any contract terms they desire, but negotiating and writing contracts is expensive. Assessing the credit worthiness of one's counter party is also expensive and risky.
In a dealer market dealers trade for their own account and usually maintain an inventory. Unlike the brokers in bilateral markets, the dealers buy the contract and hold it before reselling. There is no brokerage fee, but at any point in time the dealer buys for a
price that is lower than the price he sells for. This difference is called the spread.
An exchange provides security for traders by acting as the counter party to all
trades, eliminating the risk of creditworthiness. Exchanges that utilize auctions are called
auction markets.
Pools are defined by the existence of side payments. In a pool, generators bid
their marginal cost and certain other costs and limitation; whereas an exchange uses simple bids which express only an energy quantity and price. Pools accept some apparently losing bids. Accepted bids that would otherwise lose money are compensated with a "make-whole" side payment. Exchanges accept only bids that, according to their bid-in values, at least break even. Exchanges do not make side payments. Consequently, generators have to manipulate or "game" their bids in an exchange in some way to avoid a loss.
When designing an electricity market, it is hard to say if the bilateral market is absolutely better than the mediated market, or the other way around. The mediated market, due to its high centralization, can reduce trading costs, increase competition, and produce a publically observable price. On the other hand, the bilateral market, depending on design and circumstances, can inhibit collusion and generally provides more flexibility than the mediated market. Because of these characteristics of the bilateral and mediated market, the two market types are usually applied in different submarkets. The mediated market, for example the pool, is inherently a market for physical transactions, which are on a short timeframe such as real-time operations. This is because the pool is inflexible, and thus it can operate much faster than the bilateral market. In physical transactions, speed is crucial. Catastrophes can happen in seconds and system operators often need to exercise minute-by-minute control. Because of its speed, the pool can operate much nearer to real-time than the bilateral market. In contrast, the bilateral market (sometimes the less centralized exchange) is essentially forward markets for financial transactions. This is because with less centralization there is more room to earn commissions as brokers and to appropriate the spread as dealers. For markets of weeks and months in advance, physical deficiencies are inconsequential, and ordinarily they are settled at the subsequent spot price. This makes the bilateral market an obvious choice for forward markets. Both real-time markets and forward markets are defined by the concept of submarkets.
Submarkets
Submarkets can be classified by their spatial or temporal differences. In spatial classification, submarkets are a collection of multiproduct markets based on the fact that they are geographically distributed. When the transmission system is congested (or if losses are charged for, as they should be) electricity at location A is technically a different product from electricity at location B [12]. Consequently, an electricity market is a multiproduct, and every product defines a submarket.
On the other hand, in temporal classification, an electricity market includes forward markets, spot markets and ancillary market, see figure 2.1.5. Trading for the power delivered in any particular minute begins years in advance and continues until
Real Time (RT), the actual time at which the power flows out of a generator and into a load. All these markets, including the trade of electricity futures, except the RT market are classified as forward markets. Electricity futures typically cover a month of power delivered during on-peak hours and are sold up to a year or two in advance. Most informal forward trading stops about one day prior to real time. At that point, the system operator holds its Day-Ahead (DA) market. This is often followed by an hour-ahead market and a RT market. The RT market is the only submarket spot market. (Though some books use the term spot market to include DA and hour-ahead markets, this thesis only refers to RT markets by as spot markets.) Spot markets are physical markets, while forward markets are financial markets. This is because in spot markets all trades correspond to actual power flows; in forward markets, the delivery of power is optional and the seller's only real obligation is financial. In other words, if power purchased in forward market is not delivered, the supplier must purchase replacement power or pay liquidated damages.
Ancillary markets are submarkets that parallel with forward markets and spot
markets,. Ancillary markets provide ancillary services in support of the basic service of generating real power and injecting it into the grid. Much more is needed to ensure that the supply of delivered power is reliable and of high quality. Some of these services in ancillary markets are indirect, but they are all concerned with dispatch, trade, and delivery of power. Organized by time scale, there are five types of ancillary submarkets. The services characterizing these submarkets are real-time balancing frequency and voltage, transmission security, economic dispatch, trading enforcement and the black-start capability. Among these services, economic dispatch is the only service in the time scale of this thesis' scope. Economic dispatch refers to using the right generators in the right amounts at the right times in order to minimized the total cost of production. We will give more details of economic dispatch in section 2.2.
The entire market
The definition of an entire market typically includes the market participant scope, submarkets as components, and the market type. The entire market of this thesis is wholesale DA and RT energy-trading electricity pools. The entire market is set so as it is
a model or at least a catalyst in the United States. National policy for many years has been, and continues to be, to foster competition in wholesale power markets. As the third major federal law enacted in the last 30 years to embrace wholesale competition, the Energy Policy Act of 2005 strengthened the legal framework for continuing wholesale competition as federal policy for this country. The DA and RT markets represent forward and spot markets. Pools are inherently RT market type and are often used in DA markets.
Under this thesis's entire market definition, the FERC standard market design proposal describes the sequence of the energy markets' operations with the following structure [8]:
* First, the ISO undertakes a series of pre-day-ahead procedures and out-of-market actions to schedule generators with longer than one-day start-up or shut-down requirements.
* Second, the ISO operates a DA market that includes an auction with "security constrained unit commitment," which considers all the known transmission and generation unit constraints, within the limitation of the auction optimization. * Third, the ISO takes several actions, for example, reliability unit commitment, to
ensure reliability prior to real-time.
* Finally, in RT market, the ISO operate the power system through a power dispatch through a security constrained economic dispatch to determine auction market prices and supported also by physical dispatch instructions.
2.2 Demand Response
Definition
During the past several decades, pressures to increase competition, reduce market power, improve reliability, and enable the use of cleaner renewable energy technologies have led to an increasing push for demand-side participation, in particular demand response programs, in competitive power markets.
Demand response refers to actions by customers that change their consumption (demand) of electric power in response to price signals, incentives, or directions from grid operators. In this report, Commission staff adopted the definition of "demand response" that was used by the U.S. Department of Energy (DOE) in its February 2006 report to Congress [3]:
Changes in electric usage by end-use customers from their normal consumption patterns in response to changes in the price of electricity over time, or to incentive payments designed to induce lower electricity use at times of high wholesale market prices or when system reliability is jeopardized.
This section will answer three questions on demand response: what role does demand response play in current power system of the United States; what are the working principles of demand response; and, what problems does demand response bring to the United States power system.
2.2.1 Demand Response's Role in the U.S. Power Systems
Motivation
A truly functioning electricity market incorporates dynamic supply and demand forces. A recently frequent criticism of current wholesale market designs has been that the demand-side of the market is not active; thereby creating the potential for supplier market power. Enabling demand-side responses as well as supply-side responses increases economic efficiency in electricity markets and improves system reliability. For this reason, demand response has been developed.
History
The use of demand response (DR) programs began with demand-side management (DSM) in the 1980s and early 1990s. The emergence and increase of DSM adoption was driven by a combination of a directive in the Public Utility Regulatory Policies Act of 1978 (PURPA) [3], and by state and federal regulatory and policy focus on DSM and integrated resource planning. At that time, the primary objective of most DSM programs was to provide cost-effective energy and capacity resources to help defer the need for new sources of power, including generating facilities, power purchases, and transmission and distribution capacity additions. DSM only refers to energy and load-shape modifying activities undertaken in response to utility-administered programs. Whereas DR includes all intentional modifications to consumption patterns of electricity of end-use customers that are intended to alter the timing, level of instantaneous demand, or the total electricity consumption [15]. With the recognition of existing wholesale markets' imperfection, DR becomes more important. Regulatory support and technical advances in controls, communications, and metering led to a marked increase in development of DR programs, such as load management, particularly direct load control programs and interruptible/curtailable service tariffs.
Benefits
Multiple benefits can be achieved by implementing DR programs in electricity markets:
* Reducing market power. A reduction in demand in response to a price spike is crucial to constrain the ability of suppliers to raise prices to inefficient levels (i.e., price levels inconsistent with consumer willingness or ability to pay), due to the exercise of market power or other anticompetitive behaviors.
* Maintaining resource adequacy. In markets where an "energy-only" approach is adopted to maintain resource adequacy, demand response may play an important role in maintaining a balance between supply and demand. This is particularly important in light of the cyclical nature of power plant construction activity. During the periods when a market is
left with inadequate reserve margins, demand response can provide an important backstop.
* Postponing long-term investment. It is sometimes argued that demand-side resources can be used to defer or displace transmission investments in either a regulated or a competitive market. Some encouraging programs have been launched in California, New York, and the Pacific Northwest region of the United States.
* Fostering reliability. Carefully crafted DR programs can be used to foster reliability in RT system operations. High wholesale prices or participation in programs through which loads curtail in response to instructions from an ISO in return for some financial compensation can assist the ISO in balancing supply and demand in RT and in managing reliability during emergency conditions.
* Managing risk. When viewed as a call option, DR may provide a variety of risk management benefits to an ISO or load-serving entity in a competitive market.
In addition, short-term financial benefits in DA and RT markets are observed by implementing DR programs. Not all consumers need to respond simultaneously for markets to benefit by lowered overall prices. One study suggested that shifting five to eight percent of consumption to off-peak hours and cutting another four to seven percent of peak demand could save utilities, businesses, and customers as much as $15 billion a year [16]. Another posited, "20 percent of customers account for 80 percent of price response." Others find that "only a fraction of all customers, perhaps as few as five percent, are needed to discipline electricity market prices." [17] In its comments to the Commission, the Demand Response and Advanced Metering Coalition (DRAM) said it "believes that demand response typically is capable of providing demand reductions of 3-5 percent of annual peak load for periods up to 100 hours or so per year." In California's statewide pricing pilot, 80 percent of load reduction came from 30 percent of customers [18].
Current status
Currently in the United States, there are regional differences in the use of demand response and how its use has changed over the past decade. Data collected from regional reliability councils and electric utilities by North American Electric Reliability Council (NERC) in its Energy Supply & Demand database provides a snapshot of regional potential and historical trends. Fig. 2.2.1 illustrates that Florida Reliability Coordinating Council (FRCC), Electric Reliability Council of Texas, Inc. (ERCOT), and the MidAmerican Power Pool (MAPP) had the largest percentage of demand response capability in 1998. It also shows that the amount of load management included in regional forecasts declined between 1998 and 2003. Regions with larger relative declines include ERCOT, Northeast Power Coordinating Council (NPCC), Mid-Atlantic Area Council (MAAC), and Western Systems Coordinating Council (WSCC). In 2003, due to the decline in capability in ERCOT and an increase in capability in Mid-America Interconnected Network (MAIN), the regions with the largest percentage capability are FRCC, MAIN, and MAPP [3].
Interuptlble and Direct Load Control by NERC Region
S10%
8
,s
01998
-S6 0 2003 4%-w I. z . o w
Fig. 2.2.1 Source: Data from NERC 1998 and 2003 summer assessments. NPCC* data is for 1998 and 2002 [15]
According to the literature on this issue, a contributing factor behind the decline shown in Figure 2.2.1 has been the waning of electric utility interest and investment in demand response over the past decade, due to changes in industry structure and the result of state electric restructuring plans. State and utility programs were dismantled in many restructured states that had previously supported extensive programs. In several states, such as Texas, load management was deemed a competitive service and regulated distribution companies were directed to divest their holdings [10]. In other states, utility divestiture of generation or transfer of the provider-of-last-resort (POLR) obligation removed a significant driver for utility investment by splitting up the benefits of demand response across multiple parties. Ample capacity reserves in many parts of the United States also contributed to declining utility interest and investment. Many states, such as Nevada, still support demand response and load management and operate integrated resource-planning programs that frequently include demand response and energy
efficiency.
2.2.2 Demand Response's Working Principles
Classification
There are two primary categories of demand response: incentive-based demand response and time-based rates. Each category includes several major options:
* Incentive-based demand response o Direct load control
o Interruptible/curtailable rates
o Demand bidding/buyback programs o Emergency demand response programs o Capacity market programs
o Ancillary-services market programs * Time-based rates
o Time-of-use
o Critical-peak pricing o Real-time pricing
Incentive-based demand response programs offer payments for customers to reduce their electricity usage during periods of system need or stress. By adjusting or curtailing a production process, shifting load to off-peak periods, or running on-site distributed generation, customers can reduce the level of demand that they place on distribution networks and the electric grid. Customers who participate in incentive-based demand response programs either receive discounted retail rates or separate incentive payments. At a wholesale level, the impetus comes from independent system operators (ISOs) or regional transmission organizations (RTOs) and power marketers. These programs can be triggered either for reliability or economic reasons. In the wholesale demand response programs, customer load reductions are aggregated by retailers, and then provided to the wholesale provider, such as an ISO, in exchange for an incentive.
The second type of demand response is comprised of time-based rates. A range of time-based rates are currently offered directly to retail customers; not all are time-varying, but they may promote customer demand response based on price signals. These are different from flat rates, which are unvarying and offer no price signals. Customer demand response, incentivized by time-varying price signals, is one way for electricity customers to move away from flat or averaged pricing and to promote more efficient markets.
Working principles
Both the incentive-based DR programs and time-based rates take effect through increasing elasticity of demand side by exposing end-users to incentives or time-varying pricing. Fig. 2.2.2 illustrates how this principle works and achieves the benefit of wholesale price reduction. Because generation cost increases exponentially near maximum generation capacity, a small reduction in demand will result in a big reduction in generation cost and in turn a reduction in price of electricity. In this example, the original demand curve is represented by a vertical line because it is assumed that the system is without DR programs. DR programs induce a negative slope on the original demand curve leading to small deduction in demand and a huge reduction in price.
PO
With DR
Without
DR
Demand
(MWh)
Fig. 2.2.2 a simplified illustration on how DR works by increasing demand elasticity
The two categories of demand response are highly interconnected and the various programs under each category can be designed to achieve complementary goals. For example, by adjusting customer load patterns or increasing price responsiveness, large-scale implementation of time-based rates can reduce the severity or frequency of price spikes and reserve shortages, thereby reducing the potential need for incentive-based programs. Care needs to be taken in their implementation to ensure that these programs do not work at cross-purposes.
The effect of either time-based rates or incentive-based demand response or incentive-based demand response on electricity sub-markets depends on the timeframe of the response. For example, real-time pricing or critical-peak pricing, which directly reflect wholesale prices, affect supply scheduling in day-ahead markets and during real-time dispatch. Time-of-use rates do not induce as rapid or as large of response. Incentive-based demand resources such as direct load control, can be used in ancillary markets, or as capacity resources in system planning.
The crux of demand response that this definition addresses is that it is an active response to prices or incentive payments. The changes in electricity use are designed to be short-term in nature, centered on critical hours during a day or year when demand is high or when reserve margins are low. Customer responses to high market prices can reduce consumption; this can shave wholesale market prices on a regular basis and
thereby dampen the severity of price spikes in wholesale markets on extreme days. Customer response to incentives is an important tool available to operators of the electric grid to address reserve shortages, or retailers incorporate in their portfolios to match customer demand with available supply, and where available to individual customers to better manage their costs of doing business.
If changes in electricity prices last for a long time or are expected to do so, a longer-term price-based reduction in consumption through change in customer behavior may occur. Energy efficiency and conservation are often achieved while consumers are involved in demand response programs through actions taken by consumers to conserve their consumption of electricity during high price periods as they become more aware of their energy-usage patterns.
2.2.3 Demand Response's Problems and Challenges in the U.S.
Power Systems
Although the emergence of demand response brings about more flexibility and options for both the supply and demand side, they also can introduce some complications into the operation of power systems. In the absence of a priority pricing scheme, where the prices at which load will curtail are announced to the market, the ISO may have difficulty understanding the slope or elasticity of the market's aggregate demand curve in a RT energy market. ISOs sometimes complain that demand response affects the accuracy of their near-term forecasts of demand, thus complicating the task of balancing demand and supply in real-time. If more generation is scheduled than needed, additional costs may be imposed upon the market [19, 20].
Thus, with demand response, in short-term power system operations, ISOs may find it harder to predict the future demand and commit or dispatch the correct amount of generation when there is an active demand response; while in long-term planning, planners may have difficulties deciding the needed generation and transmission capacity for load forecasts that include both short and long-term price elasticity of demand [16, 17].
On the other hand, successful demand response requires a correct combination of customer characteristics, economic incentives, metering and communications technology,
policy support and most importantly market design. Existing market designs raise problems before and after the implementation of demand response programs: design and implementation of demand response programs can be more complicated due to lack of information in forward market; further difficulties arise in price settlement when the auction systems in DA and RT markets and demand pricing are designed independently
[21].
In order for demand response programs to result in increased market efficiency, and not simply create additional uncertainty, it is critical that information regarding load behavior is provided to the market administrator and incorporated into the appropriate market price [22]. For this reason, demand-side bidding in day-ahead or real-time markets may have greater potential to increase efficiency than relying solely on a more passive demand response, where loads simply respond to real-time or forecasted prices.
2.3 Existing bidding mechanisms
All auctions solve some mathematical problems. Bids are submitted, some function of the bids is maximized or minimized, and the solution determines which bids are accepted. For example, say bids are submitted for the purchase of 100 candy bars. Each bid states a number of candy bars and a price. The auction problem may be to maximize the sum of the amount paid by each winning bid. The solution defines a set of accepted bids. There is one more step: settlement. The winners must pay and must receive the candy bars being auctioned.
The designs of auctions are called bidding mechanism. In auction theory, each bidding mechanism is specified by three sets of conditions: bidding rules, bidding acceptance rules, and settlement rules [10]. Bidding rules defines bidding participants, bids' content, and specific operation criteria. Restrictions on bidding have important consequences for the acceptance problem, and for market efficiency. Bid acceptance and
price determination are usually lumped together because they are computed together,
although conceptually they are distinct. On the other hand, settlement is not determined entirely by the solution to the acceptance problem but also uses separate price-determination rules, such as including penalties for noncompliance with commitments made in the auction. In our "candy bar" example, the settlement rules could specify that each accepted bid would pay as bid and receive the number of candy bars for, or it might specify that accepted bids would pay a price per candy bar equal to the lowest price per candy bar of any accepted bid.
Day-ahead (DA) and Real-Time (RT) markets run by Independent System Operators (ISO) that take the form of pools are operated as auctions. This section will focus on the bidding mechanisms of DA and RT auctions. Section 2.3.1 describes a typical bidding mechanism in DA markets. Section 2.3.2 presents alternative bidding mechanisms in DA markets. Bidding mechanisms in RT markets are given in section 2.3.3.
2.3.1 Auctions in Day-Ahead Pool Electricity Markets
Procedure
The description of DA markets often focuses on presenting an auction problem. The auction problem takes place in three stages,
1. Bids are submitted.
2. Some bids are accepted and prices are determined. 3. Accepted bids are settled at the determined prices.
A general bidding rule
Corresponding to these three stages, in auction theory, each bidding mechanism is specified by three sets of conditions: bidding rules, bidding acceptance rules, and settlement rules. In a DA pool, the bidding rules typically define the auction as sealed-bid with multipart bids. Suppliers submit bids prior to a trading deadline (usually the prior morning for the day-ahead and about 1 hour before the real-time market). These bids must usually takes the form of equation (1) [10]
BG(P) = < Pmax(t), Pmin(t), C(P), Cst, Cfix, Prpu, Prpd, ton, toff, z > , (1)
where
BG(P) bid submitted by supplier S with power profile P; Pmax(t) maximum MW available at hour t;
Pmin (t) minimum MW at hour t if the generator selected online; C(P) cost function ($/MWh) over the range of available output;
Cst start up cost of the generation unit ($); Cfix fix cost of the generation unit ($);
Prpu ramp-up limit of the generation unit (MW/h);
Prpd ramp-down limit of the generation unit (MW/h);
ton minimum up time of the generation unit (h); toff minimum down time of the generation unit (h); z other bids or constrains of the generation unit, such as
A general auction formulation
After receiving the bids from suppliers, ISO conducts "security constrained unit commitment," in which "security" enforces the balance between supply and demand in the system (and probably on every node of the system). The unit commitment specifies exactly which generation units should be turned on in each hour, their level of output, and the length of time they should run over the day, based on start-up and energy bid prices and the other financial and physical parameters and transmission network constraints. Thus in a DA pool, bidding rules require a multipart bid from one generator per day to conduct unit commitment. On the contrary, in exchange markets, bidding rules require 24 hourly bids of one generator containing only energy quantity and prices. Moreover, in exchanges instead of unit commitment economic dispatch is performed, which can be formulated as a linear programming problem.
Mathematically, the security constrained unit commitment is done by solving a mixed-integer optimization problem with the objective of minimizing total generation cost as defined by the bids. A general form is shown in (2) [10],
NG T
min Ci (Pi (t), ui (t)), Vj e g, i eD j t
s.t. L (P(t),uJ(t),Pi(t)) = 0, Vt
G (Pi(t), ui(t)) < O, Vj, t Zk (Pi(t), uJ(t), Pi(t)) < O, Vt
where g set of generation units;
D set of load units;
NG number of generation units in set g, =
191;
T transaction time horizon of DA markets; PJ (t) active power of generation unit j at hour t; P'(t) active power of end user i at hour t;



![Figure 5 shows the difference between short-run and long-run responsiveness [31-33].](https://thumb-eu.123doks.com/thumbv2/123doknet/14674618.557658/90.918.202.764.758.980/figure-shows-difference-short-run-long-run-responsiveness.webp)