HAL Id: hal-00964684
https://hal.archives-ouvertes.fr/hal-00964684
Submitted on 18 Feb 2019
HAL is a multi-disciplinary open access archive for the deposit and dissemination of sci-entific research documents, whether they are
pub-L’archive ouverte pluridisciplinaire HAL, est destinée au dépôt et à la diffusion de documents scientifiques de niveau recherche, publiés ou non,
Shrinkage / swelling behaviour of knitted fabrics during
relative humidity cycles determined by x-ray imaging
Naoufel Bhouri, Eric Badel, Sassi Ben Nasrallah, Patrick Perre
To cite this version:
Naoufel Bhouri, Eric Badel, Sassi Ben Nasrallah, Patrick Perre. Shrinkage / swelling behaviour of knitted fabrics during relative humidity cycles determined by x-ray imaging. Journal of Porous Media, Begell House, 2009, 12 (5), pp.403-415. �10.1615/JPorMedia.v12.i5�. �hal-00964684�
Shrinkage/swelling behaviour of knitted fabrics during relative
humidity cycles determined by x-ray imaging
Bhouri N.1,2*, Badel E.1, Ben Nasrallah S.2, Perré P.1
1
LERMAB-UMR INRA 1093, ENGREF 14, rue Girardet, 54042 Nancy Cedex, France badel@nancy.inra.fr, perre@engref.fr
2
LESTE, ENIM Avenue IBN ELJAZZAR, 5019 Monastir, Tunisie bhourinaoufel@yahoo.fr*, Sassi.Bennasrallah@crten.rnrt.tn
Abstract
A digital x-ray imaging system was equipped to measure the shrinkage/swelling behaviour of a knitting cotton Jersey ready-to-wear clothing under the influence of the variations of climatic conditions during an adsorption/desorption cycle. Images of the samples are recorded at different equilibrium states of the cycle. Then, the 2D strain field is computed using an image correlation process.
These original experimental results establish clear anisotropic shrinkage/swelling behaviour. They are explained by the local structure due to the manufacturing process. In addition, the results show hysteresis between the adsorption and the desorption steps, which denotes the effect of the material’s history. Finally, ESEM observations show the yarn's structure that could explain shear effect.
1 Introduction
The natural textile materials are highly hygroscopic. They change their moisture content and their dimensions (shrinkage/swelling) under the influence of climatic conditions (temperature and relative humidity) (Benamar 1998). Cotton is made of cellulose, i.e. each glucose has three hydroxyl groups. This generates a very hydrophilic behaviour that causes morphological changes of the material.
Many works studied the coupled heat and mass transfer phenomena in woven fabrics using laws of the water transport (Ogniewicz and Tein 1990; Motakef and El-Masri 1990) and consisting to the steam's adsorption / desorption phenomena (Li and Zhu 2004; Li et al. 2001). Few of them were interested in the modelling of the sorption's kinetics to determine the steam diffusion in textile materials (Li and Holocombe 1992; Li and Luo 1999, 2000). Others were interested in the modelling of the adsorption and the desorption isotherms to study the evolution of the sorption hysteresis according to the temperature, the product structure or the material’s history (Nordon et al. 1960; Jannot 2003; Tvardovski et al. 2001; Wang and Yasuda 1991; Barnes and Holocombe 1996).
The mechanical behaviour of textile materials was approached by Magno (Magno et al. 2002) who developed a mathematical model that describes the behaviour of textile materials under the influence of large stress. The modelling approach of Ben Boubaker (Ben Boubaker et al. 2002, 2003) focused on the estimation of the internal efforts between warp yarns and weft yarns of the same material. Others studies were interested in drapes such as Nadjombe (Nadjombe 2002) who elaborated a specific mathematical model to describe the behaviour of a textile material around a
Nevertheless, literature remains poor concerning the textile behaviour according to hygrometric variations. Technological properties, such as shrinkage or swelling, are badly known. This field of interest is widely treated in case of others hygroscopic materials such as wood (Badel 1999; Botosso 1997; Mariaux and Masserann 1985; Koponen et al. 1991; Watanabee et al. 1998; Yamamoto 1999), concrete (Dwiargo 1994), or agro alimentary materials (Baucour 2000; Bizot 1983; May and Perré 2002; Bizot et al. 1985).
In this work, the shrinkage swelling behaviour of a knitting cotton Jersey ready-to-wear clothing was measured. For that reason, an x-ray imaging device was coupled with a climatic chamber to have regular cycles of adsorption / desorption. Electronic images of the structure were recorded in order to explain the samples behaviours.
2 Experimental set-up
2.1 Materials
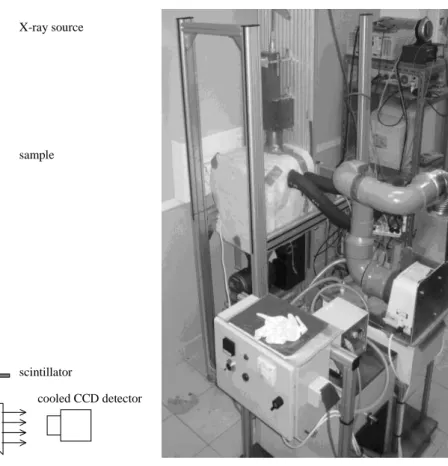
The digital x-ray imaging system was initially designed to study wood shrinkage (Badel and Perré 2001). This experimental device (Figure 1) includes a micro-focus x-rays source, a sample chamber and a 2D detector that are aligned on the same axis. The sample partly attenuates the incident polychromatic x-ray beam according to its thickness, density and chemical constitution. The transmitted beam is converted into visible light by a scintillator situated in front of a cooled CCD detector, which is connected to a computer to record the images. Compared to visible light, the use of x-ray light led to several advantages:
- the x-ray path is always a straight line. It brings no reflection problem as visible light does,
- appropriate processes generate very homogeneous light on the sample,
- x-rays don’t cause shadow effects through materials. It removes the most usual difficulty when using visible light.
The complete details of this device are available in (Badel and Perré 2001). Let us sum up the main characteristics of its components:
The micro focus x-ray source (Hamamatsu L6731) generates a polychromatic beam from a very small emission point (8 µm). It allows x-ray geometrical magnification to be performed. The voltage can be adjusted up to 80 kV and the current up to 100 µA.
The scintillator, which is placed after the sample, converts x-ray photons into visible light. It consists of a thin layer of CsI(Tl) coupled to a Fiber Optic Plate (FOP). The field of view is 20 x 30mm2.
The camera (RTEA/CCD-1317-K) is based on a 1317 x 1035 pixels detector. The CCD is cooled at - 30°C to reduce the electronic noise. It allows acquire time up to 30 minutes.
The sample holder is made of a circular metallic plate with 14 holes, each of them is covered by a 100µm thick Mylar sheet, almost transparent to the x-ray beam. The samples are simply placed on the tight film to ensure their free deformation. Two of these holes are kept free for incident beam calibration. Finally, 12 samples can be placed simultaneously in the climatic chamber. Preliminary experiments showed that the fabric rolled-up during desorption steps. Then the shrinkage/swelling measurement has been spoiled. A second concentric PVC plate was positioned one millimetre above the metallic plate (Figure 2). This configuration allows free displacement in the two plane directions of the fabrics but restrict them in the third direction (perpendicular to the plane).
An external air generator was plugged in the chamber that is isolated by glass wool. Then dry temperature and relative humidity of the air are controlled with reliable accuracy (Badel et al. 2006).
Raw images contain many defaults. Most of them can be removed with the help of appropriate treatments.
• Settings of the x-ray source
Assuming that signal/noise (S/N) increases with the photons number, intensity is set at the maximum level (100µA). For the same reason, the voltage is optimised. A previous work (Badel and Perré 2001) showed that very good results are obtained using 70 kV even with low-density materials. This range of energy matches with the spectral performances of the CsI(Tl) scintillator.
• Settings of the camera
The quality of an image is mainly characterised by the spatial resolution and the S/N ratio:
The spatial resolution depends on the x-ray spot size, the scintillator, the camera detection and the x-ray magnification. According to the size of our samples, a compromise between these parameters is defined and the spatial resolution reaches about 30 µm.
The S/N ratio increases as the square root of the number of detected photon. Assuming that the x-ray source and the scintillator’s efficiency determine the incoming flux, two ways are possible to improve the S/N ratio: to increase the detection time or to modify the image parameters. Indeed, the pixels of the CCD can be grouped in order to generate "super-pixels". Super-pixels made of 3x3 pixels reduce the spatial resolution, but allow the photons number to be multiplied by 9 and hence the S/N to be tripled.
The acquisition time is adjusted in order to fill the 12 bits potential of the CCD detector (90 seconds during these experiments). For each sample and each equilibrium state, 26 consecutive
images are recorded and digitally accumulated in order to ensure a very good S/N ratio. Finally, the non-homogeneous x-ray light is corrected according to the well known “flatfield” process:
( )
( )
( )
( )
( )
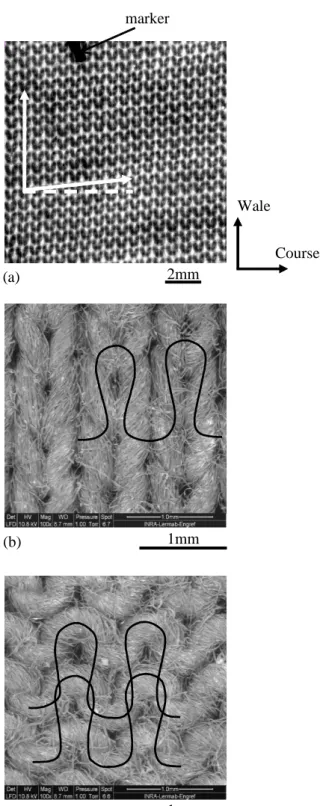
y x Background y x Flatfield y x Background y x age y x age raw , , , , Im , Im − − = (1) The background image is recorded without light and the flatfield image is recorded with light but without sample. This process ensures that the final grey level represents the physical attenuation property of the material for each pixel. Figure 4a depicts an example of the data collection. We observe the regular structure of the Jersey knitted fabric. A small aluminium marker (arrow) is placed in a corner. It allows the sample to be placed in the same position at the different humidity steps.2.2 Method: Experimental protocol for shrinkage/swelling experiments
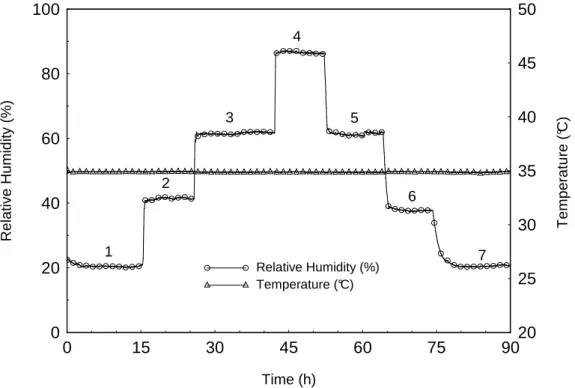
A constant temperature of 35°C, close to the temperature of human body, is used. Only the relative humidity of the air varies during the experiment. At first, the relative humidity increases through four steps from 20% to 87% (20% - 41% - 62% - 87%). Then, a desorption phase brings back the relative humidity to the initial state (Figure 4) following the same four steps.
• Kinetics consideration
Preliminary sorption experiments were performed to evaluate the minimum waiting time to ensure stable moisture content of the samples for every climatic condition. These specific experiments were performed using a micro-balance (Sartorius MC2, sensitivity 0,1µg, accuracy
2µg). That was installed in a climatic chamber where temperature and relative humidity are carefully controlled (May and Perré 2002). The mass measurement was recorded during a
complete sorption / desorption hygroscopic cycle. The relative humidity of the air was ranged from about 20% to 80%. The moisture content was defined by the following equation:
( )
( )
100 0 0 % × − = M M t M t X (2) - X%(t) is the moisture content of the sample,- M (t) is the mass of the sample,
- M0 is the dry mass of the sample (4 hours at 104°C).
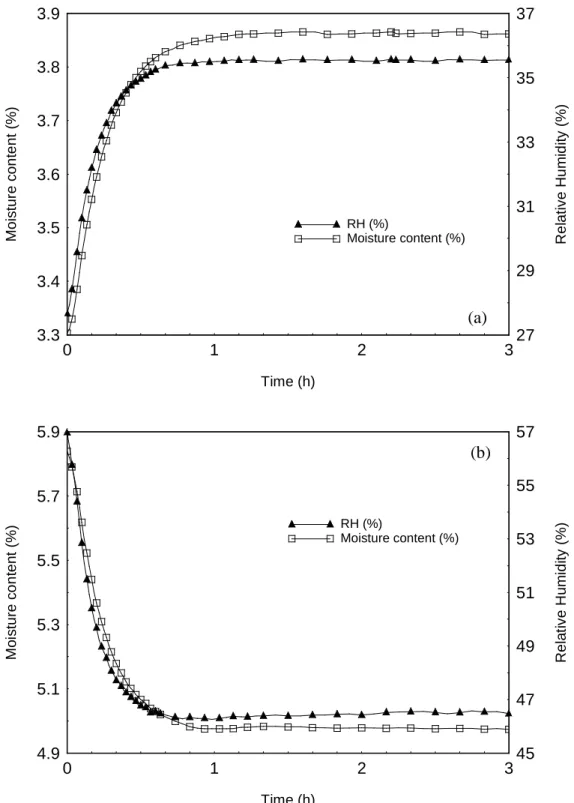
Figure 6 depicts two parts of the evolution of the moisture content versus the time during adsorption (6a) and desorption (6b) cycle. It shows that the kinetic of knitted fabrics is very rapid and it follows the kinetic of the climatic chamber.
• Sample preparation and experimental protocol for x-ray imaging
The initial sample dimensions are 30mm x 25mm (Table 1). They are placed on the sample holder in the x-ray imaging device. The relative humidity of the air is fixed at 20% and the dry temperature is fixed at 35°C. After a stabilisation step of 6 hours, a first x-ray image is recorded for each sample. It is the “reference” image that refers to the initial state. Then, the relative humidity is modified according to the adsorption/desorption cycle (Figure 5). An image is recorded for each step after a waiting time of 6 hours to ensure a complete stabilisation of the conditions.
• Data analysis: computation of the deformation
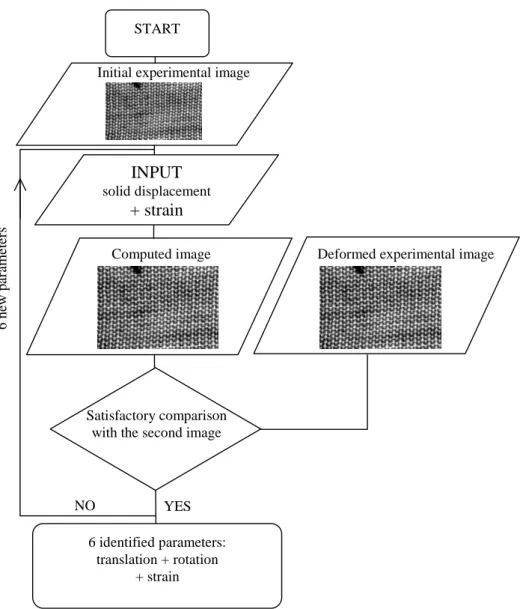
The deformation is measured by image analysis using a correlation process. For that purpose, the grey level distribution is exploited. The strain field is supposed to remain constant over the entire
image. Assuming that image 1 is the initial state and image 2 is the deformed one, an arbitrary 2-D strain field (often the vector zero) is applied to the initial image (image 1). The new position of each pixel is computed, which allows the grey levels of a new virtual image to be determined. This virtual image can be compared to the real deformed image (image 2) by the following objective function (Figure 7):
(
2)
2 N image computed i i i gl gl C N − =∑
(3) gliimage 2 is the grey level of the ith pixel on the image 2glicomputed is the grey level of the ith pixel on the virtual computed image
N: is the total pixel number of the images.
Function "C" is minimised using the simplex method (Teukolsky et al. 1992) and finally the six parameters (solid displacement + strain) for each relative humidity are determined.
The analytical expression of the strain ε in the plan is composed of three coordinates: ε11 is the elongation along the horizontal axis of the image. ε22 is the elongation along the vertical axis of the image. ε12 is the shear that depicts the deviation's angle between the horizontal and vertical directions. Because the main axes of the fabric are not directed exactly along the physical axes of the CCD detector, the deformation values are corrected by applying a solid rotation θ, which is measured by image analysis (Visilog 5©).
Finally, the new values of the deformation are calculated along the Course (C) and Wale (W) directions of the fabric according to the following equations.
(
)
(
)
( )
( )
(
)
(
)
− + = − − = + + = θ θ ε ε θ ε θ ε θ ε ε θ ε ε θ θ ε ε θ ε θ ε cos sin 2 cos sin 2 sin 2 2 cos cos sin 2 sin cos 12 22 2 11 2 22 11 12 12 22 2 11 2 ww wc cc (4)3 Results and discussions
Four identical pieces of fabric have been tested. For each one, the image, which was obtained at each relative humidity step, has been compared with initial step (relative humidity = 20%). The strain parameters (εcc, εww, εwc) represent the overall deformation of the samples.
Figures 8, 9 and 10 represent the evolution of the elongations (εcc and εww) and shear (εwc) as functions of the relative humidity of the air. All the samples show very similar behaviour. This proves the excellent reproducibility of the measurements.
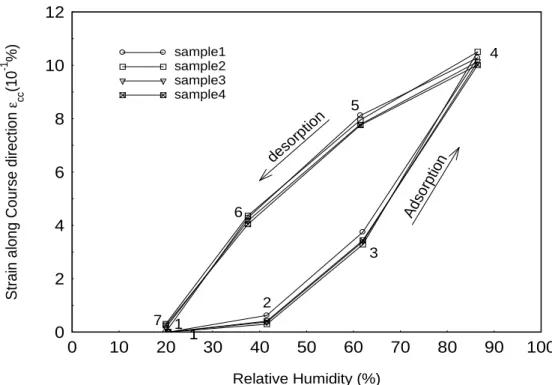
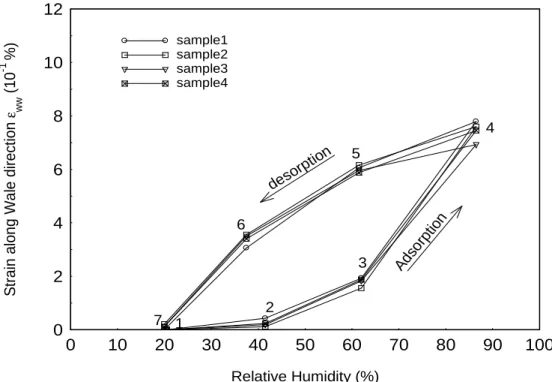
Along the course direction, which represents the width of the knitted (Figure 8) and along the wale, which represents the length of the knitted (Figure 9), we observe a hysteresis of the cotton jersey fabrics during the entire cycle of climatic conditions. Indeed, during the adsorption step, the swelling increases very slowly when the sample is at low humidity conditions. Then, the slope of the curve increases quickly. We observe the same behaviour during the desorption steps: the shrinkage occurs more slowly at the beginning then the slope of the deformation increases. Nevertheless, the complete adsorption / desorption cycle is a closed loop and the dimensions come back to their initial state. The slopes of this curve could be explained by geometrical considerations. The structure of fabric contains macroscopic pores between the yarns. During the adsorption step, the yarn fibres swell almost freely and mainly in their transversal direction. They fill the micro-pores without deformation of the overall structure. Then, when the contact is
established between the yarns, their transversal swelling generates an overall and large deformation. During the desorption step, the yarns start to shrink individually with a low overall deformation of the material. The micro-porosity is restored during this stage. Finally, we observe that the fabric comes back to its initial state. This last step is resulting to memory effect of the initial yarns curvature.
The deformation magnitude is clearly lower in the direction of the wale, what reveals the anisotropic character of the cotton knitted fabric. Indeed, the manufacturing process generates a continuous and sinuous yarn along the width of the material (Figure 4b and Figure 4c) that build up a very flexible structure mainly in this direction. This anisotropic behaviour is well known for the mechanical properties of the Jersey that is more rigid in the course direction (Rios et al. 2007; Boisse et al. 2001). Figure 11 depicts the evolution of the strain along the course versus the strain along the wale direction. It shows the evolution of the anisotropic behaviour during the adsorption / desorption cycle. This graph exhibits new information: the hysteresis affects the anisotropy. During the first adsorption step (points 1 to 3), the slope of the curve is very high (the anisotropic ratio is around 2). Then the behaviour tends to become isotropic.
The shape and the manufacturing parameters of the stitches can explain the first part of the curve. As said before, the yarns can swell in their transversal directions almost freely. They do it according to the geometrical shape of the stitches (εcc>εww) until the micro-pores are filled. Here, the ratio between the stitch number along the wale and along the course directions (Table 1) has a great importance on the anisotropic behaviour of the material. As the main part of the yarn is in the wale direction, the overall swelling occurs in the course direction. Finally, at the end of the desorption step, the loop is closed in accordance with the εcc and εww curves.
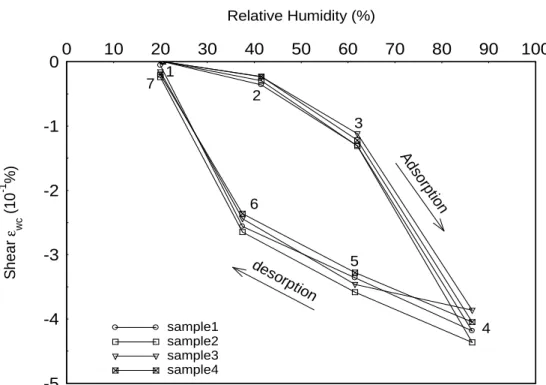
Figure 10 reveals that a shear deformation (εwc) occurs during adsorption (Figure 4a). Then, this deformation decreases during desorption, and finally, the structure comes back to its initial state. This shear effect cannot be explained by the macroscopic structure of the stitches, which is regular and symmetrical. However, at the yarn level, the ESEM views show the highly twisted fibres (Figure 12). On the front face, the angle of the twist (straight lines) is different between the two wings of a stitch. Indeed, the samples are made by a circular knitting machine (Table 1). This machine produces continually deviated stitches with helical form. It results a non-symmetrical yarn and the twist between the wings shows different angles. At this level, the structure is not symmetrical anymore, it brings a macroscopic shear deformation that is observed on Figure 4a. Indeed, the twist factor between the two wings of the same stitch is different, therefore, when the fibres swell, the yarn untwists, causes non-homogeneous length in stitches that generate the shear strain of structure.
4 Conclusion
We coupled an x-ray imaging device and a climatic chamber to evaluate the deformation (swelling and shrinkage) of ready-to-wear knitted cotton Jersey during an adsorption / desorption cycle. Thanks to the x-ray device, the 2D strain was evaluated without contact by comparison of images. The first results reveal the excellent reproducibility of the experimental protocol and proved that the method is efficient to measure such deformations.
For the two material directions, we observe a hysteresis that reveals the relationship between the behaviour and the history of the sample. A great anisotropic behaviour is also observable. The deformation is always lower along the wale direction than along the course direction. This anisotropic behaviour, already well known for the mechanical properties, is explained by the
macroscopic structure of the stitches. The parameters used in the manufacturing process have a major role in this behaviour. Surprisingly, a shear deformation is also measured. This is explained at the yarn level by the non-symmetrical structure of the wings. Again, the manufacturing process is involved in the property.
Complementary investigations are in progress to study the sorption properties and to understand the relationship between the fabric history, the structure and the behavior of the material when relative humidity varies.
References
Badel E., Détermination des propriétés élastiques et de retrait d’un cerne annuel de chêne dans le plan transverse: Description de la morphologie, Mesures des propriétés microscopiques et Calculs d’homogénéisation, Thesis of ENGREF- Nancy, 1999.
Badel E., Bakour R., Perré P., Investigation of the relationship between anatomical pattern, density and local swelling of oak wood, IAWA; vol.27(1), pp.55-71, 2006.
Badel E., Perré P., Using a digital X-ray imaging device to measure the swelling coefficients of a group of wood cells, NDT&E International; vol.34, pp.345-353, 2001.
Baucour P., Mesure des isothermes de sorption dans les hautes humidités: Modélisation du couplage transfert d’eau et croissance bactérienne en surface des viandes, Thesis of Clermont Ferrand University, 2000.
Barnes J.C., Holcombe B.V., Moisture sorption and transport in clothing during wear, Textile Research J.; vol.66 (12), pp.777-786, 1996.
Benamar S., Etude expérimentale et modélisation des transferts de masse et de chaleur à travers un tissu vestimentaire en régime dynamique: phénomène de sorption, de mouillage et de capillarité, Thesis of University of Nice-Sophia Antipolis, 1998.
Ben Boubaker B., Haussy B., Ganghoffer J.F., Un modèle discret du couplage entre les fils dans une structure tissée, C. R. Mecanique; vol.331, pp.295-302, 2003.
Ben Boubaker B., Haussy B., Ganghoffer J.F., Modèles discrets de structures tissées: Analyse de stabilité et de drapé, C. R. Mecanique; vol.330, pp.871-877, 2002.
Bizot H., Using the "GAB" model to construct sorption isotherms. In Jowitt R., Escher F., Hallström B., Mefert H., Spiess W., Vos G. editor. Physical properties of foods. London: Elsevier, pp.43-54, 1983.
Bizot H., Buleon A., Mouhoud-Riou N., Multon J.L., Water vapor sorption hysteresis in potato starch. In: Simatos, D. et Multon J.L., Properties of Water in Foods, 1985.
Boisse P., Gasser A., Hivet G., Analyses of fabric tensile behaviour: Determination of the biaxial tension - strain surfaces and their use in forming simulations, Composites Part A: Applied Science and Manufacturing; vol.32, pp.1395-1414, 2001.
Botosso P., Une méthode de mesure du retrait microscopique du bois : Application à la prédiction du retrait tangentiel d’éprouvettes de bois massif de Spin Pectiné (Abies Alba Mill.), Thesis of University of Nancy I, 1997.
Dwiargo B., Détermination expérimentale de l’influence de l’hystérésis sur les propriétés hydriques de matériaux poreux du génie civil, Thesis of INSA -Toulouse, 1994.
Jannot Y., Isothermes de sorption: Modèles et détermination, Communication of LEPT, ENSAM Bordeaux -Talence, University of Bordeaux, 2003.
Koponen S., Toratti T., Kanerva P., Modelling elastic and shrinkage properties of wood based on cell structure, Wood Science and Technology; vol.25(1), pp.25-32, 1991.
Li Y., Holocombe B.V., A two stages sorption model of coupled diffusion of moisture and heat in wool fabrics, Textile Research J.; vol.62(4), pp.211-217, 1992.
Li Y., Luo Z., An improved mathematical simulation of the coupled diffusion of moisture and heat in wool fabric, Textile Research J.; October, pp.760-768, 1999.
Li Y., Luo Z., Physical mechanisms of moisture diffusion into hygroscopic fabric during humidity transients, Journal of Textile Institute.; vol.91 (2), pp.302-323, 2000.
Li Y., Zhu Q.Y., A model of heat and moisture transfer in porous textiles with phase change materials. Textile Research. J.; vol.74(5), pp.447-457, 2004.
Li Y., Zhu Q.Y. Luo Z., Numerical simulation of heat transfer coupled with moisture sorption and liquid transport in porous textiles, paper 313(3) sixth Asian Textile Conference, Hong Kong, August, pp.22-24, 2001.
Mariaux A., Masserann C., Anisotropie de retrait et structure du bois: Recherche de l’influence des caractères morphologiques transverses des fibres. Bois et Forêts des Tropiques; vol.209, pp.35-47, 1985.
May B.K., Perré P., The importance of considering exchange surface area reduction to exhibit a constant drying flux period in foodstuffs, Journal of Food Engineering; vol.54, pp.271-282, 2002. Magno M., Ganghoffer J.F., Postle R., Lallam A., A mesoscopic wave model for textile materials in large deformations, Composite Structures; vol.57, pp.367-371, 2002.
Motakef S., El-Masri M.A., Simultaneous heat and mass transfer with phase change in porous slabs: Analytical solutions and experimental results, Heat and Mass Trans. J.; vol.33(1),
pp.163-Nadjombe F., Modélisation mathématique et simulation numérique du drapé d’un textile, Thesis of University of Haute Alsace-Mulhouse, 2002.
Nordon P., Mackay B.H., Downes J.G., Mc Mahon G.B., Sorption kinetics of water vapor in wool fibers: Evaluation of diffusion coefficients and analysis of integral sorption, Textile Research J.; October, pp.761-776, 1960.
Ogniewicz Y., Tien C.L., Analysis of condensation in porous insulation, Heat and Mass Trans J.; vol.33(1), pp.163-173, 1990.
Rios C.R., Ogin S.L., Lekakou C., Leong K.H., A study of damage development in a weft knitted fabric reinforced composite: Part I-Experiments using model sandwich laminates, Composites Part A: Applied Science and Manufacturing; vol.38, pp.1773-1793, 2007.
Teukolsky S.A., Vetterling W.T., Flannery B.P., Numerical Recipes in Fortran. The Art of Scientific Computing.-Press, W.H.,. Cambridge University Press, 1992.
Tvardovski A.V., Fomkin A.A., Tarasevich Yu. I., Zhukova A.I., Sorptive deformation of organo-substituted laminar silicates and hysteresis phenomena, Journal of Colloid and Interface Science; vol.241, pp.297-301, 2001.
Wang J.H., Yasuda H., Dynamic water vapor and heat transport through layered fabrics Part I: Effect of surface modification, Textile Research J.; January, pp.10-20, 1991.
Watanabe U., Fujita M., Norimoto M., Transverse shrinkage of coniferous wood cells examined using replica method and power spectrum analysis, Holzforshung; vol.52, pp.200-206, 1998. Yamamoto H., A model of the anisotropic swelling and shrinking process of wood. Part 1, Wood Science and Technology; vol.33, pp.311-325, 1999.
Shrinkage/swelling behaviour of knitted fabrics during relative
humidity cycles determined by x-ray imaging
Bhouri N.1,2*, Badel E.1, Ben Nasrallah S.2, Perré P.1
1LERMAB-UMR INRA 1093, ENGREF 14, rue Girardet, 54042 Nancy Cedex, France
badel@nancy.inra.fr, perre@engref.fr
2LESTE, ENIM Avenue IBN ELJAZZAR, 5019 Monastir, Tunisie
bhourinaoufel@yahoo.fr*, Sassi.Bennasrallah@crten.rnrt.tn
List of Figures
Fig. 1: Principle of the 2D X-ray imaging device and general view of the experimental device (the X-ray imaging system is coupled with the air conditioner).
Fig. 2: The climatic chamber allows several samples to be placed simultaneously in the same conditions. The captors allow the record of the relative humidity and the dry temperature.
Fig. 3: Samples holder: the fabric is positioned on a thin Millar sheet. A PVC plate, 1 mm above, limits the vertical displacement of the boundaries. The holes in the 2 plates allow the X-ray to through the sample holder. The plate can rotate in order to place each sample in the path of the X-ray beam.
Fig. 4: Structure of the Jersey knitting cotton ready-to-wear clothing: Image obtained by x-ray attenuation (a). Micrographs obtained by electronic microscopy (ESEM). Front face (b) and back face (c). (LERMAB by F. Huber)
Fig. 5: Evolution of the relative humidity and the temperature versus the time (one entire cycle) in the x-ray imaging device.
Fig. 6: Kinetics measurements: Adsorption (a) and desorption (b) kinetics versus Relative Humidity condition: The complete stabilization is almost reached after 1 H.
Fig. 7: The 2D strain field determination process. A virtual strain field is applied to the initial image until the resulting image fits the experimental deformed image. Six parameters are
Fig. 8: Evolution of the strain versus the relative humidity of the air during adsorption and desorption cycle (along course direction).
Fig. 9: Evolution of the strain versus the relative humidity of the air during adsorption and desorption cycle (along wale direction).
Fig. 10: Evolution of the shear versus the relative humidity of the air during adsorption and desorption cycle.
Fig. 11: Anisotropy. The strain along course direction is plotted versus strain along wale direction. Open marks represent the individual measurements. Line and plain marks represent the average values. The anisotropic behaviour is involved in the first adsorption step.
Fig. 12: Micrograph of the Jersey stitch obtained by electronic microscopy (ESEM). The angle of the twist is not the same on the left and right wings. This difference causes the shear deformation. (LERMAB by F. Huber)
X-ray source incident beam transmitted beam prism scintillator cooled CCD detector visible light sample
Fig. 1: Principle of the 2D X-ray imaging device and general view of the experimental device (the X-ray imaging system is coupled with the air conditioner).
Fig. 2: The climatic chamber allows several samples to be placed simultaneously in the same conditions. The captors allow the record of the relative humidity and the dry temperature.
incoming air outgoing air sample motor rotating plate temperature sensor relative humidity sensor fan
incoming X-ray beam
Fig. 3: Samples holder: the fabric is positioned on a thin Millar sheet. A PVC plate, 1 mm above, limits the vertical displacement of the boundaries. The holes in the 2 plates allow the X-ray to through the sample holder. The plate can rotate in order to place each sample in the path of the
(b) (c) (a) marker 1mm 1mm 2mm Course Wale
Fig. 4: Structure of the Jersey knitting cotton ready-to-wear clothing: Image obtained by x-ray attenuation (a). Micrographs obtained by electronic microscopy (ESEM). Front face (b) and back
0 20 40 60 80 100 0 15 30 45 60 75 9020 25 30 35 40 45 50 Relative Humidity (%) Temperature (°C) 7 6 5 4 3 2 1 Time (h) R e la ti v e H u m id it y ( % ) T e m p e ra tu re ( °C )
Fig. 5: Evolution of the relative humidity and the temperature versus the time (one entire cycle) in the x-ray imaging device.
(b) 4.9 5.1 5.3 5.5 5.7 5.9 0 1 2 345 47 49 51 53 55 57 RH (%) Moisture content (%) Time (h) M o is tu re c o n te n t (% ) R e la ti v e H u m id it y ( % ) 3.3 3.4 3.5 3.6 3.7 3.8 3.9 0 1 2 327 29 31 33 35 37 RH (%) Moisture content (%) Time (h) M o is tu re c o n te n t (% ) R e la ti v e H u m id it y ( % ) (a)
Fig. 6: Kinetics measurements: Adsorption (a) and desorption (b) kinetics versus Relative Humidity condition: The complete stabilization is almost reached after 1 H.
Fig. 7: The 2D strain field determination process. A virtual strain field is applied to the initial image until the resulting image fits the experimental deformed image. Six parameters are
evaluated: solid translation (2), solid rotation (1) and strain (3).
Initial experimental image
INPUT
solid displacement
+ strain
Satisfactory comparison with the second image
Deformed experimental image
YES NO 6 identified parameters: translation + rotation + strain START 6 n ew p ar am et er s Computed image
0 2 4 6 8 10 12 0 10 20 30 40 50 60 70 80 90 100 sample1 sample2 sample3 sample4 7 6 5 4 3 2 1 1 1 deso rptio n Ad sorp tion Relative Humidity (%) S tr a in a lo n g C o u rs e d ir e c ti o n ε cc (1 0 -1 % )
Fig. 8: Evolution of the strain versus the relative humidity of the air during adsorption and desorption cycle (along course direction).
0 2 4 6 8 10 12 0 10 20 30 40 50 60 70 80 90 100 sample1 sample2 sample3 sample4 7 6 5 4 3 2 1 deso rptio n Ads orpt ion Relative Humidity (%) S tr a in a lo n g W a le d ir e c ti o n ε ww ( 1 0 -1 % )
Fig. 9: Evolution of the strain versus the relative humidity of the air during adsorption and desorption cycle (along wale direction).
-5 -4 -3 -2 -1 00 10 20 30 40 50 60 70 80 90 100 sample1 sample2 sample3 sample4 7 6 5 4 3 2 1 desorp tion A ds or ption S h e a r ε wc ( 1 0 -1 % ) Relative Humidity (%)
Fig. 10: Evolution of the shear versus the relative humidity of the air during adsorption and desorption cycle.
0 2 4 6 8 10 12 0 2 4 6 8 10 12 6 5 4 3 7 2 1 Des orpt ion Ads orpt ion ε =cc 4 x ε ww ε cc = 2 xε ww εcc = 0.5 x εww εcc =εw w
Strain along Wale direction εww (10-1 %)
S tr a in a lo n g C o u rs e d ir e c ti o n ε cc ( 1 0 -1 % )
Fig. 11: Anisotropy. The strain along course direction is plotted versus strain along wale direction. Open marks represent the individual measurements. Line and plain marks represent the average values.
Fig. 12: Micrograph of the Jersey stitch obtained by electronic microscopy (ESEM). The angle of the twist is not the same on the left and right wings. This difference causes the shear deformation. (LERMAB by F. Huber)
Shrinkage/swelling behaviour of knitted fabrics during relative
humidity cycles determined by x-ray imaging
Bhouri N.1,2*, Badel E.1, Ben Nasrallah S.2, Perré P.1
1LERMAB-UMR INRA 1093, ENGREF 14, rue Girardet, 54042 Nancy Cedex, France
badel@nancy.inra.fr, perre@engref.fr
2LESTE, ENIM Avenue IBN ELJAZZAR, 5019 Monastir, Tunisie
bhourinaoufel@yahoo.fr*, Sassi.Bennasrallah@crten.rnrt.tn
List of Tables
Type Jersey
Yarn number (km/kg) 42
Thickness (mm) (standard conditions) 0,5975
Density (g/m2) 166,67
Stitch yarn length (cm) 0,301
Stitches number along Wale direction (cm-1) 20 Stitches number along Course direction (cm-1) 13
Finishing treatment Bleached cotton
Yarns type Ring spun
(twist factor: Z 960 t/m)