HAL Id: hal-03253747
https://hal.inrae.fr/hal-03253747
Submitted on 8 Jun 2021
HAL is a multi-disciplinary open access
archive for the deposit and dissemination of
sci-entific research documents, whether they are
pub-lished or not. The documents may come from
teaching and research institutions in France or
abroad, or from public or private research centers.
L’archive ouverte pluridisciplinaire HAL, est
destinée au dépôt et à la diffusion de documents
scientifiques de niveau recherche, publiés ou non,
émanant des établissements d’enseignement et de
recherche français ou étrangers, des laboratoires
publics ou privés.
Distributed under a Creative Commons Attribution - NonCommercial| 4.0 International
northern peatlands
Chunjing Qiu, Philippe Ciais, Dan Zhu, Bertrand Guenet, Shushi Peng, Ana
Maria Roxana Petrescu, Roxana Petrescu, Ronny Lauerwald, David
Makowski, Angela Gallego-Sala, et al.
To cite this version:
Chunjing Qiu, Philippe Ciais, Dan Zhu, Bertrand Guenet, Shushi Peng, et al.. Large historical
carbon emissions from cultivated northern peatlands. Science Advances , American Association for the
Advancement of Science (AAAS), 2021, 7 (23), pp.eabf1332. �10.1126/sciadv.abf1332�. �hal-03253747�
E C O L O G Y
Large historical carbon emissions from cultivated
northern peatlands
Chunjing Qiu1,2*, Philippe Ciais1, Dan Zhu1,3, Bertrand Guenet1,4, Shushi Peng5,
Ana Maria Roxana Petrescu6, Ronny Lauerwald7, David Makowski2,
Angela V. Gallego-Sala8, Dan J. Charman8, Simon C. Brewer9
When a peatland is drained and cultivated, it behaves as a notable source of CO2. However, we lack temporally and spatially explicit estimates of carbon losses from cultivated peatlands. Using a process-based land surface model that explicitly includes representation of peatland processes, we estimate that northern peatlands con-verted to croplands emitted 72 Pg C over 850–2010, with 45% of this source having occurred before 1750. This source surpassed the carbon accumulation by high-latitude undisturbed peatlands (36 to 47 Pg C). Carbon losses from the cultivation of northern peatlands are omitted in previous land-use emission assessments. Adding this ignored historical land-use emission implies an 18% larger terrestrial carbon storage since 1750 to close the historical global carbon budget. We also show that carbon emission per unit area decrease with time since drainage, suggesting that time since drainage should be accounted for in inventories to refine land-use emissions from cultivated peatlands.
INTRODUCTION
Land-use and land-cover change (LULCC) was the dominant source of anthropogenic carbon emissions to the atmosphere, before being overtaken by fossil fuel burning in the 1940s (1). However, relative to other terms in the global carbon budget, there are still very large uncertainties in estimates of the emission of car-bon from LULCC (2). One of the greatest challenges in constrain-ing these emissions is quantifyconstrain-ing carbon emission from human’s use of peatland. Peatlands are ecosystems with a surface soil layer of plant litter that is only partially decomposed (peat) because of waterlogged conditions and has a thickness of at least 30 to 40 cm (3, 4). While natural peatlands remove CO2 from the atmosphere, drainage and land-use change could trigger large CO2 emissions from these ecosystems.
Anthropogenic changes to northern peatlands can be traced back to long before the industrial revolution (5): to crop cultivation, pastures used for grazing, forestry, and peat fuel extraction. The use of peatlands for arable cropping is of particular concern because the intensive field drainage aerates the soil and then enhances the mineral-ization of soil organic matter, hence markedly increasing respiration (6), and the removal of harvested crops reduces plant litter inputs into the soil. However, the contribution of cultivated peatlands to the global historical carbon budget is unknown: Bookkeeping models used to reconstruct past and present land-use change emissions have ignored carbon emissions from peatlands converted to croplands
because of lack of data (7, 8), and the dynamic global vegetation models (DGVMs) used to simulate the global land carbon budget do not represent peatland (1). To date, peatland drainage and cul-tivation emissions have been estimated only using empirical ap-proaches: multiplying emission factors (EFs; carbon emissions per unit area from cultivated peatland) estimated from local field data (9) by the area of cultivated peatlands, derived from land-use sur-veys (3) or from the geospatial overlay of a present-day peatland distribution map and an agricultural land-cover map (10–14). This method known as Intergovernmental Panel on Climate Change (IPCC) tier 1 (15) does not take account of EFs decreasing with time after drainage because of the increased recalcitrance of the re-maining material (16). This slow time trend of EFs cannot be characterized accurately from local CO2 flux monitoring data given the lack of long-term observations. On the other hand, historical land-use history of peatlands is unknown, given that peatland inventories only extend to the past three decades and cultivated regions where peat has disappeared (17) cannot be seen from present- day peatland distribution maps. Thus, a temporally and spatially explicit estimate of carbon emissions from historical cultivation of peatlands is still missing.
To fill this knowledge gap, we developed the process-based ORCHIDEE-PEAT (18, 19) land surface model to represent undis-turbed natural peatland and cultivated peatland as two separate soil columns and hydrological soil tiles within a model grid cell. Hydro-logical and carbon cycles of each subgrid tile are simulated inde-pendently so that the new version of the model simulates the conversion of peatland to cropland and completely separate the car-bon balances of undisturbed and cultivated peatland. In this study, we use the model to simulate the Northern Hemisphere’s (regions north of 30°N) peatland carbon and hydrological processes coupled with land-use change and to produce spatially explicit distributions of the CO2 sequestrations by undisturbed peatlands and the CO2 emissions from historical conversion of peatlands to croplands over the past millennium. We first simulate natural peat carbon accumu-lation and dynamic peatland area extent from the Early Holocene to the year 850 CE (from here, all years are CE), and then, by
1Laboratoire des Sciences du Climat et de l’Environnement, UMR 8212,
CEA-CNRS-UVSQ F-91191 Gif-sur-Yvette, France. 2UMR MIA 518, Université Paris-Saclay, INRAE,
AgroParisTech, 16 rue Claude Bernard, 75231 Paris, France. 3Institut de Ciència i
Tecnologia Ambientals (ICTA), Universitat Autonoma de Barcelona, 08193 Barcelona, Spain. 4Laboratoire de Géologie, UMR 8538, Ecole Normale Supérieure, PSL
Re-search University, CNRS, Paris, France. 5Sino-French Institute for Earth System Science,
College of Urban and Environmental Sciences, Peking University, 100871 Beijing, China. 6Department of Earth Sciences, Vrije Universiteit Amsterdam, 1081 HV
Amsterdam, Netherlands. 7Université Paris-Saclay, INRAE, AgroParisTech, UMR
ECOSYS, 78850, Thiverval-Grignon, France. 8Geography Department, College of
Life and Environmental Sciences, University of Exeter, Exeter EX4 4RJ, UK. 9
Depart-ment of Geography, University of Utah, Salt Lake City, UT, USA. *Corresponding author. Email: [email protected]
Copyright © 2021 The Authors, some rights reserved; exclusive licensee American Association for the Advancement of Science. No claim to original U.S. Government Works. Distributed under a Creative Commons Attribution NonCommercial License 4.0 (CC BY-NC). on June 8, 2021 http://advances.sciencemag.org/ Downloaded from
prescribing to the model annual maps of reconstructed cropland areas (20), we model the progressive land-use conversion and drainage of peatland to cropland and the resulting CO2 emissions during the period 850–2010 (Materials and Methods). Past land-use decisions about whether a new cropland area was claimed from peatlands or from other natural ecosystems are poorly constrained, and thus, we construct three contrasting conversion scenarios (fig. S1). The MIN scenario is a minimum peatland conversion scenario, which assumes that the increase in cropland area in a grid cell is given in priority over non-peatland areas, with peatland being drained only when no other vegetated area is available to match the expanding cropland area in each grid cell. The MAX scenario as-sumes a maximum peatland conversion, with any increase of crop-land area in a grid cell being preferentially taken from peatcrop-land. The control (CTL) scenario assumes that the increase in cropland area is supplied proportionally from peatland and other vegetated areas present in each grid cell where cropland expands. When the conversion of a natural peatland occurs in the fraction of a model grid cell, the water table drops as water is allowed to drain freely, which fosters the aerobic decomposition of organic carbon in the upper soil horizons (Materials and Methods). Crop harvests are modeled as a direct removal and consumption of a fraction of aboveground biomass by humans (21), with residues being laid on the ground. The historical evolution of crop productivity and of harvest index, that is, the ratio of harvested grain to aboveground biomass, is parameterized following Han et al. (22) and calibrated to reproduce the historical increase in crop yields in northern coun-tries (figs. S2 and S3). Subsequent carbon input from crop residues after drainage is generally insufficient to compensate for increased peat decomposition losses, resulting in legacy carbon emissions to the atmosphere long after the initial conversion of peatland to cropland.
RESULTS
Historical evolution of northern peatlands
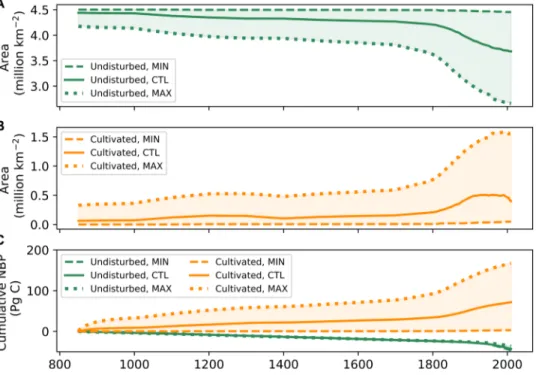
The simulated total area of northern peatlands before agricultural con-version was 4.5 million km2 with a total soil carbon stock of 544 Pg C (fig. S4). Between 850 and 2010, the area of undisturbed peatland decreased as a result of agricultural conversion by 0.8 million km2 in CTL (range, 0.05 million to 1.8 million km2 from the MIN and MAX scenarios, respectively; Fig. 1). The area of cultivated peat-lands showed a slow, gradual increase from 850 to 1750, during which only 0.2 million km2 northern peatlands became cultivated in CTL (range, 0.01 million to 0.6 million km2 from the MIN and MAX scenarios, respectively). After 1750, a rapid expansion of agri-culture on peatlands took place. The area of cultivated peatlands reached a maximum in the second half of the 20th century: 0.5 mil-lion km2 in CTL (range, 0.05 million to 1.6 million km2 in the MIN and MAX scenarios, respectively). During the period 1990 to 2010, cropland area in the Northern Hemisphere decreased as a result of regional abandonment (fig. S5). We simulated a reduction in culti-vated northern peatland area of 0.1 million km2 under our CTL sce-nario (range, 0 to 0.1 million km2 for the MIN and MAX scenarios, respectively). Because of the lack of large-scale observations, it is hard to specify whether the decrease in cultivated peatland area was a result of management practices (i.e., rewetting of abandoned peatland) or land-use conversions (cultivated peatlands were converted into another land-use type). For simplicity, all the reduction in the area of cultivated peatlands was considered to have been reclaimed by natural forest and/or grassland, and CO2 emissions after the re-claim were constrained by soil moisture and temperature of a specific subgrid soil tile for natural forest/grassland. After a cul-tivated peatland is reclaimed by natural forest/grassland, it is ex-cluded from our analysis because the model cannot explicitly track changes in its carbon balance. By the year 2000, simulated total
Fig. 1. Simulated area and cumulative net biome production of northern peatland in different scenarios. (A) Undisturbed peatland area. (B) Cultivated peatland area. (C) Cumulative net biome production (NBP) of undisturbed and cultivated peatland.
on June 8, 2021
http://advances.sciencemag.org/
(undisturbed + cultivated) area of northern peatlands was 4.2 mil-lion km2 in CTL (range, 4.2 million to 4.5 million km2 for the MAX and MIN scenarios, respectively) with a total soil carbon stock of 500 Pg C (range, 394 to 581 Pg C for the MAX and MIN scenarios, respectively). Both values are at the upper end of previous estimates for present-day northern peatlands (3.4 million to 4.0 million km2 and 270 to 540 Pg C, respectively) (23, 24).
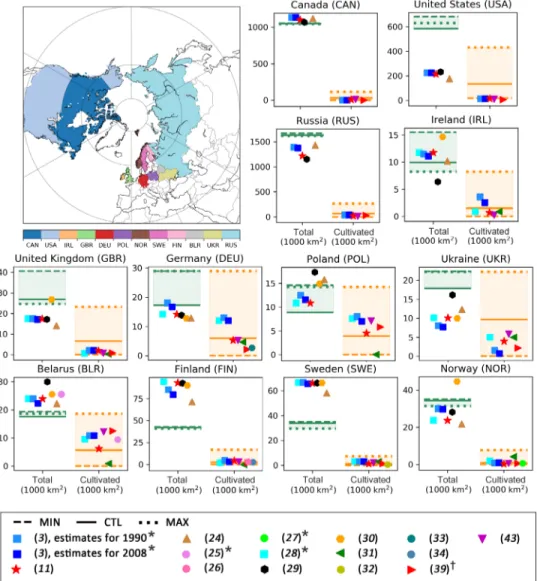
We compiled previously published estimates of contempo-rary peatland area for 12 northern countries to evaluate our sim-ulation of peatland area (3, 11, 24–34). The total peatland area of these countries shown in Fig. 2 accounts for ~90% of peatlands in the Northern Hemisphere. Our simulated area of cultivated peatlands generally matches with observations, but total and consequently cultivated peatland areas are overestimated in the United States, Ukraine, and the United Kingdom. Undisturbed peatland area in Finland and Sweden are underestimated by the model, while the area of cultivated peatlands in both countries is well reproduced.
Historical carbon emissions from northern peatlands
Simulated undisturbed peatlands was a small atmospheric carbon sink of 0.03 Pg C year−1 (under all three scenarios) over 850–1850, and this sink has intensified from 1850 in response to rising atmo-spheric CO2 and climate change, reaching 0.2, 0.3, and 0.1 Pg C year−1 in the CTL, MIN, and MAX scenarios, respectively, over 1990–2000. Previous studies suggested a northern peatland carbon sink of ~0.09 Pg C year−1 for the past 1000 years (35) and of 0.10 Pg C year−1 for 850–1850 (36). However, both estimates were based on carbon accumulation rates derived from age-dated peat cores and did not take into account the decay of deeper peat (peat accumulated before 850). After considering the decay of previously accumulated peat, northern natural peatlands were a net carbon sink of only 0.04 Pg C year−1 over the past 1000 years (35), which compares well with our estimate of 0.04 Pg C year−1 over 850–2010.
Carbon emission in the context of this study is defined as net biome production (NBP), which includes both the net CO2 exchange
Fig. 2. Simulated total (green transparent boxes) and cultivated (orange transparent boxes) peatland area under three scenarios (MIN, CTL, and MAX), com-pared with previously published estimates for 12 countries. *Drained area for agriculture, not only for crop cultivation. †Following the 2006 IPCC Guidelines (38), land that has not undergone any land-use conversion for a period of at least 20 years is reported in a “remaining” category to UNFCCC National Greenhouse Gas Inventory (Submissions 2019) (39), while land affected by land-use conversion is reported in a “conversion” category for 20 years and then will be transferred to the remaining cat-egory. Estimates of United Nations Framework Convention on Climate Change (UNFCCC) are the sum of the category reported as “Cropland remaining Cropland on organic soils” and the category reported as “Wetland converted to Cropland on organic soils” (common reporting format table 4.B).
on June 8, 2021
http://advances.sciencemag.org/
between the ecosystem and atmosphere and carbon losses due to harvest of crop biomass. Positive NBP represents net carbon loss from the ecosystem, whereas negative NBP represents net car-bon uptake by the ecosystem. We estimated an average carcar-bon emission from cultivated northern peatlands of 0.15 Pg C year−1 over the 1990–2000 decade (range, 0.02 to 0.25 Pg C year−1 from the MIN and MAX scenarios, respectively), larger than the estimate by Carlson et al. (11) (0.08 Pg C year−1) and comparable to the esti-mates by Joosten (3) (0.11 Pg C year−1) and Frolking et al. (4) (0.15 Pg C year−1) for northern peatlands under drained agricultur-al land use. The difference between those estimates is attributable to the area of cultivated peatlands and the EFs used by each study. We found that the area of cultivated peatlands ranked as this study > Frolking et al. > Joosten > Carlson et al., whereas the EFs ranked as this study < Frolking et al. < Joosten < Carlson et al. (table S1). Note that any former cultivated peatland that has been converted into a mineral soil because of peat carbon loss cannot be identified by observations of present soil properties but has been included in our model estimates. There is observational evidence that extensive areas of former peatlands in northern countries, such as the Netherlands (17), Belarus (25), and Denmark (37), have been re-classified into other soil classes because of peat subsidence, the loss of soil organic matter, and erosion following human activities (28), although it is likely that crop cultivation was not the only human activity in history that may have caused degradation of peatlands.
We estimated cumulative emissions from cultivated peatlands under the CTL, MIN, and MAX scenarios to be 31, 1, and 84 Pg C, respectively, over 850–1750 and 40, 3, and 84 Pg C, respectively, over 1750–2010 (Fig. 1C). Cumulative sequestrations by undisturbed northern peatlands are 43, 47, and 36 Pg C over 850–2010 and 21, 25, and 14 Pg C for 1750–2010 in the CTL, MIN, and MAX scenarios, respectively, thus compensating only half of carbon emissions from cultivated northern peatlands.
Change of EFs of cultivated northern peatlands with time since drainage
The simulated carbon emission rates of cultivated peatlands from our three conversion scenarios in the previous section depend both on changes in the area of converted peatland and on changes in carbon per unit area, equivalent to EFs (Materials and Methods). In contrast, in situ observed EFs are the rate of carbon emissions per unit area of cultivated peatland, independent of the area of converted peatland. To obtain simulated EFs that can be compared with field measurements, we performed additional model sensitivity experi-ments in which all the natural peatlands were converted at a certain date and then the cultivated peatland area is held constant after that first conversion. In these model experiments, the conversion of northern peatlands to croplands is prescribed to occur as a single cohort so that interference from further changes in the area of con-verted peatland is excluded. The simulated EFs deduced from these model experiments are diagnosed in each model grid cell as the NBP of cultivated peatlands per unit area.
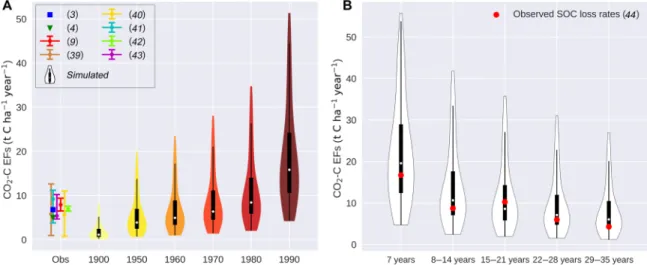
Measurements of carbon emissions from cultivated peatlands are scarce. For instance, the default tier 1 EFs of the 2013 Wetland Supplement (9) to the 2006 IPCC Guidelines for the boreal and temperate zone were based on measurements from only 39 European sites (table S2). On the basis of eddy covariance/chamber and/or in situ peat subsidence measurements (3, 4, 9, 39–44), carbon emis-sions from temperate and boreal cultivated peatlands were estimated to range between 0.8 and 12.6 tonnes C ha−1 year−1 (Fig. 3A). These site-level estimates, however, were derived from peatlands that have been drained for decades or centuries (table S2); thus, we cannot differentiate the initial pulse of carbon emissions after conversion from the long-term tail of emissions after peatland has been drained and cultivated for decades (9). To gain insight into how EFs change with time after conversion, the first conversion of northern peatlands to croplands is prescribed to occur in 1900, 1950, 1960, 1970, 1980,
Fig. 3. Observed and simulated EFs. (A) Simulated present-day (averaged over 1990–2010) EFs when the conversion of peatlands to croplands occurred in 1900, 1950, 1960, 1970, 1980, and 1990, compared to observations. In each violin, the black mini-box shows the first and the third percentile of simulated EFs, the white dot shows the median, and whiskers show first quartile − 1.5 × IQR and third quartile + 1.5 × IQR. Note that EFs from (40) are the average and the ranges, whereas EFs from (9, 41, 42) are the average and the 95% confidence interval of the measurement. For (39, 43), we show the average and ranges of EFs used by the same 12 countries as in Fig. 2. EFs for the category reported as Wetland converted to Cropland on organic soils to UNFCCC considered carbon stock change in living biomass and are different from EFs used for the category reported as Cropland remaining Cropland on organic soils; thus, the EFs for (39) in this figure represent area-weighted averages of these two categories. (B) Simulated EFs after peatlands have been converted for 7 years, 8 to 14 years, 15 to 21 years, 22 to 28 years, and 29 to 35 years (simulated drainage and conversion of peatlands to croplands occurred in 1960) compared to measured SOC loss rates of a peatland used for row crop rotation from a long-term continuous experiment (44).
on June 8, 2021
http://advances.sciencemag.org/
and 1990, respectively, in each sensitivity experiment (Materials and Methods). Those simulated EFs in Fig. 3A clearly show that the earlier peatlands were drained, the smaller the predicted present- day (average of 1990–2010) EFs. For instance, the median EF of peatlands that were converted in 1900 is 1.1 t C ha−1 year−1, which is 92% smaller than the one of peatlands converted in 1990. The interquartile range (IQR) of present-day EFs goes down from 13.6 t C ha−1 year−1 (if peatlands were converted in 1990) to 1.9 t C ha−1 year−1 (if peatlands were converted in 1900), indicating that the spatial variation in present-day cultivated peatlands EFs also de-creases with time since conversion. This implies that EFs should depend on the time since conversion, with high values shortly after conversion, which then decrease over time. We found only one study (44) that measured peat soil carbon before cultivation and continuously followed the evolution of the drained peat soil after drainage for more than four decades, the observed decreasing soil organic carbon (SOC) loss rates with time since conversion match well with our results (Fig. 3B).
In Fig. 3A, the best agreement between simulated EFs and available observed EFs is found when the conversion of northern peatlands is set to the mid-20th century. This is consistent with the fact that the few peatland sites measured to define the tier 1 CO2 EFs in the 2013 Wetland Supplement (9) were subject to extensive peatland conversion and/or deepening of the artificial peatland drainage in the mid-20th century (table S2), although no precise date of conversion was reported.
DISCUSSION
Our study accounts for the full spatial and temporal development of historical peatland cultivation and pertaining carbon emissions. It reveals large historical carbon emissions from the cultivation of northern peatlands. Land-use emissions due to the cultivation of peatlands have not otherwise been accounted for either by book-keeping models or DGVMs. These models treat cultivated peatlands as croplands on mineral soils. They assess Northern Hemisphere emissions from all LULCC activities to be about 60 Pg C over the period 1750–2018 (fig. S6) (1, 45). Adding land-use emissions from northern peatland conversion from the CTL scenario of our study, therefore, implies a major upward reappraisal of total historical LULCC emissions between 1750 and 2018 by 67% for the Northern Hemisphere [calculated as (40/60 Pg C) × 100%]. As the historical (1750–2018) cumulative human-caused carbon emissions from fos-sil fuels and cement (440 ± 20 Pg C) (46), the cumulative carbon uptake by oceans (170 ± 20 Pg C) (1), and the cumulative increase in atmospheric CO2 (275 ± 5 Pg C) (47) are relatively well con-strained, the global land biosphere is constrained to be near neutral over 1750–2018. Our upward revision of northern LULCC emis-sions after including emisemis-sions from cultivated northern peat-lands implies that the cumulative carbon uptake by terrestrial ecosystems has been underestimated because the carbon emitted by cultivated northern peatlands needs to be balanced by a corre-sponding increase in the terrestrial carbon uptake fluxes (2). The most recent assessment of the global carbon budget (1) estimated that the cumulative carbon uptake by terrestrial ecosystems over 1750–2018 is 220 ± 50 Pg C. We show that this number needs to be increased by 18% [calculated as (40/220 Pg C) × 100%] if the budget takes emissions from cultivated northern peatlands into account.
From our two extreme conversion scenarios (MIN and MAX), we estimate that a range of 3 to 84 Pg C was emitted by cultivated northern peatlands over 1750–2010. At site scale, observed carbon emissions from cultivated peatlands depend on local context, i.e., peat type, land-use history, crop type, and management practices such as water table level controls, fertilization, cultivation intensity, and tillage (32, 48–51). These local conditions and management history are not known from gridded datasets in the Northern Hemisphere and further cannot be reproduced by a large-scale land surface model with generic parameters, which hinders our capacity to understand the full uncertainty range in cultivated peatland carbon emissions.
The model sensitivity experiments show a sizeable decrease of EFs with time since conversion, suggesting that inventories should col-lect EF data for a range of cultivated peatlands of different ages, and include the time of peatland agriculture inception in their estimate. Alternatively, a calibrated model such as ORCHIDEE-PEAT could be used to simulate how EFs vary with time after land-use change.
Carbon loss by peatland is irreversible on centennial time scales; this previously overlooked anthropogenic carbon emission should be accounted for in assessments of the historical carbon budget and in estimates of the dwindling carbon budget for assessing future warm-ing targets. Future work should focus on improvwarm-ing the reconstruction of land-use change involving peatland, including practices such as the extraction of peat as a fuel, the conversion and improvement of peatland for pasture and forestry, as well as the restoration of peatlands (10, 52). The second priority is to extend estimates of LULCC carbon emissions from northern peatlands to the tropics, where deforestation and fires, oil palm and rubber plantations, and the encroachment of urban areas into coastal peat ecosystems appear to have caused a reduction of peat carbon stocks in many regions (53, 54) and are likely to be major sources of future emissions from peatlands.
MATERIALS AND METHODS
Input data
Simulations were performed using the ORCHIDEE-PEAT land surface model (18, 19), driven by meteorological forcing data, histor-ical land-cover maps, and historhistor-ical data of atmospheric CO2 concen-trations. For the meteorological forcing, we used CRUNCEP version 8 (http://forge.ipsl.jussieu.fr/orchidee/wiki/Documentation/Forcings) at 2°-by-2° spatial resolution. This dataset covers the years 1901 to 2010. Historical land-cover maps at 0.25°-by-0.25° spatial resolu-tion and covering the period from 850 to 2010 were reconstructed by merging the European Space Agency (ESA) Climate Change Initiative (CCI) dataset (www.esa-landcover-cci.org/) with the LUH2v2 data-set (http://luh.umd.edu/). In those maps, vegetation is discretized into 13 plant functional types (PFTs), including one for bare soil type, eight for trees, and one each for C3 natural grass, C4 natural grass, C3 crops, and C4 crops. A detailed description of the recon-struction of the land-cover maps can be found at https://orchidas. lsce.ipsl.fr/dev/lccci/. For simulation years before 1861, atmospher-ic CO2 concentration was fixed at the preindustrial level (286 parts per million). For the period 1861–2010, observation- based historical CO2 concentrations were used.
ORCHIDEE-PEAT land surface model
The starting point for ORCHIDEE-PEAT is ORCHIDEE-MICT re-vision 4229 (55). The model groups vegetation species with similar characteristics into functional types (PFTs), and the areal extent of
on June 8, 2021
http://advances.sciencemag.org/
each PFT in a grid cell is described as its fractional area in the grid cell (56). Carbon exchanges between the atmosphere and plants and soils are simulated independently for each PFT.
In this study, fractional areas of 13 PFTs growing on non-peatland were predefined from the land-cover map described above. An ad-ditional, peatland-specific PFT (the 14th PFT) was added to repre-sent natural peatlands (18, 19). The extent of this peatland-specific PFT was dynamically simulated from the Early Holocene to 850. For each grid cell, the inundation extent was first simulated by a cost-efficient version of TOPMODEL according to subgrid-scale topographic information, simulated soil temperature, and soil moisture of the grid cell (19, 57). An inundation area could then develop into peatland if the peatland development criteria below were met: (i) Over a long period, the area is frequently inundated (at least Num months during 30 years, with Num being the number of growing season months in the 30 years). (ii) The grid cell has a pos-itive summer water balance (total summer precipitation − potential evaporation ≥ 60 mm). (iii) The peatland PFT has accumulated soil carbon of more than 50 kg C m−2 (this last condition only con-strains the expansion of peatland; the inception of peatland in the grid cell is not limited by it). Subsequently, the simulated areal frac-tion of the peatland-specific PFT was subtracted from the pre-defined fraction of natural PFTs from the land-cover map.
The model resolves vertical soil water flow and heat transfer within the soil column by multilayer physically based schemes at a half-hourly time step (55). The natural peatland PFT was represent-ed as a subgrid soil tile characterizrepresent-ed by a large porosity (0.9 m3 m−3) and a large saturated water conductivity (2120 mm day−1); thus, the downward water percolation of this peatland tile is larger than non-peatland tiles (18). Furthermore, the natural peatland soil tile has an impermeable bottom and receives water input from surface runoff from non-peatland tiles in the model grid cell (in addition to water from precipitation) (18); both parameterizations contribute to simulated shallow water tables of the natural peatland soil tile (fig. S7).
Two litter (metabolic and structural) and three soil (active, slow, and passive) carbon pools are represented by the model; all are ver-tically discretized into 32 layers (38 m in total, with exponentially coarser resolution as depth increases). Aboveground plant residues are added to the top layer of litter pools, while belowground plant residues are added to active layers above the permafrost, assuming an exponential distribution of vegetation roots. To take the vertical heterogeneity in soil temperature, soil freezing, and soil moisture into account, the decomposition of peat is also parameterized as a multilayer scheme. For each model layer, different residence times are prescribed for each carbon pool; these are then modified by temperature and moisture of the layer at a daily time step (19). The carbon flow between pools is also calculated for each layer, follow-ing the CENTURY model (fig. S8) (58). More detailed descriptions of the treatment of natural peatland in ORCHIDEE-PEAT can be found in (18, 19).
To represent peatlands reclaimed for crop cultivation, we added another independent subgrid soil tile. It has the same porosity and saturated water conductivity as natural peatlands. In reality, the wa-ter tables of cultivated peatlands are managed by humans, i.e., wawa-ter table is lowered by drainage ditches. Detailed peat conversion prac-tices cannot be explicitly modeled. We assumed that each time a peat fraction is converted, it is allocated to a new soil tile from which water in the bottom of the soil column is allowed to drain freely as
in non-peatland soil tiles. In contrast, nondisturbed peatlands remain on soil tiles that are not drained from the bottom and thus keep water in the peat column. Switching on the deep drainage pro-cess after conversion causes previously water-saturated “catotelm” deep layers to lose water and triggers a reduction of the soil mois-ture content in the upper part of the peat column (see example for one grid cell in fig. S9). Consequently to this drying of the upper peat column, an enhancement of aerobic decomposition of peat occurs. Like for undisturbed peatlands, the decomposition of SOC in a cultivated peatland is modeled to depend on soil temperature and moisture for each layer. Aerobic decomposition occurs in any unsaturated layer. Simulated peat depth in grid cells where part of natural peatlands has been converted to croplands is generally greater than 1.5 m, and about 30% of those grid cells have a peat depth greater than 5.1 m (fig. S10). However, because both the soil moisture content and the turnover time of SOC of cultivated peat-land increased with depth, the largest decomposition rates and, thus, the largest CO2 emissions from drainage occurred in the top 1.5 m (>20% loss of SOC 20 years after the conversion of peatlands to croplands; fig. S10).
Crops planted on cultivated peatlands are represented by a C3 crop PFT (the 15th PFT) and a C4 crop PFT (the 16th PFT). The 15th and 16th PFTs follow the same suite of equations and parame-ters as the C3 (the 12th) and C4 crop (the 13th) PFTs on non-peatland areas, respectively (56). Their areal fraction was calculated and updated annually by a grid cell–by–grid cell overlay of the simulated peatland area with the cropland area from the land-cover map (see the next section for three conversion scenarios). The areal frac-tion of the 15th and 16th PFT was then subtracted from the pre-defined fraction of the 12th and 13th PFT from the land-cover map, respectively.
Harvest of crops is represented as a direct removal and con-sumption of a fraction of aboveground biomass by humans (21). Tillage of cultivated peatlands is represented by a 20% increase of soil carbon decomposition rates (21). To evaluate the simulated decomposability of SOC of cultivated peatlands, we created an emulator to model incubation experiments using the structure and parameters of ORCHIDEE-PEAT. More specifically, we simulated CO2 emission rates from each soil layer when it is exposed to a given incubation temperature and optimal moisture condition (no mois-ture limitation). Our simulated CO2 release rates fall well within observed rates from laboratory aerobic incubation experiments for arable peatland: simulated 0.09 to 0.18 versus measured 0.07 to 0.31 mg C g−1 C day−1 incubated at 10° to 20°C from seven arable peatland sites in Switzerland (59), simulated 0.29 to 0.40 versus measured 0.38 to 0.65 mg C g−1 C day−1 incubated at 22°C from two arable peatland sites in Canada (60), and simulated 0.10 to 0.21 ver-sus 0.12 to 0.26 mg C g−1 C day−1 incubated at 23°C from 50 sites in Germany (61) [cultivated sites were not distinguished from other agricultural uses (61)].
Model experiments and simulation protocol
Simulation protocol
Simulations were conducted in four steps. The first two steps (Early Holocene and Later Holocene to 850) were used to simulate carbon accumulation and dynamic area expansion of natural peatlands using TOPMODEL and the peatland development criteria. In the third and fourth steps (850 to 1900 and 1901 to 2010), the conver-sion of natural peatland to cropland was simulated. According to
on June 8, 2021
http://advances.sciencemag.org/
HYDE 3.2 (20), total cropland area in northern regions (>30°N) was small (~0.7 million km2) before 850. We therefore assumed that all these croplands were on mineral soils and that natural peatlands have been reclaimed for agricultural use only since 850. The first step of the simulation aimed at reaching a steady state for natural peatland area and soil carbon stocks in the Early Holocene. This step included 180 years of full model runs to reach steady state for biomass, followed by a 12,000-year spin-up of the soil carbon sub-model to reach steady state for soil carbon pools, looping over the meteorological forcing data for 1960–1990 to approximate the warmer-than-preindustrial climate of the Early Holocene (62). The second step consisted of running the full model over another 100 years without peatland conversion to croplands, before the model was run in the third step with changing land cover, and the consequent con-version of natural to cultivated peatlands from 850 to 1900. For the second and third steps, we looped over the meteorological forcing data for 1901–1920 to approximate the cooler climate of the late Holocene. In the fourth step, fully transient runs for 1901–2010 were conducted using the corresponding historical data for both the meteorological forcing and land cover.
Three scenarios of peatland conversion
To estimate historical conversion of peatland from 850 to 2010, for each year, a reconstructed cropland cover map was first predefined in the model, and then, the model performed a grid cell–by–grid cell overlay of the cropland map with the simulated peatland distri-bution. The time of peatland agriculture inception and its expan-sion trajectory varies greatly between different regions (5); for example, the use of peatlands in some regions is inhibited by limited accessibility, while some other peatlands were extensively used for crops (63). Lacking information on historical changes in the spatial distribution of cultivated peatlands, we defined two scenarios to span a conservative uncertainty range. One scenario describes a minimum estimate for peatland conversion (MIN): It assumes that the increase of cropland area in a grid cell is first allocated to non-peatland area and then to peatland if no more non-peatland area is available. The other scenario describes a maximum estimate of peatland conversion (MAX): It assumes that the increase of crop-land area in a grid cell is first allocated to peatcrop-land and then to non-peatland area if no more peatland is available. The true area of cultivated peatlands is somewhere within the range of MIN and MAX. In addition, we followed a third scenario (the control scenario, CTL) as the most plausible: It assumes that the increase in cropland area of a grid cell is supplied proportionally from peatland and non-peatland ecosystems present in the grid cell (fig. S1) (10–13). Thus, simulated changes in the extent of cultivated peatland depend only on cropland area dynamics (from reconstructed cropland cov-er maps) and on our scenarios of diffcov-erent peatland fractions being converted when the area of cropland changes in a grid cell. Changes in the extent of cultivated peat are independent from the carbon balance of cultivated peatland per unit area after a conversion, i.e., cultivated peatlands that have become CO2 sinks because of deple-tion of peat or the recharge of soils from cropland input were not excluded from our estimates.
As a large-scale land surface model, ORCHIDEE-PEAT cannot track individual cohorts of cultivated peatlands explicitly. Changes in the extent of a cultivated peatland in a grid cell are represented as an increase/decrease in its areal fraction in the grid cell. As a result, changes in the area of cultivated peatland in a grid cell interfere with the simulated SOC density of cultivated peatland.
If the area of cultivated peatland in a grid cell increases, cultivated peatland will encroach on natural peatland, and then, the areal fraction of both natural (Eq. 1) and cultivated peatland (Eq. 2) and the SOC density of the cultivated peatland in the grid cell (Eq. 3) will be updated, whereas the SOC density of the natural peatland remains unchanged (Eq. 4)
f naturalt+1 = f naturalt − f cultivated (1) f cultivatedt+1 = f
cultivatedt + f cultivated (2)
SOC t+1cultivated = SOC ──────────────────────────cultivatedt × f cultivatedt + SOC naturalt × f cultivated f cultivatedt + f
cultivated (3) SOC naturalt+1 = SOC naturalt (4) where fcultivated is the change in the areal fraction of cultivated peat-land in the grid cell, SOCcultivated and fcultivated are the SOC density and the areal fraction of cultivated peatland in the grid cell, respec-tively, SOCnatural and fnatural are the SOC density and the areal frac-tion of natural peatland in the grid cell, respectively, superscript
trepresents the state before the expansion of cultivated peatland
area, and superscript t + 1 represents the state after the expansion of cultivated peatland area.
If the area of cultivated peatland in a grid cell decreases, then abandoned cultivated peatland area will be reclaimed by a forest and/or grassland PFT and its SOC will be allocated to forest and/or grassland SOC stock. As a result, only the areal fraction of cultivated peatland will be updated (Eq. 5)
f cultivatedt+1 = f
cultivatedt − f cultivated (5) Therefore, the SOC density of a cultivated peatland in a grid cell does not change if its area decreases. In contrast, when the area of cultivated peatland in a grid cell increases, the cultivated peatland ecosystem will “take over” carbon from natural peatland, resulting in an increase in its SOC density and, subsequently, an increase in carbon emission rates. We thus performed model sensitivity exper-iments with a fixed area of cultivated peatland to reproduce the evo-lution of emission rates as a function of time since drainage and thus to obtain simulated EFs values that can be compared with field measurements.
Sensitivity experiments
The first conversion of peatlands to croplands for providing simu-lated EFs values is prescribed to occur in 1900, 1950, 1960, 1970, 1980, and 1990, respectively, in each model experiment. The area of cultivated peatlands was kept fixed after the year of conversion so that cultivated peatland in the experiment is represented as a single cohort. This procedure excludes additional carbon losses, e.g., from subsequent changes in the area of cultivated peatland and allows to simulate EFs that mimic the observation conditions. Figure S11 shows changes in the area-weighted mean carbon emission rates from cultivated northern peatlands.
SUPPLEMENTARY MATERIALS
Supplementary material for this article is available at http://advances.sciencemag.org/cgi/ content/full/7/23/eabf1332/DC1
on June 8, 2021
http://advances.sciencemag.org/
REFERENCES AND NOTES
1. P. Friedlingstein, M. Jones, M. O’Sullivan, R. Andrew, J. Hauck, G. Peters, W. Peters, J. Pongratz, S. Sitch, C. Le Quéré, D. C. E. Bakker, J. G. Canadell, P. Ciais, R. B. Jackson, P. Anthoni, L. Barbero, A. Bastos, V. Bastrikov, M. Becker, L. Bopp, E. Buitenhuis, N. Chandra, F. Chevallier, L. P. Chini, K. I. Currie, R. A. Feely, M. Gehlen, D. Gilfillan, T. Gkritzalis, D. S. Goll, N. Gruber, S. Gutekunst, I. Harris, V. Haverd, R. A. Houghton, G. Hurtt, T. Ilyina, A. K. Jain, E. Joetzjer, J. O. Kaplan, E. Kato, K. K. Goldewijk, J. I. Korsbakken, P. Landschützer, S. K. Lauvset, N. Lefèvre, A. Lenton, S. Lienert, D. Lombardozzi, G. Marland, P. C. McGuire, J. R. Melton, N. Metzl, D. R. Munro, J. E. M. S. Nabel, S.-I. Nakaoka, C. Neill, A. M. Omar, T. Ono, A. Peregon, D. Pierrot, B. Poulter, G. Rehder, L. Resplandy, E. Robertson, C. Rödenbeck, R. Séférian, J. Schwinger, N. Smith, P. P. Tans, H. Tian, B. Tilbrook, F. N. Tubiello, G. R. van der Werf, A. J. Wiltshire, S. Zaehle, Global carbon budget 2019. Earth Syst. Sci. Data 11, 1783–1838 (2019). 2. A. Arneth, S. Sitch, J. Pongratz, B. D. Stocker, P. Ciais, B. Poulter, A. D. Bayer, A. Bondeau,
L. Calle, L. P. Chini, T. Gasser, M. Fader, P. Friedlingstein, E. Kato, W. Li, M. Lindeskog, J. E. M. S. Nabel, T. A. M. Pugh, E. Robertson, N. Viovy, C. Yue, S. Zaehle, Historical carbon dioxide emissions caused by land-use changes are possibly larger than assumed.
Nat. Geosci. 10, 79–84 (2017).
3. H. Joosten, The Global Peatland CO2 Picture: Peatland Status and Drainage Related
Emissions in all Countries of the World (Wetlands International, 2010).
4. S. Frolking, J. Talbot, M. C. Jones, C. C. Treat, J. B. Kauffman, E.-S. Tuittila, N. T. Roulet, Peatlands in the Earth’s 21st century climate system. Environ. Rev. 19, 371–396 (2011). 5. J. Holden, P. J. Chapman, J. C. Labadz, Artificial drainage of peatlands: Hydrological and hydrochemical process and wetland restoration. Prog. Phys. Geogr. 28, 95–123 (2004).
6. H. E. Taft, P. A. Cross, G. Edwards-Jones, E. R. Moorhouse, D. L. Jones, Greenhouse gas emissions from intensively managed peat soils in an arable production system.
Agric. Ecosyst. Environ. 237, 162–172 (2017).
7. R. A. Houghton, A. A. Nassikas, Global and regional fluxes of carbon from land use and land cover change 1850–2015. Global Biogeochem. Cycles 31, 456–472 (2017). 8. E. Hansis, S. J. Davis, J. Pongratz, Relevance of methodological choices for accounting
of land use change carbon fluxes. Global Biogeochem. Cycles 29, 1230–1246 (2015). 9. IPCC, 2013 Supplement to the 2006 IPCC Guidelines for National Greenhouse Gas Inventories:
Wetlands, T. Hiraishi, T. Krug, K. Tanabe, N. Srivastava, J. Baasansuren, M. Fukuda,
T. G. Troxler, Eds. (IPCC, 2014).
10. J. Leifeld, L. Menichetti, The underappreciated potential of peatlands in global climate change mitigation strategies. Nat. Commun. 9, 1071 (2018).
11. K. M. Carlson, J. S. Gerber, N. D. Mueller, M. Herrero, G. K. MacDonald, K. A. Brauman, P. Havlik, C. S. O’Connell, J. A. Johnson, S. Saatchi, P. C. West, Greenhouse gas emissions intensity of global croplands. Nat. Clim. Chang. 7, 63–68 (2017).
12. J. Leifeld, C. Wüst-Galley, S. Page, Intact and managed peatland soils as a source and sink of GHGs from 1850 to 2100. Nat. Clim. Chang. 9, 945–947 (2019).
13. F. Tubiello, R. Biancalani, M. Salvatore, S. Rossi, G. Conchedda, A worldwide assessment of greenhouse gas emissions from drained organic soils. Sustainability 8, 371 (2016).
14. G. Conchedda, F. N. Tubiello, Drainage of organic soils and GHG emissions: Validation with country data. Earth Syst. Sci. Data 12, 3113–3137 (2020).
15. IPCC, 2019 Refinement to the 2006 IPCC Guidelines for National Greenhouse Gas Inventories (2019); www.ipcc.ch/report/2019-refinement-to-the-2006-ipcc-guidelines-for-national-greenhouse-gas-inventories/ [accessed 11 March 2021].
16. S. Rojstaczer, S. J. Deverel, Time dependence in atmospheric carbon inputs from drainage of organic soils. Geophys. Res. Lett. 20, 1383–1386 (1993).
17. B. Kempen, D. J. Brus, G. B. M. Heuvelink, J. J. Stoorvogel, Updating the 1:50,000 Dutch soil map using legacy soil data: A multinomial logistic regression approach. Geoderma
151, 311–326 (2009).
18. C. Qiu, D. Zhu, P. Ciais, B. Guenet, G. Krinner, S. Peng, M. Aurela, C. Bernhofer, C. Brümmer, S. Bret-Harte, H. Chu, J. Chen, A. R. Desai, J. Dušek, E. S. Euskirchen, K. Fortuniak, L. B. Flanagan, T. Friborg, M. Grygoruk, S. Gogo, T. Grünwald, B. U. Hansen, D. Holl, E. Humphreys, M. Hurkuck, G. Kiely, J. Klatt, L. Kutzbach, C. Largeron, F. Laggoun-Défarge, M. Lund, P. M. Lafleur, X. Li, I. Mammarella, L. Merbold, M. B. Nilsson, J. Olejnik, M. Ottosson-Löfvenius, W. Oechel, F.-J. W. Parmentier, M. Peichl, N. Pirk, O. Peltola, W. Pawlak, D. Rasse, J. Rinne, G. Shaver, H. P. Schmid, M. Sottocornola, R. Steinbrecher, T. Sachs, M. Urbaniak, D. Zona, K. Ziemblinska, ORCHIDEE-PEAT (revision 4596), a model for northern peatland CO2, water, and energy fluxes on daily to annual scales. Geosci. Model Dev. 11, 497–519 (2018).
19. C. Qiu, D. Zhu, P. Ciais, B. Guenet, S. Peng, G. Krinner, A. Tootchi, A. Ducharne, A. Hastie, Modelling northern peatland area and carbon dynamics since the Holocene with the ORCHIDEE-PEAT land surface model (SVN r5488). Geosci. Model Dev. 12, 2961–2982 (2019).
20. K. Klein Goldewijk, A. Beusen, J. Doelman, E. Stehfest, New anthropogenic land use estimates for the Holocene; HYDE 3.2. Earth Syst. Sci. Data 9, 927–953 (2017).
21. S. Piao, P. Ciais, P. Friedlingstein, N. de Noblet-Ducoudré, P. Cadule, N. Viovy, T. Wang, Spatiotemporal patterns of terrestrial carbon cycle during the 20th century.
Global Biogeochem. Cycles 23, GB4026 (2009).
22. P. Han, N. Zeng, F. Zhao, X. Lin, Estimating global cropland production from 1961 to 2010.
Earth Syst. Dynam. 8, 875–887 (2017).
23. Z. C. Yu, Northern peatland carbon stocks and dynamics: A review. Biogeosciences 9, 4071–4085 (2012).
24. J. Xu, P. J. Morris, J. Liu, J. Holden, PEATMAP: Refining estimates of global peatland distribution based on a meta-analysis. Catena 160, 134–140 (2018).
25. A. Kozulin, N. Tanovitskaya, N. Minchenko, Developing a national strategy
for the conservation and sustainable use of peatlands in the Republic of Belarus. Mires Peat.
21, 1–17 (2018).
26. T. Lapveteläinen, K. Regina, P. Perälä, Peat-based emissions in Finland’s national greenhouse gas inventory. Boreal Environ. Res. 12, 225–236 (2007).
27. A. Grønlund, A. Hauge, A. Hovde, D. P. Rasse, Carbon loss estimates from cultivated peat soils in Norway: A comparison of three methods. Nutr. Cycl. Agroecosyst. 81, 157–167 (2008). 28. H. Joosten, D. Clarke, Wise Use of Mires and Peatlands: Background and Principles Including
A Framework for Decision-Making (International Mire Conservation Group and
International Peat Society, 2002).
29. N. H. Batjes, Harmonized soil property values for broad-scale modelling (WISE30sec) with estimates of global soil carbon stocks. Geoderma 269, 61–68 (2016). 30. F. Tanneberger, C. Tegetmeyer, S. Busse, A. Barthelmes, S. Shumka, A. M. Mariné,
K. Jenderedjian, G. M. Steiner, F. Essl, J. Etzold, C. Mendes, A. Kozulin, P. Frankard, Đ. Milanović, A. Ganeva, I. Apostolova, A. Alegro, P. Delipetrou, J. Navrátilová, M. Risager, A. Leivits, A. M. Fosaa, S. Tuominen, F. Muller, T. Bakuradze, M. Sommer, K. Christanis, E. Szurdoki, H. Oskarsson, S. H. Brink, J. Connolly, L. Bragazza, G. Martinelli, O. Aleksāns, A. Priede, D. Sungaila, L. Melovski, T. Belous, D. Saveljić, F. De Vries, A. Moen, W. Dembek, J. Mateus, J. Hanganu, A. Sirin, A. Markina, M. Napreenko, P. Lazarević, V. Š. Stanová, P. Skoberne, P. H. Pérez, X. Pontevedra-Pombal, J. Lonnstad, M. Küchler, C. Wüst-Galley, S. Kirca, O. Mykytiuk, R. Lindsay, H. Joosten, The peatland map of Europe. Mires Peat. 19, 1–17 (2017).
31. E. Lappalainen, Global Peat Resources (International Peat Society, 1996). 32. Ö. Berglund, K. Berglund, Distribution and cultivation intensity of agricultural peat
and gyttja soils in Sweden and estimation of greenhouse gas emissions from cultivated peat soils. Geoderma 154, 173–180 (2010).
33. N. Roeder, B. Osterburg, The impact of map and data resolution on the determination of the agricultural utilisation of organic soils in Germany. Environ. Manag. 49, 1150–1162 (2012).
34. H. Kekkonen, H. Ojanen, M. Haakana, A. Latukka, K. Regina, Mapping of cultivated organic soils for targeting greenhouse gas mitigation. Carbon Manag. 10, 115–126 (2019).
35. Z. Yu, Holocene carbon flux histories of the world’s peatlands: Global carbon-cycle implications. Holocene 21, 761–774 (2011).
36. A. V. Gallego-Sala, D. J. Charman, S. Brewer, S. E. Page, I. C. Prentice, P. Friedlingstein, S. Moreton, M. J. Amesbury, D. W. Beilman, S. Björck, T. Blyakharchuk, C. Bochicchio, R. K. Booth, J. Bunbury, P. Camill, D. Carless, R. A. Chimner, M. Clifford, E. Cressey, C. Courtney-Mustaphi, F. De Vleeschouwer, R. de Jong, B. Fialkiewicz-Koziel, S. A. Finkelstein, M. Garneau, E. Githumbi, J. Hribjlan, J. Holmquist, P. D. M. Hughes, C. Jones, M. C. Jones, E. Karofeld, E. S. Klein, U. Kokfelt, A. Korhola, T. Lacourse, G. Le Roux, M. Lamentowicz, D. Large, M. Lavoie, J. Loisel, H. Mackay, G. M. MacDonald, M. Makila, G. Magnan, R. Marchant, K. Marcisz, A. Martínez Cortizas, C. Massa, P. Mathijssen, D. Mauquoy, T. Mighall, F. J. G. Mitchell, P. Moss, J. Nichols, P. O. Oksanen, L. Orme, M. S. Packalen, S. Robinson, T. P. Roland, N. K. Sanderson, A. B. K. Sannel, N. Silva-Sánchez, N. Steinberg, G. T. Swindles, T. E. Turner, J. Uglow, M. Väliranta, S. van Bellen,
M. van der Linden, B. van Geel, G. Wang, Z. Yu, J. Zaragoza-Castells, Y. Zhao, Latitudinal limits to the predicted increase of the peatland carbon sink with warming. Nat. Clim.
Chang. 8, 907–913 (2018).
37. K. Regina, A. Budiman, M. H. Greve, A. Grønlund, Å. Kasimir, H. Lehtonen, S. O. Petersen, P. Smith, H. Wösten, GHG mitigation of agricultural peatlands requires coherent policies.
Clim. Policy 16, 522–541 (2016).
38. IPCC, Agriculture, forestry and other land uses, in 2006 IPCC Guidelines for National
Greenhouse Gas Inventories, National Greenhouse Gas Inventories Programme,
H. S. Eggleston, L. Buendia, K. Miwa, T. Ngara, K. Tanabe, Eds, (IGES, 2006).
39. UNFCCC, National Inventory Submissions 2019, Common Reporting Format (CRFs) tables (2019); https://unfccc.int/process-and-meetings/transparency-and-reporting/ reporting-and-review-under-the-convention/greenhouse-gas-inventories-annex-i-parties/national-inventory-submissions-2019 [accessed 11 March 2021].
40. J. Alm, N. J. Shurpali, K. Minkkinen, L. Aro, J. Hytönen, T. Laurila, A. Lohila, M. Maljanen, P. J. Martikainen, P. Mäkiranta, T. Penttilä, S. Saarnio, N. Silvan, E.-S. Tuittila, J. Laine, Emission factors and their uncertainty for the exchange of CO2, CH4 and N2O in Finnish managed peatlands. Boreal Environ. Res. 12, 191–209 (2007).
on June 8, 2021
http://advances.sciencemag.org/
41. B. Tiemeyer, A. Freibauer, E. Albiac, J. Augustin, M. Bechtold, S. Beetz, C. Beyer, M. Ebli, T. Eickenscheidt, S. Fiedler, C. Förster, A. Gensior, M. Giebels, S. Glatzel, J. Heinichen, M. Hoffmann, H. Höper, G. Jurasinski, A. Laggner, K. Leiber-sauheitl, M. Peichl-brak, M. Drösler, A new methodology for organic soils in national greenhouse gas inventories: Data synthesis, derivation and application. Ecol. Indic. 109, 105838 (2020).
42. C. Evans, R. Morrison, A. Burden, J. Williamson, A. Baird, N. Callaghan, P. Chapman, A. Cumming, H. Dean, G. Dooling, J. Evans, V. Gauci, R. Grayson, Y. He, K. Heppell, J. Holden, S. Hughes, J. Kaduk, R. Matthews, N. Menichino, T. Misselbrook, S. Page, G. Pan, M. Peacock, M. Rayment, L. Ridley, I. Robinson, D. Rylett, K. Stanley, F. Worrall, Final report on project SP1210: Lowland peatland systems in England and Wale— Evaluating greenhouse gas fluxes and carbon balances (Centre for Ecology and Hydrology, 2016).
43. FAO, FAOSTAT emissions database (2020); www.fao.org/faostat/en/#data/GC [accessed 11 March 2021].
44. R. S. Truskavetskii, Carbon budget of drained peat bogs in Ukrainian Polesie. Eurasian Soil
Sci. 47, 687–693 (2014).
45. T. Gasser, L. Crepin, Y. Quilcaille, R. A. Houghton, P. Ciais, M. Obersteiner, Historical CO2 emissions from land-use and land-cover change and their uncertainty. Biogeosciences 17, 4075–4101 (2020).
46. D. Gilfillan, G. Marland, T. Boden, R. Andres, Global, Regional, and National Fossil-Fuel CO2 Emissions (2021); https://energy.appstate.edu/CDIAC [accessed 11 March 2021]. 47. E. Dlugokencky, P. Tans, Trends in atmospheric carbon dioxide, National Oceanic &
Atmospheric Administration, Earth System Research Laboratory (NOAA/ESRL) (2021); www.esrl.noaa.gov/gmd/ccgg/trends/ [accessed 11 March 2021].
48. L. Elsgaard, C. Görres, C. Christian, G. Blicher-mathiesen, K. Schelde, S. O. Petersen, Net ecosystem exchange of CO2 and carbon balance for eight temperate organic soils under agricultural management. Agric. Ecosyst. Environ. 162, 52–67 (2012).
49. T. P. Kandel, P. E. Lærke, L. Elsgaard, Annual emissions of CO2, CH4 and N2O from a temperate peat bog: Comparison of an undrained and four drained sites under permanent grass and arable crop rotations with cereals and potato. Agric. For. Meteorol.
256–257, 470–481 (2018).
50. Y. Wen, H. Zang, Q. Ma, B. Freeman, D. R. Chadwick, C. D. Evans, D. L. Jones, Impact of water table levels and winter cover crops on greenhouse gas emissions from cultivated peat soils. Sci. Total Environ. 719, 135130 (2019).
51. M. Matysek, J. Leake, S. Banwart, I. Johnson, S. Page, J. Kaduk, A. Smalley, A. Cumming, D. Zona, Impact of fertiliser, water table, and warming on celery yield and CO2 and CH4 emissions from fenland agricultural peat. Sci. Total Environ. 667, 179–190 (2019). 52. P. Mäkiranta, J. Hytönen, L. Aro, M. Maljanen, M. Pihlatie, H. Potila, N. J. Shurpali,
J. Laine, A. Lohila, P. J. Martikainen, K. Minkkinen, Soil greenhouse gas emissions from afforested organic soil croplands and cutaway peatlands. Boreal Environ. Res. 12, 159–175 (2007).
53. H. V. Cooper, S. Evers, P. Aplin, N. Crout, M. Puat, B. Dahalan, S. Sjogersten, Greenhouse gas emissions resulting from conversion of peat swamp forest to oil palm plantation.
Nat. Commun. 11, 407 (2020).
54. J. Miettinen, A. Hooijer, R. Vernimmen, S. C. Liew, S. E. Page, From carbon sink to carbon source: Extensive peat oxidation in insular Southeast Asia since 1990. Environ. Res. Lett.
12, 024014 (2017).
55. M. Guimberteau, D. Zhu, F. Maignan, Y. Huang, Y. Chao, S. Dantec-Nédélec, C. Ottlé, A. Jornet-Puig, A. Bastos, P. Laurent, D. Goll, S. Bowring, J. Chang, B. Guenet, M. Tifafi, S. Peng, G. Krinner, A. Ducharne, F. Wang, T. Wang, ORCHIDEE-MICT (v8.4.1), a land surface model for the high latitudes: Model description and validation. Geosci. Model Dev.
11, 121–163 (2018).
56. G. Krinner, N. Viovy, N. de Noblet-Ducoudré, J. Ogée, J. Polcher, P. Friedlingstein, P. Ciais, S. Sitch, I. C. Prentice, I. Colin, A dynamic global vegetation model for studies of the coupled atmosphere-biosphere system. Global Biogeochem. Cycles 19, GB1015 (2005).
57. B. D. Stocker, R. Spahni, F. Joos, DYPTOP: A cost-efficient TOPMODEL implementation to simulate sub-grid spatio-temporal dynamics of global wetlands and peatlands.
Geosci. Model Dev. 7, 3089–3110 (2014).
58. W. J. Parton, J. W. B. Stewart, C. V. Cole, Dynamics of C, N, P and S in grassland soils: A model. Biogeochemistry. 5, 109–131 (1988).
59. C. Bader, M. Müller, R. Schulin, J. Leifeld, Peat decomposability in managed organic soils in relation to land use, organic matter composition and temperature. Biogeosciences 15, 703–719 (2018).
60. S. Glenn, A. Heyes, T. Moore, Carbon dioxide and methane fluxes from drained peat soils, southern Quebec. Global Biogeochem. Cycles 7, 247–257 (1993).
61. A. Säurich, B. Tiemeyer, A. Don, S. Fiedler, M. Bechtold, W. Amelung, A. Freibauer, Drained organic soils under agriculture—The more degraded the soil the higher the specific basal respiration. Geoderma 355, 113911 (2019).
62. S. a. Marcott, J. D. Shakun, P. U. Clark, A. C. Mix, A reconstruction of regional and global temperature for the past 11,300 years. Science 339, 1198–1201 (2013).
63. R. W. Tiner Jr., Wetlands of the United States: Current Status and Recent Trends (United States Fish and Wildlife Service, 1984).
64. J. Wolf, T. O. West, Y. L. Le Page, G. Kyle, X. Zhang, G. J. Collatz, M. L. Imhoff, CMS: Carbon Fluxes from Global Agricultural Production and Consumption, 2005–2011. ORNL DAAC, Oak Ridge, Tennessee, USA (2015).
65. C. Le Quéré, R. M. Andrew, P. Friedlingstein, S. Sitch, J. Pongratz, A. C. Manning, J. Ivar Korsbakken, G. P. Peters, J. G. Canadell, R. B. Jackson, T. A. Boden, P. P. Tans, O. D. Andrews, V. K. Arora, D. C. E. Bakker, L. Barbero, M. Becker, R. A. Betts, L. Bopp, F. Chevallier, L. P. Chini, P. Ciais, C. E. Cosca, J. Cross, K. Currie, T. Gasser, I. Harris, J. Hauck, V. Haverd, R. A. Houghton, C. W. Hunt, G. Hurtt, T. Ilyina, A. K. Jain, E. Kato, M. Kautz, R. F. Keeling, K. Klein Goldewijk, A. Körtzinger, P. Landschützer, N. Lefèvre, A. Lenton, S. Lienert, I. Lima, D. Lombardozzi, N. Metzl, F. Millero, P. M. S. Monteiro, D. R. Munro, J. E. M. S. Nabel, S. I. Nakaoka, Y. Nojiri, X. Antonio Padin, A. Peregon, B. Pfeil, D. Pierrot, B. Poulter, G. Rehder, J. Reimer, C. Rödenbeck, J. Schwinger, R. Séférian, I. Skjelvan, B. D. Stocker, H. Tian, B. Tilbrook, F. N. Tubiello, I. T. V. Laan-Luijkx, G. R. V. Werf, S. Van Heuven, N. Viovy, N. Vuichard, A. P. Walker, A. J. Watson, A. J. Wiltshire, S. Zaehle, D. Zhu, Global carbon budget 2017. Earth Syst. Sci. Data 10, 405–448 (2018).
66. FAO, Global Forest Resources Assessment 2015, Desk Reference (2015); www.fao.org/3/a-i4808e.pdf [accessed 11 March 2021]].
67. J. Couwenberg, Emission Factors for Managed Peat Soils: An Analysis of IPCC Default Values (Wetlands International, 2009).
68. S. O. Petersen, C. C. Hoffmann, C.-M. Schäfer, G. Blicher-Mathiesen, L. Elsgaard, K. Kristensen, S. E. Larsen, S. B. Torp, M. H. Greve, Annual emissions of CH4 and N2O, and ecosystem respiration, from eight organic soils in Western Denmark managed by agriculture. Biogeosciences 9, 403–422 (2012).
69. M. Drösler, W. Adelmann, J. Augustin, L. Bergmann, C. Beyer, B. Chojnicki, C. Förster, A. Freibauer, M. Giebels, S. Görlitz, Klimaschutz durch Moorschutz. Schlussbericht des Vorhabens" Klimaschutz-Moornutzungsstrategien" 2006–2010. Tech. Univ. München, V.
(Ed.), München, 201 (2013).
70. C. Beyer, H. Liebersbach, H. Höper, Multiyear greenhouse gas flux measurements on a temperate fen soil used for cropland or grassland. J. Plant Nutr. Soil Sci. 178, 99–111 (2015).
71. S. Koszinski, B. A. Miller, W. Hierold, H. Haelbich, M. Sommer, Spatial modeling of organic carbon in degraded peatland soils of northeast Germany. Soil Sci. Soc. Am. J. 79, 1496–1508 (2015).
72. M. Hahn-Schöfl, thesis, Gottfried Wilhelm Leibniz Universität Hannover (2015). 73. Å. Kasimir-Klemedtsson, L. Klemdtsson, K. Berglund, P. Martikainen, J. Silvola, O. Oenema,
Greenhouse gas emissions from farmed organic soils: A review. Soil Use Manage. 13, 245–250 (1997).
74. K. Berglund, Ytsänkning på mosstorvjord: Sammanställning av material från Lidhult,
Jönköpings län (Sveriges lantbruksuniversitet, 1989).
75. J. Leifeld, M. Müller, J. Fuhrer, Peatland subsidence and carbon loss from drained temperate fens. Soil Use Manage. 27, 170–176 (2011).
76. M. Maljanen, P. J. Martikainen, J. Walden, J. Silvola, CO2 exchange in an organic field growing barley or grass in eastern Finland. Glob. Chang. Biol. 7, 679–692 (2001).
77. M. Maljanen, A. Liikanen, J. Silvola, P. J. Martikainen, Methane fluxes on agricultural and forested boreal organic soils. Soil Use Manage. 19, 73–79 (2003).
78. M. Maljanen, V.-M. Komulainen, J. Hytönen, P. J. Martikainen, J. Laine, Carbon dioxide, nitrous oxide and methane dynamics in boreal organic agricultural soils with different soil characteristics. Soil Biol. Biochem. 36, 1801–1808 (2004).
79. M. Maljanen, J. Hytönen, P. Mäkiranta, J. Alm, K. Minkkinen, J. Laine, P. J. Martikainen, Greenhouse gas emissions from cultivated and abandoned organic croplands in Finland.
Boreal Environ. Res. 12, 133–140 (2007).
80. A. Lohila, M. Aurela, J. Tuovinen, T. Laurila, Annual CO2 exchange of a peat field growing spring barley or perennial forage grass. J. Geophys. Res. Atmos. 109, D18116 (2004).
81. R. Morrison, A. M. J. Cumming, H. E. Taft, J. Kaduk, S. E. Page, D. L. Jones, R. J. Harding, H. Balzer, Carbon dioxide fluxes at an intensively cultivated temperate lowland peatland in the East Anglian Fens, UK. Biogeosciences 10, 4193–4223 (2013).
Acknowledgments: We would like to thank L. Elsgaard, S. O. Petersen, E. M. Veenendaal,
H. E. Taft, and D. L. Jones for providing the information about the history of agricultural used peatland sites. Funding: This work benefited from the French state aid managed by the ANR under the “Investissements d’avenir” programme with the reference ANR-16-CONV-0003 and from the European Research Council Synergy project SyG-2013-610028 IMBALANCE-P. Simulations were performed using HPC resources from GENCI-TGCC (grant 2020-A0070106328). The data contributed by A.V.G.-S. and D.J.C were obtained with funds from the Natural Environment Research Council (NERC standard grant number NE/I012915/1).
Author contributions: P.C. and C.Q. designed the study. C.Q. developed the ORCHIDEE-PEAT
on June 8, 2021
http://advances.sciencemag.org/
model and performed the simulations. S.P., A.M.R.P., A.V.G.-S., D.J.C., and S.C.B. contributed the data. C.Q. and P.C. drafted the manuscript, and all authors contributed to the interpretation of the results and the draft revision. Competing interests: The authors declare that they have no competing interests. Data and materials availability: All data needed to evaluate the conclusions in the paper are present in the paper and/or the Supplementary Materials. The outputs from the model simulations are freely available for download at https://sharebox.lsce. ipsl.fr/index.php/s/pcdrF8sA250OAwU. Additional data related to this paper may be requested from the authors.
Submitted 18 October 2020 Accepted 21 April 2021 Published 4 June 2021 10.1126/sciadv.abf1332
Citation: C. Qiu, P. Ciais, D. Zhu, B. Guenet, S. Peng, A. M. R. Petrescu, R. Lauerwald, D. Makowski, A. V. Gallego-Sala, D. J. Charman, S. C. Brewer, Large historical carbon emissions from cultivated northern peatlands. Sci. Adv. 7, eabf1332 (2021).
on June 8, 2021
http://advances.sciencemag.org/
DOI: 10.1126/sciadv.abf1332 (23), eabf1332. 7
Sci Adv
ARTICLE TOOLS http://advances.sciencemag.org/content/7/23/eabf1332
MATERIALS
SUPPLEMENTARY http://advances.sciencemag.org/content/suppl/2021/05/28/7.23.eabf1332.DC1
REFERENCES
http://advances.sciencemag.org/content/7/23/eabf1332#BIBL
This article cites 62 articles, 1 of which you can access for free
PERMISSIONS http://www.sciencemag.org/help/reprints-and-permissions
Terms of Service
Use of this article is subject to the
is a registered trademark of AAAS.
Science Advances
York Avenue NW, Washington, DC 20005. The title
(ISSN 2375-2548) is published by the American Association for the Advancement of Science, 1200 New
Science Advances
License 4.0 (CC BY-NC).
Science. No claim to original U.S. Government Works. Distributed under a Creative Commons Attribution NonCommercial Copyright © 2021 The Authors, some rights reserved; exclusive licensee American Association for the Advancement of
on June 8, 2021
http://advances.sciencemag.org/