Publisher’s version / Version de l'éditeur: Building Practice Note, 1981-05-01
READ THESE TERMS AND CONDITIONS CAREFULLY BEFORE USING THIS WEBSITE.
https://nrc-publications.canada.ca/eng/copyright
Vous avez des questions? Nous pouvons vous aider. Pour communiquer directement avec un auteur, consultez la
première page de la revue dans laquelle son article a été publié afin de trouver ses coordonnées. Si vous n’arrivez pas à les repérer, communiquez avec nous à PublicationsArchive-ArchivesPublications@nrc-cnrc.gc.ca.
Questions? Contact the NRC Publications Archive team at
PublicationsArchive-ArchivesPublications@nrc-cnrc.gc.ca. If you wish to email the authors directly, please see the first page of the publication for their contact information.
NRC Publications Archive
Archives des publications du CNRC
For the publisher’s version, please access the DOI link below./ Pour consulter la version de l’éditeur, utilisez le lien DOI ci-dessous.
https://doi.org/10.4224/20386493
Access and use of this website and the material on it are subject to the Terms and Conditions set forth at Estimating energy savings from reinsulating houses
Quirouette, R. L.; Scheuneman, E. C.
https://publications-cnrc.canada.ca/fra/droits
L’accès à ce site Web et l’utilisation de son contenu sont assujettis aux conditions présentées dans le site LISEZ CES CONDITIONS ATTENTIVEMENT AVANT D’UTILISER CE SITE WEB.
NRC Publications Record / Notice d'Archives des publications de CNRC:
https://nrc-publications.canada.ca/eng/view/object/?id=1d7f67b6-eec0-40aa-8cca-8e4d4d29f535 https://publications-cnrc.canada.ca/fra/voir/objet/?id=1d7f67b6-eec0-40aa-8cca-8e4d4d29f535
ISSN 0701-5216 Ref Ser
BUILDING
PRACTICE
NOTE
ESTIMATING ENERGY SAVINGS FRCM REIPlSULATISG HOUSES
by
Preface
This paper presents a method for estimating energy savings from reinsulating huuses. The method uses the previous year's fuel
b i l l and is aimed at existing houses; i t . i s not intended for use
i n the design of new houses. As further information becomes
available, some of the factors and tables may be revised. The Division of Building Research welcomes comments.
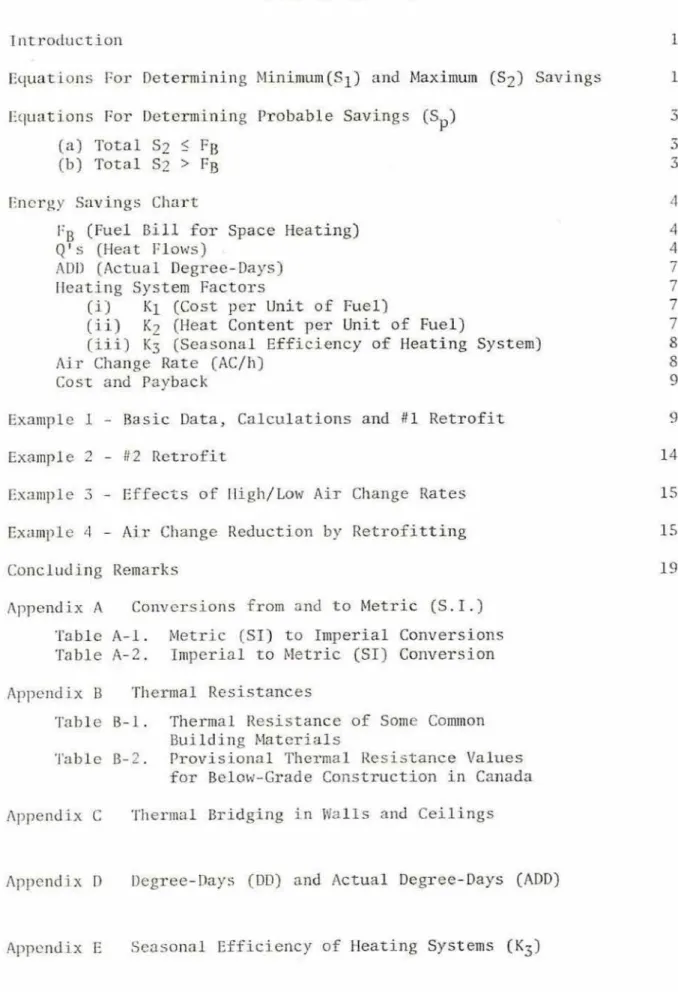
TABLE OF CONTENTS Introduction
Equations For Determining Minimw(S1] and Maximum IS2) Savings
Equations For Determining Probable Savings [S
P
1
(a] Total $2 I Fg (b) Total $2 2 FB Energy Savings Chart
FB [Fuel Bill for Space Heating)
Q f s (Heat F l a w s ) ,
ADD (Actual Degree-Days)
Heating System Factors
(i) R1 [Cost: per Unit of Fuel]
(ii) K2 (Heat Content p e r Untt sf Fuel]
(iii] K3 [Seasonal Efficiency of Heating System]
A i r Change Rate [AC/h)
COST and Payback
Example 1 - Basic Data, Calculations and #1 Retrofit Example 2 - #2 Retrofit
Example 3
-
Effeczs of Highflow Air Change Rates Example 4-
A i r Change Reduction by RetrofittingConcluding Renarks
Appendix A Conversioris from arid to Metric ( S . I . ) Table A-1. Metric (SI') to Tmperial Conversions
Table A - 2 . Imperial to Metric (SI) Conversion Appendix B Thermal, Resistances
Table B - 1 , Thermal Resistance of S m e Common
Building Materials
Table B - 2 . Provisional Thermal Resistance Values
for Belaw-Grade Construction in Canada Appendix C Thermal Bridging in Walls and: Ceilings
Appendix I1 Degree-Days
(DD)
and Actual Degree-Days (ADD)ESTIMATING ENERGY SAVINGS FROM REINSUMTING HOUSES by
R . L . Quirouette and. E.C. Scheuneman
INTRODUCTION
This Note presents a method of estimating the savings from
adding more insulation (reinsulating) t a an existing house as well as
a means f o ~ determining the payback period rrf particular rezrofit measures. It is a development of the methodology originated by
R . L . Quirouette for the Division of Building Research 1978 Seminar/ Workshop
-
Insulgting Existing Houses.The most common way to estimate energy savings due to
reinsulation i s termed the "degree-day (DD) method . I t It uses a
single coefficient to account for the effect of occupancy-generated heat g a i n s , solar heat gains through windows, and thermal storage effect. Because the combined effects of these conditions can vary
so widely even in i d e n t i c a l houses, the prediction of energy
consumption can and does vary widely from actual fuel records. Hence,
savings predicted by this method are subject t o important uncertainties
.
The energy saved by reinsulating a particular house can be
determined w i t h greater confidence hy using the previous year's fuel b i l l and an estimate of the "actual degree-days (ADD)" to calculate
a range of energy savings by identifying the m i n i m and maximum values that may be obtained from particular retrofit measures.. S i n c e
t h e actual savings will l i e between the min3mum and maximum l i m i t s ,
a further calculation termed ''probable savingsq' i s introduced to facilitate the economic analysis t h a t fallows.
Tho application of t h i s method is explained in detail in m his Note; t h e rheory is l e f t for another paper t o be published as a DBR Building Research Nate. A companion publication to t h i s paper will provide the user w i t h a computer program for hand-held computers.
EQUATIONS FOR DETERMINING MIPITMUM (S1) AbiI) MAXEMUM (SZ) SAVINGS The mlnirnum and maximum savings are firm t h e m e t i c a l limits although t h e accuracy of the predictions depends an the accuracy of the information obtained. The following f o m l a e apply to both metric
The fallowing equatioo is used to calculate
-
S1, t h e minimum savings.where S1 = minimum savings in dollars per heating season for each upgraded building component
F = t h e previous year's fuel b i l l far space heating
I3
Q1 = original heat flow through each building component
Q2 = new heat flow through each building component being
upgraded
T o t a l Ql = the sum of a l l the Q l t s
The following equation is used to calculate S2, t h e maximurn
savings. I S2 = 86,400 x ADD x K2 K3 x
(Q,
-Q21
1 S2 = 24 x ADD x x (Q1 -Q2Y
K2'(metric SI units)
I23
(imperial units) (31
where S 2 = maximum savings in dollars per heating season
86,400 = number of seconds in a day to correspond to Juule/second 24 = number of hours in a day to co.mespond to Btufhour
ADD = actual degree-days
K,
= c o s t of fuel per unit at same price as used for fuel b i l l ,K2 = heat content of fuel per unit
K3 = seasonal efficiency of heating planf
QI
-
original heat flow through each building component Q2 = new h+at f l o w through each building component beingEQUATIONS FOR DETERMINING PROBABLE SAVINGS (SD)
I'OT those users wanting
an
estimate of probable savings a furthercalculation i s provided which is subject t o two conditional equations. These equations estimate where the savings l i e between the minimum and
maximum l j m i t s , This technique is a new theoretical treatment and, therefore, may be subject to modification after further experience. (a) 'rota1 S2 2 FB
Whcn tho total of the maximum savings ( S 2 I s ) is less than or equal to the previous year's fuel bill (F B
3 ,
uset o calculate the component probable savings [S Is).
P
(h) 'Ibtal S2 > FB
Wllcrl the Total of the S Z r s i s greater than
FB,
there are two ways( i ) I f all the r e t r o f i t options from t h i s Total S2 - package a r e going to 1)e done, usc t h e formula
T o t a l S = Total S1 + 0r75 (FB
-
T o t a l S1)P
n ~ ~ d do not calculate t h e component S p l s which are not required since
i t i s the s a v i n g s of t h e entire retrofit package that is of i n t e r e s t .
( i i ) I f only certain retrofit options from this Total S 2 package ~ T C g o i n g tn b e done, calculate the new lower Total $2 fur these ootjons and coinpare t h e Total S2 to FB.
I f Tota 1 S2 s FB , use pmcedure ( a ) above.
I f 'Total S2 r F B , use procedure (b) (I) above.
Note: TIlc c o n d i t i o n of section (b), Total. S2 > FB, will - not occur
o f t e n . IIowevcr, it could happen when making major retrofits an
b u i l d i n g s t h a t have a high proportion of internal and free heat gains r c l i l t i v c to their t o t a l heat loss. Highly insulated and passive-solar
l~ccltcrl hui l d ings couid fall into this category. Further explanations w i l l I)c given in the theoretical pape-r.
ENERGY SAVINGS CHART
The chart on the following two pages (charts I A and IB) has been developed to facilitate the presentatim o f the house character-
istics and t h e analysis of the data and results for
use in
energyaudit work. One is for metric SI units and the other for imperial units. The different p a r t s ofthe S1 and S2 equations and this chart are discussed in general terns before an example calculatiun and analysis is carried out for a particular house. The calculations in this pager u s e metric SI units. For calculations in imperial units
conversion t a b l e s are given in Appendix A. FB (Fuel Bill for Space Heating)
This cast should b e determined from the previous year's fuel
b i l l s over a 12-month period, usually spring-to-spring or fall-to-fall. In cases where t h e same fuel is used for space heating and other uses such as appliances and water heating, it will be necessary to separate out the non-space heating casts. This is done by t a k i n g the average of the monthly f u e l bills during the non-heating months (usually June
through September], multiplying by 12, arid subtracting this amount from
t h e t o t a l twelve-month fuel bill.
, Q ' S (Heat F l a w 1
This is the amount of heat per unit of t i m e per degree of
temperature difference t h a t flows through a building component. It is
defined ttnd calculated by t h e equation
where A = area of the component
R
= thermal resistance of the componentBoth of these quantities, A and R, musz be measured andlor calculated f i r s t before Q can be calculated.
The heat flow [lqss) due to air change is calculated by using t h e formula
Q = 0.361 x AC/h x Vol (Q = 0.0183 x AC/h x Vol for imperial u n i t s ] where A C / ~ ( a i r change per hour) is explained in a fallowing section;
Vol i s t h e volume of heated space in the house.
(i) A
(area
of component]Areas are measured and calculated from the external house
dimensions. Window and door opening areas a r e detefmind f r o m the gross openings (the component plus its frame).
H A R T
N O .I A
E N E R G Y
S A V I N G S
C H A R T
( ' m e t r i c S f u n i t s . )A M E TYPE OF HOUSE INTERIOR TEMP. ( f , )
VOLUME OF H E A T E D S P A C E u D D R E S S
-
D E G R E E - D A Y S ( O D ) H E A T I N G S Y S T E M A I R C H A N E E ~ ~ (NO.) I T Y PROV HOT W A T E R H E A T I N G FUEL - B I L L , F g =-
K 2-
I Q 1-
Q 2 1 5' = f x 1 B T O T A L B , A D D s D D+
[T,-
1s) x b = 1 N O . 1 2 3 4 5 6 T O T A L S 2<
F B { a ) S=
5 t0.75 [ S 2 - S ) P 1 1 B U I L D I N G C O M P O N E N T TOTAL s 2 F a PREVIOUS YEAR 7 I F T O T A L 5 = TOTAL 5 $ 0 . 7 5 (F-
TOTAL S , , ) P 1 0 R E T R O F I T 8 9 10 1 1 12.
-
A-q
A 1AIR CHANGE, Q = 0.36 1 x V d . x Na,
TOTAL 5 z
--
c/s 5 P s 1 2 NO.c
A Q= -
R 2 NO.H A R T NO.
I B
E N E R G Y S A V I N G S C H A R T
( i m p e r i a l s n i t . 5 ) J A M E T Y P E OF H O U S E IP4TERI.OR TEMP. ( T . ) VOLUME OF H E A T € D S P A C E hDDRESS-
D f G R E E - D A Y S ( D D ) HEAT1 N G SYSTEM AIR CHANGE;^ { N o . ) ; I T Y P R O V H O T W A T E R H E A T I N G F U E L B I L L , F B = = 2 A D D = D D+
( T , - 6 5 ) x b = I 1 S 2=
2 4 y A D D x x ( Q ,-
Q 2 ) K 2 N U 1 2 3 4 5 6 7 8 9 10 1 1 1 2 " T O T A L S 2<
f B B U I L D I N G COMPONENTAIR CHANGE, Q=0.0183 x Val. ~ N O .
TOTAL 5 =
s
+0.75 ( S '5,) P 1 2 T O T A L S 2>
F B P R E V I O U S YEAR T O T A L 5 = T O T A L 5 + 0 . 7 5 ( F-
T O T A L S 1 ) P 1 0 R E TROFIT A-
-
-
-
-1 No. C 5 P-
-
-
-
--
A- q
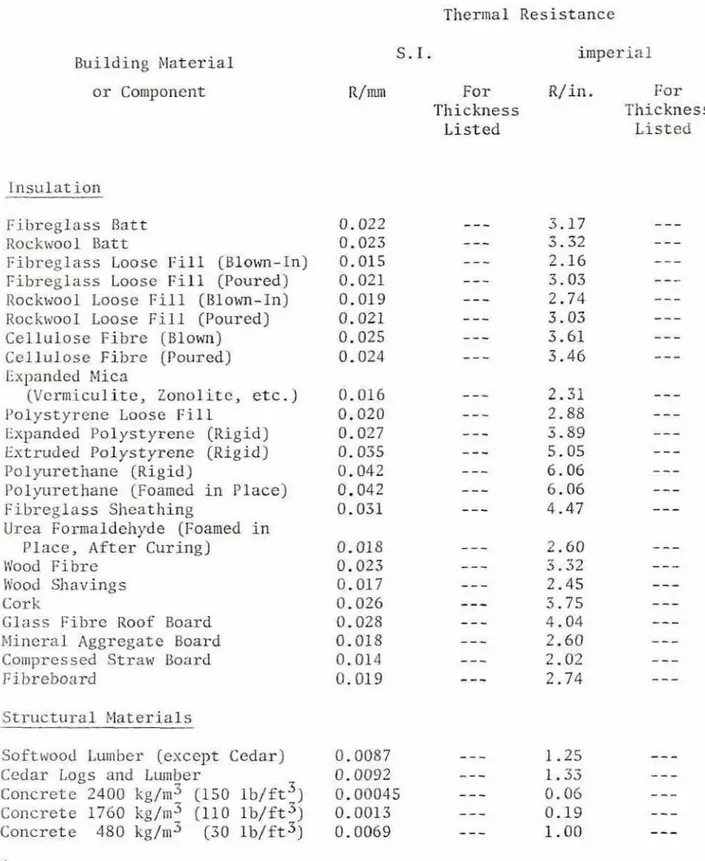
2 51 i s N o , 1 A 0 = - R 2 5 2( ii) R-values (.Thermal Resistances )
To determine nominal R-values for building components such as walls, ceilings and windows, tne Individual R-values of the materials
mxk i ng up the building component (including the appropriate R-values f a r ;In i ~ ~ t e r i o r and exterior a i r film) are added up. A list of thermal
resistances, It-values, for building materials and a i r filmslspaces is
g i v e n in Table 3-1 (Appendix 0 ) .
Below-grade construction such as basements require special
treatment- This is explained in Appendix
B
w i t h Table B-2 providing R-values f o r typical constructions.Par improved accuracy of R-value calculations, t h e "thermal
bridging effect3' described in Appendix C should be t a k e n into account.
ADD { A c t u a l Degree-Davsl
This method uses ADD [actual degree-days) to calculate savings.
ADD i s a measure of the actual temperature difference between the
interior house temperatufe
(Ti)
and the outdoor tempmature. This i sd i f f e r e n t from standard DO (degree-days] which are computkd from a base interior temperature of l8oC (650F). The concept and calculation
of RLfn arc given i n AppendSx D.
kfcating System F a c t o r s
The determination a f m a x i m savings, 52, requires certain h e a t i n g system factors. These factors which characterize the
pe~formance of the heating system are the cost af f u e l
[KI),
t h e heatc o n t e n t of f u e l (K2), and the seasonal efficiency {K3].
(i) K 1 (Cost per Unit or Fuel]
This constant is the price in dollars per unit of fuel used.
The price used should be t h e same a s t h a t used for the fuel bill, The
normal u n i t s would be as follows:
Fuel o i l (domestic) $ / l i t r e
Na,tural gas
$/d
Electricity $/kW-h
[ii) K 2 (Heat Content per .Unit of Fuel)
These values of t h e heat content for different fuels are given i n Table 1 . It should be noted t h a t the same fuel unit must be used for both K1 and
K2.
For example, if $/litre is used inK1,
than'TABLE 1. HEATING VALUE OF SOME GQMMDN HEATING FUELS
Fuel oil (domestic) Natural gas
E l e c t r i c i t y
38 757 OQO per Litre 37 300 000 per rn3
3 600 000 per kWhh
167
aoo
per
gal1 000 per ft3 3 413 per kW*h [iii) KJ (Seasonal Efficiency of Heating System)
T h i s is the
factor
t h a z determ3nes the useful heat delivered to t h e house from the ppten-tiaf amount of heat in the f u e l used during t h e heating seasan- A f u r t h e r explanation will be f u n d i n Appendix E , Air Change Rate [air changef
hour, ACJh]Estinsarfng the air leakage rate is a complicated task t h a t involves
an analysis of the effect
of
wind conditions and the stack effect pressures on t h e leakage open5ngsof
a house. Even then the results of this analysis are aften too simplistic since the actual air leakagepateerns and rate4 are alteTed by operational characteristics such as the opening and closing of windgws
and
doors, and the aperation off i r e p h c e s , fuel-burning appliances, and exhaust fans.
It is general1y accepted that there is a relationship between rhr: indoor r e l a t i v e Iwmiclicy during the heatinj! season and the air leakage rate of a small house If it is occupied and no mechanical humidification is used. If the information in the paragraph that
follaws i,s nut available, the value 1.00 air c h a n g e l h w ~ may be used as a 'tdefauZttl at ".best guessi* value.
The January and February indoor relative humidity [ R . H . ) can
b c approximately correlated to air change rates a s follows:
- 15 to 25% R.H. as measured or indicated by dryness in the occupant's nose and thsoat or vfshockstt from s t a t i c electricity would
suggest an a3r change rate
of
1,SO/h or higher.-
a
5
as measure6 or indicated by slight condensa3ionon double-glazed windows would suggest an air change rate of 0.75)h.
- 3 5 1 and hipher
R.H.
as measured or indicated by frost onwindaws for long periods a& mildewlfungus growth on organic materials
would suggest an a i r change rate of 0,25/h or less. (This may occur
i n some electrically-hasted homes because the absence of chimneys makas
them generally tighter than houses with fuel-fired heating systems,)
Since there i s uncertainty in estimating an a i r change rate, iz
may be preferable to estimate a high and low rate
t o
g i v e a rangeof
v a l u e selected above. This provides a reasonable margin of error and
can be used to illustrate the influence of a i r change rates
on
thepredicted savings,
Applying the high/low range to these values would yield the following:
- 1 .{)I)/ I1 tra~~s-Forms t o 1.50 and 0.50
- 1 . 5 0 / h transfams to 2 - 2 5 and 0.75
-
0.75/h transforms to 1 . 1 3 and 0.38- 0.25/h transfams to 0-58 and 0-13
Cost and Payback
The cost for each retrofit action may vary considerably depending
on who is doing the work (homeowner or contractor). Also, some
material costs may be significantly reduced by government grant
programs.
This simplified payback calculation,
Payback = Costs =
-
C [years] Savings Sassumes thax the fuel p r i c e escalation is approximately the same as t h e interest rate on savtngs. Any significant c o s t reductions, as in the
preceding paragraph, would provide shorter payback periods. EXAMPLE 1. - BASIC DATA CALCULATIONS AND #1 RETROFIT
Location ;
Type of House:
Volume of Heated Space:
Heating System: Ilot Water Heating: I:ucl B i l l , FB =
Cost per Unit of Fuel,
K1
=Ottawa
two-storey, detached
481.4 m3
ail-fired, farced warm air
electric
$1239 [for 5682 l i t r e )
Step 1 - Basic House Data
- The basic data from above i s entered on to the t o p of chart 2
( r ~ e x t page)
-
S t e p 2
-
Climate and A i r Change-
The climate and air change section at t h e t a p of c h a r t 2 i sf i l l e d in as follows:
-
nD for Ottawa is 4674- A i r change/hour was chosen to be the default value of l.OO/h since we
had no further informatian
- KZ for a i l from Table 1 is 38 757 000
C H A R T
NO.
2
E N E R G Y
S A V I N G S
C H A R T
( m e t r i c S I u n i t s ) N A M E T Y P E O F HOUSE J - s ~ Q ~ ~ Y , d ~ k c L ~ & I N T E R I O R T E M P . ( f a )a /
O C 3 1 A D D R E S S-
VOLUME OF H E A T E D SPACE Y Q I . 4 m H E A T I N G S Y S T E M ~ ~ I - C ~ ~ a \r
DEGREE - D A Y S ( O D ) q &7q
C I T Y
o m &
W H PRoVON^
HOT W A T E l H E A T I N G :?cL'p;? >AIR C H A N G E / h (No.) 1. 6 6F U E L B I L L , F =
*
l a 3 4 B K 2 = 3 S ;7 5
7, nnfi K l =*
0 , a \ g / 1 ; 4 r e K 3 0 . 5 5 A D D=
O D+
( T-
1B) x b = 4 L 7 4 i+
(a1
-
1d
.
ilpl= 5 / 5 7
I S = 8 6 , 4 0 0 x A D D x 2 K 2 x K k ( Q l-
Q 2 ) 3 TOTAL S 2<
P B (a 1 5 = 5 + 0 . 7 5 ( 5 2 - 5 1 ) P 1 T O T A L 5 = T O T A L 1,+
0 . 7 5 / F - T O T A L E l ) P 0S t c ~ l 3 - Bui l d i n g C m o n e n t s and Areas
-
List a l l the building cmpon~nts th a t make up the b u i l d h gc r ~ v c l o p e , e.g. ceiling, frame walls, header joists, basement walls above grade [A.G.) and below grade [B.G.], basement floor, windows, exterior doors.
-
Ihe area of each component is entered in column A of Chart 2.Note t h a t the areas of the windows and d m r s should be subtracted from
t h e appropriate gross wall areas to give the net wall areas.
-
E : ~ c h building component has an R-value. Calculate the R-valueso f matc.rials from Table E - 1 (Appendix B) and then sum these up for the component R-value,
- For the basement walls below grade and basement floor ane uses
Table £3-2 (Appendix
B).
- Exterior doors constructed of solid-core wood w i t h a storm door I~gve an R of 0.70.
-
R-values are written in the R 1 calum of chart 2.- A C / ~ (No.) is written i n the R 1 column o f row X I .
Step 5 - Heat Flaw, Q1
- Thc Q1 c ~ l w n n of chart
2
is f i l l e d by dividing each A by itsrcspcctive R1.
- The Ql EQT a i r change i s calculated by using the formula
QI = 0.361 x AC/h x Vol - QI values are rounded to the nearest u n i t .
-
The t o t a l Ql is calculated by addjng up the individual Q l l s .This r e s u l t is entered in the Total row of the Q1 column. S t e n 6 - Selection of Retrofit ODtions
By examining the figures in column QI, one notes t h e r e l a t i v e
im~mrtance of each building component regarding heat l o s s Q The
lurgcr the number, the greater the heat loss. In this case, air change contributes the greatest heat loss followed by frame walls,
basement walls above grade, basement walls below grade, windows, ceiling,
header j o i s t s , baseruent floor, and doors
.
One usually concentrates an t h e areas o r components of greatest heat loss since these p ~ e s e n t the grcatcst p o t e n t i a l for overall savings. Sometimes the areas of smallerh e a t loss will be the easiest and cheapest to retrofit. There are o t h e r factors to consider including t h e physical f e a s i b i l i t y of each
As the llurpase a€ t h i s
paper
is t n assist one i n esti-rrtating rhesuvj 11gs and payback fur different retrofit options, t h e for lowing rctrof i t
actianr; have been e~nlua-ted:
Ceiling, from RI = 2-11 Co
R2
=
5.64, C a s t (C) = $280Vramr: w a l l s , from €41 = 1.76 to R2 = 2 - 2 9 , C o s t [C) = $110fl
Basernenx walls A.G., from
R1
= 0.26 t o R2 = 2.47Basement walls
B.G.,
fromRl
= Q . 8 toR2
= 3.2 Cost ( C ) = $900Sxep 7 - R z Values and Cost [C)
- The R2's from Step 6 are t h e cmbine-d R-value of the original
R
p l u s the added insulation arid are written
in
t h e appropfiaterows
in t h e G a column of chart 2 while leaving t h e remaining rows blank. Thissection should be l a b e l l e d f l Retrofit to avoid confusion with d i f f e r ~ n t calculations t h a t nay be done later fm the same, house.
- The C t s from Step 7 m e written in the app~opriate rows in the C
column o f t h e #I Retrofit section, and added up to give the Total C.
-
The Q2 for each R2 of chart 2 is calculated by dividing each Ahy jt-I; R2 and r~undsng t o the nearest unit.
Stcn 9 - Calculation
of
M i n i m Savings, SI-
The S l ' s are calculated for each upgraded component of chart 2 by using t h e fmmula:-
The S i r s are added and the result entered in the Total raw.S t e p 1 0
-
Calculation of Maximum Savings, S2-
Tho S Z t s are calculatbd for each upgraded component of chart 2hy using t h e formula
52 = 86 400
z
ADD x K1 X(91
- 42) K3Wc know a l l the values in the S2 equation except for ADD, The value for
AD11 is calculated as
-AD11 = 4b74 + (21
-
18) x 161 = 5157 whwe b =. 161. from Figure 8-1 capp. I>],- Since 86 400 x ADD x
K1
remains the same £OT each parxicularK2 x K3
house i f no change occurs to the heating system, it i s convenient to c t l l c u l a l c t h i s constanT once as follows
and write it i n t o t h e blank of the S2 equation on chart 2 (bottom left). This s i m p l i f i e d form, S2 = 4.557 x (QI
-
Q2], can be used to calculate all the various Szrs.- t h e S Z V s a r e calculated for the upgraded 92's.
- the SZ1s are added and t h e result entered in the Total r o w .
Step 11 - Calculation n f Probable Savings, S,
Since t h e t o t a l S2 of chart 2 is $693 which is less than the FB of $1239, 'Total 52 < FB, the (a) formula i s used to calculate t h e individual S p l s , t h a t is,
- Calculate the S ' s for the appropriate 4 2 ' s . P
- Add up the S ' s t o get Total S
P P
-
Step 12 - Calculation b f Payback, CJS
Depending on whether The minimum/maxinrum limits of payback or thc
probable payback is desired, one can use any or all of S I , S2, and Sp to calculate t h e payback time periodCs), For this example of chart 2 we
will use SF.
The paybacks are calculated for each upgrading measure by d i v i d i n g
thc upgrading cost (C) by each Sp (C/S ). Note that these i s a combined
payback for basement walls above and h&low grade because the price quotation of $900 covers the entire basement wall area.
- The total payback is calculated by d i v i d i n g t o t a l C b y t o t a l SF. S t c p 13 - Calculation of Minimum/Maximum Payback
To further illustrate this method, the minimum and maximum payback is calculated below fw each Q2 [R2).
Ceiling Frame Wall s
Basement Walls A.G. 6 B . 6 .
Total
Minimum
Payback CC/SZl, year.s Maximum Paybackt c f s r l ,
years Example 2. - # 2 RetrofitThis example ilIusXrates the estimated savings and paybacks resulting from going to higher insulation levels for the f o l l o w i n g components,
Frame walls have been l e f t out because the #1 retrofit f i l l e d the remainder (36 rnm) of the cavity [ I O U mm t o t a l ) and so higher R-values
cannot be achieved from the c a v i t y since additional insulation cannot
be added.
Ceiling, from R1
=
2-11 to R2 = 10.57, C o s t (C) = $700 Basement Walls A.G., from R 1 = 0 . 2 6 to R2 = 3.70Coat (C) =
Jlloo
Basement Walls B . G . , from R1 = 0 . 8 fo RZ = 3 - 9
?'he Rzls and C I S a r e entered into the appr~priate Taws and columns
in
t h e Retrofit s e c t i o n which is l a b e l l e d $ 2 Retrofit. (See c h a r t 3 . )Step 2
-
Calculations of Q2, S1, S 2 , Sp- The mlculatians are carried out for Q2, S1, S2, and S and t h e quantities entered in the appropriate boxes in the # 2 ~ e t r o f i ? section of charx 3.
Step 3
-
Payback, C/S- The desired savings fm SI, S2, and S are chosen to calculate the
payback. For this example we rill again chooge Sp which gives a payback
of 6.. 9 years for the ceiling, 2 - 5 years for the basement walls, and 3 . 1 years t o t a l for both. (See chart 3 . ) These payback periods are
reasonably s h m t
.
These results can he compared with the el Retrofit (chart 2 ) results to a i d in choosing levels: of insulation,
H A R T NO.
3
E N E R G Y
S A V
I N G S
C H A R T
l AME JYPE 'OF H ~ U S E J - + + A ~ U ~ . d & b ~ . h i INTERIOR TEMP. I T , ) 1.1
'C
V O L U M E OF H E A T E D SPACE q g l . 4 3 ItDDRESS
-
D E G R E E - D A Y S ( D D )46
74
D T T q
U,H P R O VO N T
A I R CHANGE^^ (NO.) i . n b: I T Y HOT W A T E R t i E ~ ~ l N ~ _ d c r t r l'c ( Q ,
-
Q Z ) S l 1 F x B T O T A L Q , A D D D D+
( T I-
18) x b = 4q
K 1 2 = 86,400 x A D D x K 2 X K x ( Q , - Q 2 ) 3 T O T A Ls2
<
F g ( a 1s
= 5 + 0 . 7 5 (5 - S ! ) P 1 2 T O T A L S,>
F B 4b) TOTAL 5 = TOTAL 5+
0.76 ( F B-
T O T A L 5,) P 1IXXMIPLE 3
-
EI'I'ECTS OF HIGH/L13W AIR W G E RATES-
The same house from Example 1 is used ta show t h e effects of varying
t h o air change rate. The value of 1.00 AC/h u s e d in Example 1 is increased and decreased by 50% to give the high/low range of 1.50 to 0 . 5 0 . The
siaic I ~ i ~ s i c data and t h c same #1 Retrofit R2 from char^ 2 values are used
t o carry u u t two scts of calculations using the high (chart 4) and low (chart 5) a i r change rate.
A comparison of the results from charts 4 and 5 shows t h e following range o f savings for the
#I
Retrofit actions:C e i l i n g
1;ramc wall s
Bascmcnt walls A.G. Bascment walls B.G.
Total.
f l l c s c results show that t h e high/law range of air change/hour produces a
41% range for S1 values; however it should be noted t h a t it makes no J i F F c ~ c n c c to S2 but does affect t h e by 5%. A n analysis of the
cffccts 011 t h e # 2 R e t r o f i t actions 2 from chart 3 would show
t h e same I I c r cerrt ranges.
Often the most cost-effsctive r e t r o f i t action is t h e tightening up
of ;I house by wcatl~erstripping, caulking, OT using o t h e ~ means to reduce
a i r leakage and thc air change rate. It is d i f f i c u l t , however, to
mcasurc or determine t h e i n i t i a l and f i n a l a i r change rates for a house.
IIcnce, thc fillowing example is an illustration rather than a guarantee
o f pass i h l e savings.
Far a "leaky" house w i t h an
a i r
change of 1.5Oih it is possible10 e f f e c t a 501 reduction by thorough, careful tightening of t h e house. The same house a s in Example 1 [chart 2 ) w i l l be assumed except
t h a t t h e o r i g i n a l (R1) AC/h is 1.50 and the new CR2) AC/h is 0.75,
Chart 6 shows the data and calculation g i v i n g values of
from this retrofit a c t i o n . This suggests a Iarge savings t h a t should be
,HART NO.
5
E N E R G Y
--S A V I N G S
- - -C H A R T
-( m e t r i c $ 1 u n i t s )
AME T Y P E OF HOUSE INTERIOR T E M P . I T . )
a i b c
3 V O L U M E OF H E A T E D SPACE 451
-
1 . G m DDWESS D E G R E E - D A Y 5 (DD)-
HEATING S Y S T E M &\--Qipe.d. C h uqfn
74
0-a
PI
A I R C Y A ' N G E I h (No,) b . 5 h 1 T Y PROV ~ N T HOT W A T E R H E A T I N G A l r 4 r i r T O T A L S 2-
<
F B ( b ) T O T A L 5 T O T A L 5 ,+
0 . 7 5 (F-
T O T A L 5 , ) P B- I A R T N O .
6
E N E R G Y
S A V I N G S
C H A R T
( m . e - t r i c S I u n i t s )4ME T Y P E O F HQUSE-A*~&~ INTERIOR TEMP. ( T ? )
. a / 'c
V ~ L U M E DF H E A T E D SPACE-3 Q R E S 5
-
H E A T I N G S Y S T E M , ~ ; ~ - & F P ~ .
L P C P . ~
air D E G R E E - D A Y S ( D D ) 4 & 7 4 TY
- P R Q V Dfd"r: HOT WATER H E A T I N G p. [ r r.4-ri c A I R C H A N G E J h ( N o . ) 1 . S(",
F U E L B I L L , F c 9 \ b ? ? B
=
2
K=
'L0.a
19/A?iCm K 3 14.
5.6
1m ,
-
Q,) S = F x 1 0 T O T A L Q , 1 I P R E V I O U S Y E A R A ) R L H R NG-6 T € ~ W < T / & R E T R O F I T-
A A 4 0 , B U I L D I N G COMPONENT A R Q 1-q
2 Q,=- 1 5 5 C 1 2 2 P/s
I 4 5 . na ,
11 3 1 2Frd-e
J * > a \ \ % 147 , I1.76
8 1 19.5 15.2 L 7 5 49.2
D.8
b a~ r .
a
4 . L 1 4 7 1 1 S ' r h A a ~ a 13 D. 35-
-
-
-
-
-
-- P A -8 n a p g , 3 # 7 6.7h5
A D D = D D t ( T *-
18) x b = q L 7 4 + / ~ / - I P ]I6
1=
5/57
9 10 11 12 S = 8 6 , 4 0 0 x A D D K 1 K 2 X K x i Q , - Q Z ) ? 3 T O T A L S 2-
<
F B A I R C H A N G E f Q = 0 . 3 6 1 x V ~ , x b l a . TOTAL T O T A L S,>
F g I b J T O T A L 5 = TOTAL 5,+
0.75 (F - T O T A L 5 , ) P 0 N 0 . 1 . 5 0 N 0 . 0 . 7 5 1 3 0 1 7 3547
5 1 6
-
3 9 4
\COHCLIIDINC; REMARKS
'rltis p p e r has pres.ant& a methodnlogy ta e~timaze Iteating-season
drlergy savings from ~einkulatiun
of
houses. Further savings would b eachicvcd i f a house had a coaling o r air-conditioning system. Although t h c mi.n imi~rn (Sl) and maximum
(Sz]
savings are theoretically correct, t h ea c t u a l r e s u l t s can vary considerably since
51
depends on the valuessclcctcd far Qi [or R l ) and
Qz
(or R2)while
S2 additionally depends onAIM) (or Ti] and K3.
Same factors influencing these pargmeters are as follows :
Ql and Q2 [Rl and R z j .
-
Failure ta include xhermal bridging effects int h e cslcuXatian of R-values can result:
in
the predicted SI, S2, andS p
h c i n g considerably higher than actual,
ADD (or
' r i l .
- The S2 calculations are affected by the accuracy of ADDwhich i s dependent on the varlable factor,
Ti.
Some houses, e a p c i a l l y o l d e r ones, may have lower interior temperatures(Ti's)
than realized[and used in calcula.tiorrr;) because of high heat loss rates and non-
uniform h a t i n g . This would result in the calculations p r d i c t i n g greater- than-actual S2 and
Sp
values.KI- - 'i'he S2 calculations depend on t h e seasonal efficiency of the heating
-
sysrcin and ~ S S U R C that it is constant before and aftex reinsulation.
I f t l w r a t i o of furnace r a t 4 output to building heat loss is increased hy
rcinsulat ing (K3 becomes smaller)
,
the actual savings can decrease or evcn disappear. It is very important, therefore, to damsize the furnace where'She authors w i s h to thank C. J. Shirtliffe for the numerous ideas and constructive discuss5m during the conceptual development of this method.
APPENDIX A
CONVERSIONS FROM AND TO ST
'I'ABLIS A 1
-
CONVERSIQNS FROM METRIC (SL] TO IMPERIAL(Multiply the metric [SI) unit by t h e factor given in the equation to
convcrt to imperial,) Length Volume Temperature Energy Power I t - V a l u e R/unit thickness 1 m = 3.281 ft: 1 mm = 0.0394 in. 1 m2 = 10.76 ft 2 1 m 3 = 1000 litre = 35.31 ft 3 1 litre = 0.220 gallon 1 J = 9.48 x
loq4
Btu 1 kJ = 0,948 BtuA- 2
TABLE A2 - IMPERIAL TO METRIC (SI) CONVERSIONS
{Multiply the i m p e ~ i a l unit by t h e factor given in t h e equation to
convcrt to metric (SI).)
Area Volume Mass 'S emper ature L ft = 0.3048 m 1 i n . = 25.4 m m 1 g a l l o n = 4.55 litre 3 1 ft = 0.0283 m 3 3 1 B t u - 1 . 0 5 ~ 10 J 1 B t u = 1 . 6 5 kJ R / u n i t thickness
APPENDIX .B
THERMAL RESISTANCES
TABLE B1
-
THERMAL RESISTANCE OF SOME C O W N BUILDING MATER.IALS*
Thermal Resistance Building Material or CompBnent Insulation Fibreglass Batt Ruckwool Batt
Fibreglass Laase F i l l [Blown-In)
Fibreglbss Loose F i l l (Poured) Rockwool Lodse F i l l (Blown-In)
Rackwool Loase F i l l (Poured] Cellulose Fibre (Blown)
Cellulose Fibre YPoured) Expanded
Mica
(Vermiculite, Zanolitc, ktc.) Polystyrene Loose Fill
Exprrnded Polystyrene [Rigid)
Extruded Polystyrene (Rigid]
Polyurethane [Rigid)
Polyurethane (Foamed in Place)
Fibreglass Sheathing
Urea Formaldehyde [Foamed Zn
Place, After Curing] \Vmd Fibre
Wood Shavings Cork
Glass Fibre Roof Board Mineral Aggregate Board
Compressed Straw Board
Fibreboard
Structural Materials
~ / m Fox R/in, Far
Thickness Thickness
Listed L i s t e d
Softwood Lumber [except Cedar) 0.0087
Cedar Lags and Lumber 0.0092
Concrete 2400 kg/m3 (150 lb/ft3) 0.00045
Concrete 1760 kg/n3 I l l 0 l b / f t 3 ) 0,0015 Concrete 480 kg/rn3 (30 l b / f t 3 3
a.
0069Handb~nk on Insulating Hoaes for Energy Consemation,
E . Scheuneman, 5 - ~ ~ f f a t t and M. Adelaar, Canadian General Standards Board,
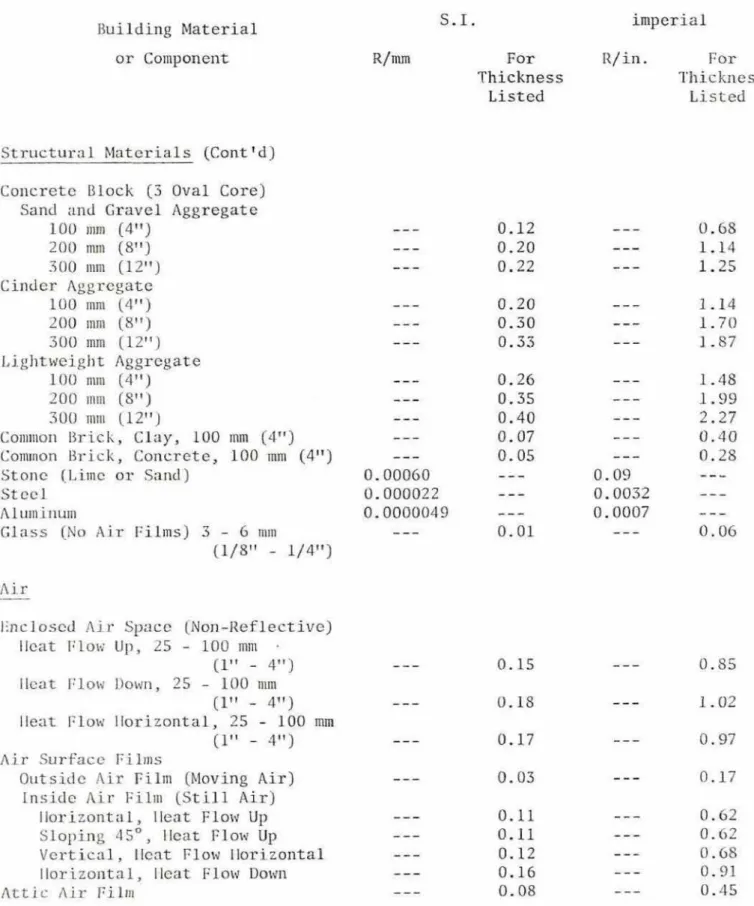
TABLE Bl
-
THERMAL RESISTANCE OF SOME C W O N BUILDING MATERIALS (Contrd)Thermal Re.sis t ance imperial Building Material or Component F o r Thickness Listed For Thickness L i s t e d
Structural Materials (Cont'd)
Concrete Block (3 Oval Core) Sand and Gravel Aggregate
100 mm (4'') 200 m (811] 300 mm (12") Cinder Aggregate
roo
mm (4") 200 mm (8") 300 mm {1214) Lightweight Aggrogatel o o
IIlm (4t1) 200 mrn (8") 300 mm [1ZW) Common B r i c k , Clay, 190 rm (4") Common Brick, Concrete, 100 mm (4")Stone (Limc or Sand) Steel Aluminum Glass [No A i r F i l m s ) 3
-
6 mm (1/8" - lj4")- - -
a m ----
lincloscd A i r Space (Nran-Ref lectiva)
f l ~ t P l m Up, 25
-
200Caw
-
4")flcat Flaw Down, 25 - 100 mm
0"
- 4"1lleat Flaw Ilorizsntal, 25
-
1613 ~ l g l(l'l
-
4If)Air Surface Films
Outside A i r Film (Moving A i r ]
Inside Air F i l m (still A i r ) t4orizontal, Heat Flow Up
Sloping 4S0, Heat F l a w Up
Veptical, Ileat Flaw tbrizrsfital
Ilorizontal, Heat Flow Down Attic A i r Film
B-3
'I'AB!,li I31 - TIII~IIMAT. RESISTANCE OF SOME COMMON BUILDING MATERIALS {Cont4d]
Thermal Resist ancc Building Materia1
or Component
S . I . imperial
Rim For R/in. For
Thickness Thickness
L i s t e d Listed
Asldral t KO 11 Roaf ing Asphalt Shingles
Woad Shingles (Cedar Shakes)
Bu4 1 t -Up Membrane (llot Mopped) Crushcd Stane (Not Dried) '
0. 0087 0.0087 0.017 0.0062 0.00040 Negli. Negli. Softwood Plywood
Mat -Forriled I'art icle Board
I nsulating Fibreboard Sheathing
Gypsum Sheathing Sheathing Paper
Asphalt-Coated Kraft Paper I'alyethylene Vapour Barrie~
1,25 1.25 2.45 0.89 0.06 Negl i
.
Negl i.
Fibreboard SidingMadim Uensity Hardbnard,
I 1 mm (7/16Iw) I i i g h Ilensity Hardboard, 11 mm (71 1 6") So f t w o 4 S i d ing (Lapped] Drop, 18 x 184
mm
{3/4lt x 7 1 / 4 1 ' ) Bevel, 12 x 184 mm ( l / Z t t x 7 1/4"] Bevel, 18 x 235 mm [3/4" x 9 1/4tt] Plywood, 9 mm (3/Bt8j , Wood ShinglesBrick (Clay o r Shale) 100 m (4")
h i c k (Concrete, Sand-Lime] 100 mm (4f1)
'CABLIi B I
-
TIIERMAL RESISTANCE OF SOME COMMON BUILDING MATERIALS (Cont 'd)Thermal Resist anca Building Matcrlal
or
bmponept R/m ForR/
in. ForThickness Thickness
Listed Listed
Cladding Materials (cant 1 d)
Mc-tal S i d i n g
Ilorizontal- Clapbaafd Profile
---
I Ior izontal Clapboard with Backing -
-
- Vertical V-Groove Profile- -
-Vertical Board and Batten Profile --
-
Interior FinishesGypsum Board, Gypsum Lath, Drywall, 23 mm (1/2") C;yp.sum IJlastcr Sand Aggregate, 13 mm ( l / Z v 1 ) Lightwcight AggregaXe, 13 lllnl (1/2"$ 1'1 ywood
,
7.5mm
[5/1619] Ii:crdl~rsard, (Standard),
6 mm [1/4'*)insulating Fibreboard, 25 nrm (I1')
Flooring
Maple or Oak [hardwood),
. 19 rnm (3/4")
Ikine or F i r (softwood), 19 m [3/4l17 Plywood, 16 m [5/8"]
Mat-farmed Particle Board,
16 inn1 ( S f 8 " )
Nood Fibrc Tiles, 13 mm [;l/Zfl) Linolwm, T i l e [resilient],
3 rnm (l/81tj
1'crrazzo, 25 m (1") Carpet, Typical Thickness
w i t h Fibrous Underlay
'I'AHLI: U l - TIIILRMAL RESISTANCE OF SOME COMMON BUILDING MATERIALS (Conttd) Thermal Resistance Building Material
or Component
Wlnrlows
[includir~g i n s i d e and outside air films) S i n g l e Glass
Insulated Glass (aouble Pane)
5 ttim (3/16") A i r Space
6 nun (2/41t) A i r Space 13 nlln ( l / 2 l r ) A i r Space 19 IIMI ( 3 / 4 8 t ] A i r Space
lnsulatcd Glass (Triple Pane) 6 mm [1/4Ir) A i r Space 1 3 mm (1/2f1) A i r Space 29 mm (3/4T1$ A i r Space Storm W inlows Single P a n e + 25 - 100 mm (1" - 4") A i r Space 19 mm (3/411) Sealed Unit +
25
-
100 mm [If'-
4")Air
SpaceR/'-
For T h i c h e s s Listed imperial R/in., For Thickness ListedThermal Resistance Values f&r Basements
The basement wall above grade and t h e basement wall and f l o o r below grade are treated separarely, The faundat;ion wall above grade is exposed
to o u t s i d e a i r temperatures and bkhaves in much the same way as other
above-grade construction. The below-grade portion requires special consideration, however, because ather factors must b e taken i n t o account
to obtain rhe thermal resistance values shown in Table B2. These values were obtained from measured results and will be revised as more information
aboux below-Cade heat losses beantes available.
If Xhe desired insulation requirements do not exactly match those
shown i n Table BZ, the one t h a t most clearly approximates the desired
value should be chosen. As the R-values for various construction t y p e s are not ITnear functions, they should not be inxerpalated from these values.
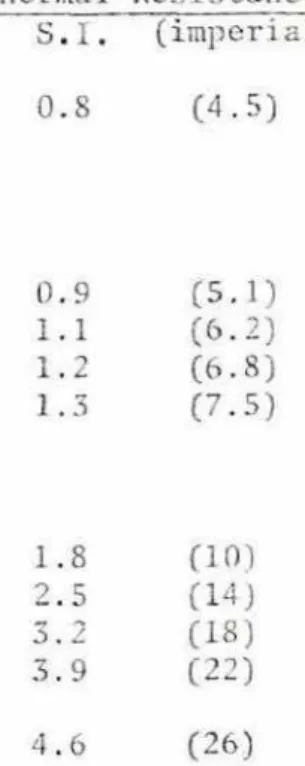
TABLE B-2
-
PRovIsrmL T H E ~ L RESISTANCE VALUES FOR BELOW-GRADECONSTRUCTION IN CANADA
Fur 200 mm (S in,) concrete foundation wall
Without insulation
With i n s u l a t i o n 610 m [241r) below
grade and 1220 mm (48") uninsulated
R 0.70 (R43 insulation R 1.41 (R8] insulation R 2.11 ( R l Z ] insulation
R 3 - 5 2 (R20) insulation With i n s u l a t i o n down t o footing
R 0 . 7 0 (R4] insulation R 1.41 CR.8) insulation R 2.11 (R12) insulation R 3.52 (R20) insulation Concrete floor Thermal Resistance 6. I , (imperial) 0 - 8 (4.51
APPENDIX C
THERMAL BRIDGING
IN
WALLS AND CEILINGS'Chermal bridging refers to the effect of heat flowing at different rates through a building compcment due to different materials in the
component. The most common example in housing is the presence of wall studs and ceiling j o i s t s which have a different heat flow or heat
resistance (R-value) from the rest of the wall and c e i l i n g area.
Thermal bridging alters the nominal resistance [R) values of walls and ceilings and should be considered when calculating the thermal
resistance of a building component, both before and after upgrading.
For example, in m o s t houses the wall studs comprise about 20% a f the
nct wall area
and
ceiling joists about 10% of the ceiling area- The formulae to calculate theR
values for these houses yould be:R wall = 0.80
R
cavity*
0 . 2 0 R stud R ceiling = 0.90 R cavity + 0.10 R joist 'l'his is referred to as a parallel heat flow calculation,The example o f a wall, shown in Figure C-1, illustrates t h e effects
on R-values and savings.
R = 1.41 (8.01) 5 tud R = 0.75
(4.26)
cavity ( a ) UNINSULATED WALL (BEFORE REINSULATION) (b) INSULATED WALL(AFTER
REINSULATION)It car1 be s e a for: [a) that the thermal bridging increases the
ovcr-all It-value by 17%, r0.88
-
0.751 ; 0.75 x 100 and for (b) it dccreascs t h e ovep-all R-value by 9%, (2.68 - 2-43]+
2 . 6 8 x 100.Using F h = $1239 and A = 143.1 values from the text example, we cart
cxamine the effects on the savings a s follows:
( i ) U s i n g R-values without accounting f o r thermal bridging:
T o t a l Q1 = 511 + 191
-
81=
621(ii] Using R-values accounting for thermal bridging: Total Ql = 511 + 163 - 81 = 593
Walls (i) 1 4 3 . 1 0.75 191 2.68 53 $275 $629
(ii) 143.1 0.88 163 2 . 4 3 59 $217 $474
Kasc (i) gives results f a r
SI,
92 and S that arc high by 27%, 33%,for thermal bridging effects.
R
and 32% respectively. This demonstrates t e importance of accounting
Thc percent error will vary for different situations as shown by
Example 2 .
Using the wall from the example in the main t e x t (assuming these are nominal values anly) and the R stud value from Figure C-1, one can use
t h e parallel heat flow calculation t o obtain corrected R-values as
follows:
[ i ) Nominal calrulat ion:
Total Q1 = 511 i 81
-
81 = 511(ii) 13arailel heat f l o w calculation: T o t a l Q1 = 511 + 85
-
81 = 515Walls [i) 143.1 1.76 81 2 2 9 62 4 6 $87 $77
[ii) 143.1 1.69 85 2.11 68 $41 $77 $68
Case (i) again g i v e s rermlts fm S1, S p and S that are high by 12\,
APPENDIX D
DEGREE-DAYS (DD)
AND
ACTUAL DEGREE-DAYS (ADD]Degree-Days (DDJ
Heating degree-days is a measure used to estimate heating enrj-rgy consumed. Past me$surements revealed that the fuel constutted in small buildings was roughly propamional to t h e difference between an indoor
temperature of 65'~
1-
18°C) and the outdoor temperature; consequently degree days [DD] were tabulated using a base of 65OF ( 1 1 8 ~ ~ ) . This empirical correlation has s e w & well but, because of changes to insulation levels in buildings and particularly the increased use of electrical appliances, t h i s relation is no longer adequate.Actual Degree-Days [ADD)
Many houses today seem zo require heating only when the outdoor temperature, is below freezing- It was decided, therefore, that the
actual indaor/outdom Cemperature difference would provide a more u s e f u l
measure f o r computation. The true themal load on a house could be determined using actual degree-days (ADD); the contribution of the
internal heat gains would be reconsidered in some o t h e r way.
Table Dl is a list af actual degree-day {ADIS) values based on an
indaor temperature
(Ti)
of 21°C { 7 0 ° ~ ) . The values were computed usingan approximatiran method and are believed
to
be within a 5% accuracy. For values not listedin
Table Dl or for an i n t e r i o r temperature,T i , other than 21°C [7Q0~), the ADD may be computed from the following
formula:
ADD = DU + (Ti
-
181 x b (Imperial:ADD
= DD + (Ti - 651 b) where DD = degree,days f o ~ location*Ti = interior temperature
b = const'ant factor f r o m location on map in Figure D-1
* This value can b e obtained from the Local weather office, CMHC officc,
electric utility o f f i c e , library, The Supplement to the Hatianal Building Code of Canada, 1980, pp. 11-21, NRCC No. 17724 or
Atmospheric Envir~nmental Servic,e, 4905 Dufferin S t r e e t , Downsview, OnTaria, #3H 5T4, Phone: 416-667-4917.
'l'l~c temperature,
Ti,
may be measured or approximated as the tllemostatsetting. I:ar example, a house in Winnipeg has a constant thermostat
s e t t i n g of 22OC; hence, Ti = 22°C (72°F) and LID = 5887 t10679). From Figure TI-1 t h e b far Winnipeg is 161 C2903 which gives
ADD = 5887 + [22
-
18) K 161 = 6531(ADD = 10679 + (72
-
i65) x 290 = 12709)Many occupants, however, are practicing thermostat setback, i.e., thc t h e m s t a t setting is turned down at night
or
other times. F o rthese situations the fallowing Pomula can be used to estimate an
avcruge T : i
whcrc h = number of hourslday at temperature TI
1
h2 = number of hours/day at temperature T p
F u r cxainplc, a house has thermostat settings as follows:
TI = 21°C (70°F) from 8 ant to 10 pro (i-e., hl = 14)
T2 = 16'~ ( b l ' ~ ) from 10 pm to 8 am (i.e., h2 = 10)
and hcnce for a huuse in Winnipeg
ADD = OD
+
(T-
1 8 ) x b i= 5887
![TABLE 51 - ACTUAL UEGREE-DAYS [ADD) BELOW 2 1 " ~ (7D0~]](https://thumb-eu.123doks.com/thumbv2/123doknet/14338208.498872/37.930.108.861.165.1058/table-actual-uegree-days-add-d.webp)
