HAL Id: inserm-01802816
https://www.hal.inserm.fr/inserm-01802816
Submitted on 29 May 2018HAL is a multi-disciplinary open access archive for the deposit and dissemination of sci-entific research documents, whether they are pub-lished or not. The documents may come from teaching and research institutions in France or abroad, or from public or private research centers.
L’archive ouverte pluridisciplinaire HAL, est destinée au dépôt et à la diffusion de documents scientifiques de niveau recherche, publiés ou non, émanant des établissements d’enseignement et de recherche français ou étrangers, des laboratoires publics ou privés.
Should sensory impairment be considered in frailty
assessment? A study in the GAZEL cohort
Morgane Linard, Marie Herr, Philippe Aegerter, Sébastien Czernichow,
Marcel Goldberg, Marie Zins, Joël Ankri
To cite this version:
Morgane Linard, Marie Herr, Philippe Aegerter, Sébastien Czernichow, Marcel Goldberg, et al.. Should sensory impairment be considered in frailty assessment? A study in the GAZEL cohort. Journal of Nutrition, Health and Aging, Springer Verlag (Germany), 2016, 20 (7), pp.714 - 721. �10.1007/s12603-015-0651-4�. �inserm-01802816�
Should sensory impairment be considered
in frailty assessment ? A study in the GAZEL cohort
Authors: M. Linard1,2, M. Herr1,2, P. Aegerter1,2, S. Czernichow1,2, M. Goldberg1,2,3, M. Zins1,2,3, J. Ankri1,2
1
INSERM, VIMA: Aging and chronic diseases. Epidemiological and public health approaches, U1168, F-94807, Villejuif, France
² UVERSUSQ, UMR-S 1168, Université Versailles St-Quentin-en-Yvelines, France
3
UMS 011, INSERM-UVSQ, Villejuif, France
Correspondence: Pr. Joël Ankri
INSERM UMR 1168 : « Vieillissement et Maladies chroniques : approches épidémiologique et de santé publique », Université Versailles St-Quentin-en-Yvelines
Centre de Gérontologie, 49, rue Mirabeau, 75016 PARIS, FRANCE Tel: +33 1 44 96 32 05
Fax: +33 1 44 96 31 46
ABSTRACT
Objectives: The assessment of sensory difficulties is sometimes included in the screening of
frailty in ageing population. This study aimed to compare the prevalence of frailty and
associated risk of adverse outcomes depending on whether sensory difficulties participated in the definition of frailty.
Design: Prospective cohort study – GAZEL cohort Setting: France
Participants: The 13,128 subjects who completed a questionnaire in 2012.
Measurements: According to the Strawbridge questionnaire, subjects were considered frail if
they reported difficulties in two domains or more among physical, nutritive, cognitive and sensory domains. The risk of adverse health outcomes was assessed by using and logistic regression models (hospitalisations, onset of difficulty in performing movements of everyday life) and multivariate Cox proportional hazards models (mortality).
Results: Mean age was 66.8 +/- 3.4 years and 73.8% were males. The prevalence of frailty
varied from 4.4 to 14.2% depending on whether the sensory domain was excluded or
included. During follow-up, 182 deaths (1.4%), 479 hospitalisations (3.6%) and 703 cases of disability (8.0%) were observed. Both definitions of frailty predicted the onset of difficulties to perform everyday movements, with 2 to 3-fold increase in the risk. The inclusion of the sensory domain in the definition made frailty predictive of hospitalisations (Odds Ratio 1.31 [1.01-1.70]) but the association with mortality was only observed when sensory difficulties were ignored (Hazard Ratio 2.28 [1.32-3.92]).
Conclusion: The inclusion of a sensory domain into a frailty screening instrument has a major
develop the use of frailty screening instruments in clinical practice, further researches will need to carefully evaluate the impact on risk prediction of the different domains involved.
INTRODUCTION
During the last decade, frailty has raised increasing interest among researchers and geriatricians. Frailty is defined as “a consequence of age-related decline in many
physiological systems, which collectively results in vulnerability to sudden health status changes triggered by minor stressor events” (1). Main health outcomes reported are falls, hospitalisations, disability, institutionalization and death (2). Frailty is recognized as a useful concept because it improves the understanding of the heterogeneity of vulnerability in old people (3). Moreover, frailty is assumed to be a reversible status, which can take advantage of early preventive interventions and reduce adverse health outcomes and health care costs.
Despite its growing recognition, there is still no consensual definition of frailty. Two main approaches co-exist: the frailty phenotype and the cumulative deficit model. The frailty phenotype published in 2001 by Fried and colleagues is defined as a clinical syndrome in which three or more of the following criteria are present: unintentional weight loss, self-reported exhaustion, weakness (grip strength), slow walking speed and low physical activity (4). According to the cumulative deficit model, frailty can be assessed by adding deficits in many physiological systems into a summary score called frailty index (5, 6).
Depending on their purpose, on the target population, and on the data available, different screening instruments for frailty have been proposed (2). The choice of the domains that should be included into screening instruments for frailty is still under debate (7) and experts pointed out the need to determine “the contribution to frailty from other clinical domains not currently included in broad definitions that may enhance predictive value” (8). A systematic review of existing screening instruments for frailty published by Sternberg et al. indicates that sensory impairment is part of 6 out of the 22 frailty screening instruments (2), which is probably explained by the fact that sensory impairment was shown to be a risk factor
for falls, institutionalization, disability and reduced quality of life (9-11). Nevertheless, few studies have investigated the relationship between sensory impairment and frailty (12-14) and, to our knowledge, none has investigated the impact of adding a sensory domain into a frailty score, in terms of prevalence and predictive ability.
In a large cohort of ageing people in France, this study aimed to compare two
definitions of frailty differing by the inclusion or not of a sensory domain, with regards to the prevalence of frailty, the associated risk of adverse outcomes and its predictive ability. Frailty was assessed by using the Strawbridge questionnaire (15) and adverse outcomes of interest were onset of difficulty in performing everyday life movements, hospitalisation and death.
MATERIAL AND METHODS
Study design and participants
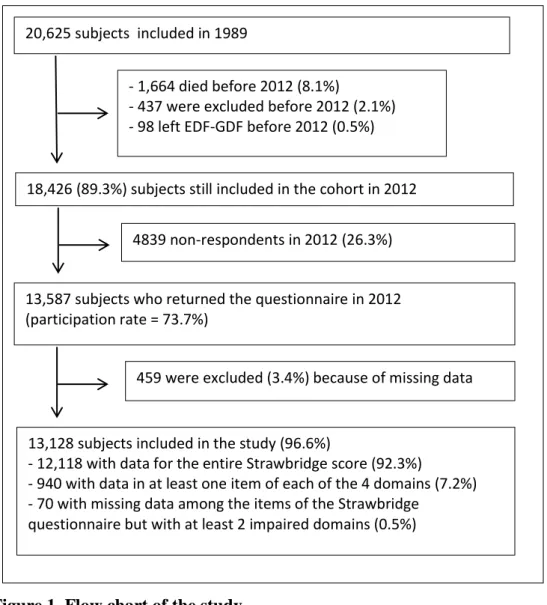
This work is based on the data from the GAZEL study, a prospective cohort that began in 1989 and is still ongoing.Participants were recruited among the 150,000 employees of France’s national electricity and gas utility (Eléctricité de France – Gaz de France, EDF-GDF). Details concerning the study design have been described elsewhere (16). Briefly, 20,625 employees (5,614 women and 15,011 men aged 35-50 years) accepted to participate. Each year, participants were invited to complete a postal questionnaire including a large set of items dealing with health status, lifestyle, socioeconomic and occupational factors. Data were also collected from national registers and personal and medical departments of EDF-GDF. A total of 18,426 participants (89.3%), aged between 58 and 73, were still followed in the cohort in 2012. That year, the Strawbridge questionnaire was added to the annual questionnaire to assess frailty in the ageing cohort. Our study population consisted of the subjects included in the GAZEL cohort who completed the frailty assessment in 2012.
Frailty assessment
According to Strawbridge et al. (15), the frailty assessment was based upon 16 items gathered in four domains. Four items assessed physical domain (sudden loss of balance, weakness in the arms, weakness in the legs, get dizzy when stand up quickly), two items assessed nutritive domain (unexplained weight loss, loss of appetite) and four items assessed cognitive domain (difficulty paying attention, difficulty finding the right word, difficulty remembering things, forgetting where put something). The six other items assessed sensory domain: three items assessed vision problems (difficulty reading newspapers, difficulty recognizing a friend across the street, difficulty reading signs at night) and three hearing problems (hearing over the phone, hearing a normal conversation, hearing a conversation in a noisy room).
Scores for the six items of the sensory domain ranged from 1 to 4, with 1 = no difficulty, 2 = little difficulty, 3 = some difficulty and 4= great deal of difficulty. Scores for the other ten items were rated differently, with: 1 = rarely or never had the problem in the last 12 months, 2 =sometimes had the problem, 3 =often had the problem and 4 = very often had the problem. Participants who scored 3 or 4 in one item were considered to have difficulty in this item.
Subjects were considered frail if they reported difficulty in 2 domains or more.
Covariates
Data were collected about socio-demographic characteristics (age, gender,
socioeconomic position, family situation and education), health status (reported body mass index, self-perceived health, depression, chronic diseases and hospitalisations) and behaviours (tobacco and alcohol consumption). Self-perceived health was rated with a Likert scale
including 8 levels grouped by two to create a variable with 4 levels (very poor/poor/good/very good). Social situation was rated with a Likert scale including 10 levels grouped to create a variable with 3 levels (disadvantaged, normal, comfortable). The emotional status was assessed using the French version of CES-D scale (Center for Epidemiologic Studies – Depression scale) (17). Subjects were considered as depressed if their score was ≥ 17 for men and ≥ 23 for women. A comorbidity score was created using the presence or absence of 7 self-reported diseases: cancer, diabetes, hypertension, lung disease, heart disease, stroke and muscular or articular pain. Three levels of comorbidity were defined, depending on the number of self-reported diseases: 0 / 1 / ≥ 2 (18).
Outcomes
The longitudinal design of the study enabled to have information about
hospitalisations, onset of difficulty in performing movements of everyday life, and mortality. Hospitalisations were documented with a question included in the 2013 questionnaire: “During the past 12 months, have you been hospitalized?” The onset of difficulty in
performing movements of everyday life was defined as a positive answer to the question “Do you have difficulty performing some movements of everyday life?” in 2013 while there was no reported difficulty in 2012. Information concerning mortality was obtained from EDF-GDF personal department; the median of the follow-up was 2.2 years.
Statistical analysis
Characteristics of the study population were described using prevalence for categorical variables and mean +/- standard deviation (SD) for continuous variables. The prevalence of frailty was compared according to the following definition:
- FrailtyS+: at least 2 domains impaired among 4 (physical, nutritive, cognitive, sensory);
- FrailtyS-: at least 2 domains impaired among 3 (physical, nutritive, cognitive). Factors associated with frailty were identified using logistic regression models. The variables introduced into the models were those associated with frailty with a p-value <0.20 in bivariate analysis, as well as those commonly found associated with frailty in the literature. The final models were obtained by eliminating variables associated with outcomes with a p-value >0.05.
The risk of adverse health outcomes in relation to frailty was assessed by using multivariate Cox proportional hazards models (mortality) and logistic regression models (hospitalisations and onset of difficulty in performing movements of everyday life). The variables introduced into the models were selected as described above. The predictive ability of the different definitions was compared by computing the area under the curve (AUC) (hospitalisation and onset of difficulty in performing movements of everyday life) and the Harrell’s C statistic (mortality).
The results are presented with adjusted Hazard Ratio (aHR) and Odds Ratio (aOR) with 95% confidence intervals (95% CI). Analyses were performed using Stata® software, version 13.0.
RESULTS
Population
Among the 18,426 subjects who were invited to complete the questionnaire in 2012, 13,587 subjects returned the questionnaire (participation rate = 73.7%). Compared to non-participants, subjects who returned the questionnaire in 2012 were more likely to be men
(73.7% versus 68.2%, p<0.001), were slightly older (+0.4 year on average, p<0.001) and more educated (high level of education: 18.8% versus 13.2%, p<0.001).
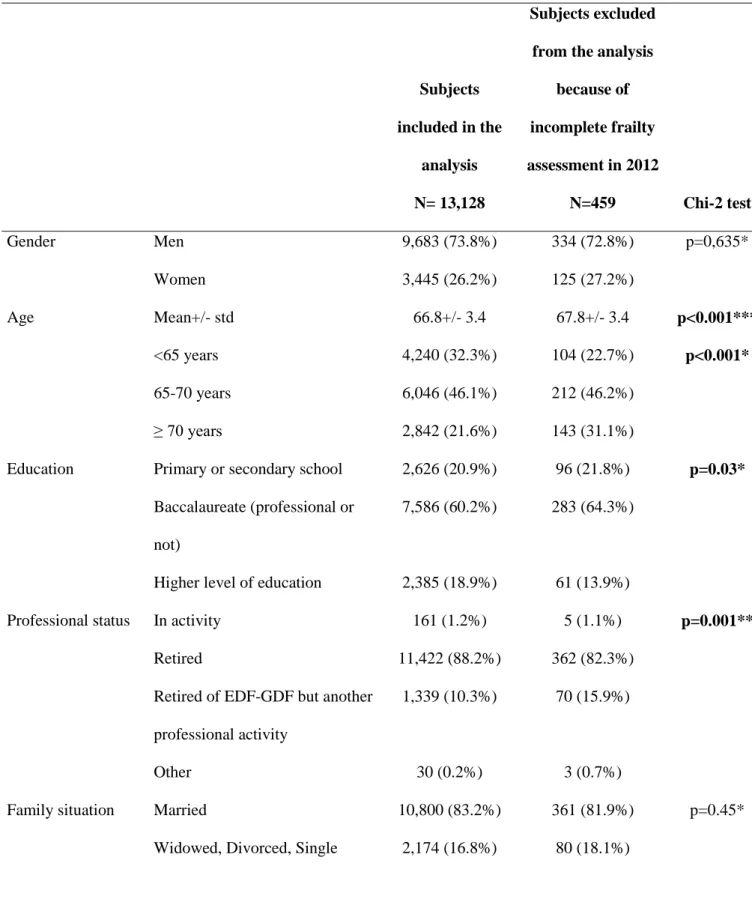
Because of critical missing data regarding frailty, 459 subjects were excluded from the analysis that was finally carried out in 13,128 subjects (flow-chart in Figure 1). Compared to people with missing data, those included in the analysis were younger (-1.0 year on average, p<0.001), more educated (p=0.027), and less likely to have started another professional activity after retirement from EDF-GDF (p<0.001). However, there was no difference regarding gender or comorbidity score (Table 1).
The study population was mostly composed of males (73.8%), of retired people (88.1%), and of people living in couple (83.2%). Mean age was 66.8 +/- 3.4 years (min=58, max=73). Among them, 41.2% reported one health problem (n=5,406) and 42.2% reported 2 diseases or more (n=5,537). The main reported diseases were articular or muscular pain (66.3%, n=8,706), hypertension (30.3%, n=3,978) and lung disease (17.7%, n=2,319). Characteristics of the participants are further described in Table 1.
Prevalence of frailty
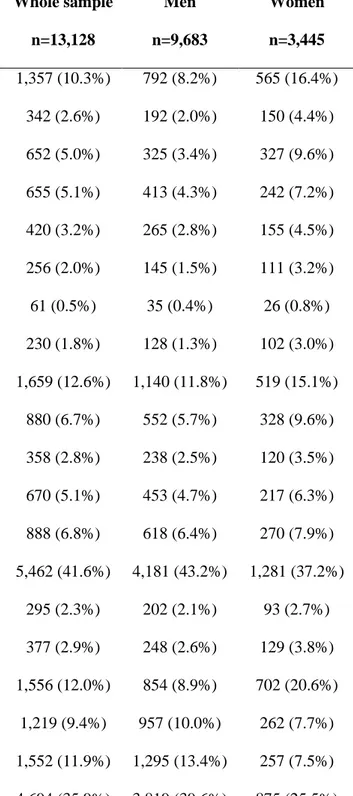
Table 2 shows the distribution of reported problems or difficulties in the items included in the Strawbridge questionnaire. Sensory difficulties were the most frequently reported (41.6%), followed by cognitive, physical and nutritional impairments (12.6%, 10.3% and 2.0%, respectively). Among the study population, 4,772 subjects (36.4%) reported
hearing problems and 1,798 (13.7%) visual problems. Men were more likely to experience sensory difficulties than women (43.2% versus 37.2%, p<0.001). Nevertheless, visual problems were more frequent in women (21.9% versus 10.8%, p<0.001) whereas hearing problems were more frequent in men (40.0% versus 26.2%, p<0.001).
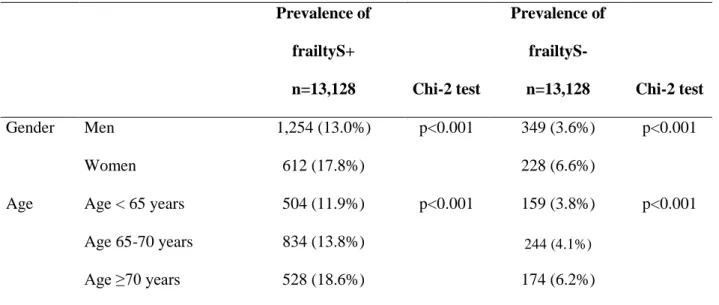
The prevalence of frailtyS+ was 14.2% (95% CI: 13.6%-14.8%) (n=1,866). Most of the subjects identified as frailS+ (93.4%) reported visual or hearing problems. When
excluding the sensory domain (frailtyS-), the prevalence of frailty was reduced to 4.4% (95% CI: 4.1%-4.8%) (n=577). In both cases, the prevalence of frailty increased with age and was higher among women (Table 3).
Factors associated with frailty
Factors associated with frailty in multivariate analysis are presented in Table 4.
Whatever the definition of frailty, the main factors associated with frailty were female gender, old age, a very poor self-perceived health, depression, thinness (body mass index ≤18.5 kg/m²) and higher level of comorbidity. Associations with variables indicating a poor health status were enhanced when frailty was defined without sensory impairment (frailtyS-). For instance, a very poor self-perceived health was more strongly associated with frailtyS- (OR 5.92 [3.60-9.71]) than with frailtyS+ (OR 3.40 [2.12-5.47]). High education level, low social situation and high alcohol consumption were only associated with frailtyS+.
Prediction of adverse health outcomes
Among the study population, 182 subjects (1.4%) died within the follow-up, 479 (3.6%) were hospitalized between 2012 and 2013, and 703 subjects (8.0%) developed difficulties in performing everyday life movements.
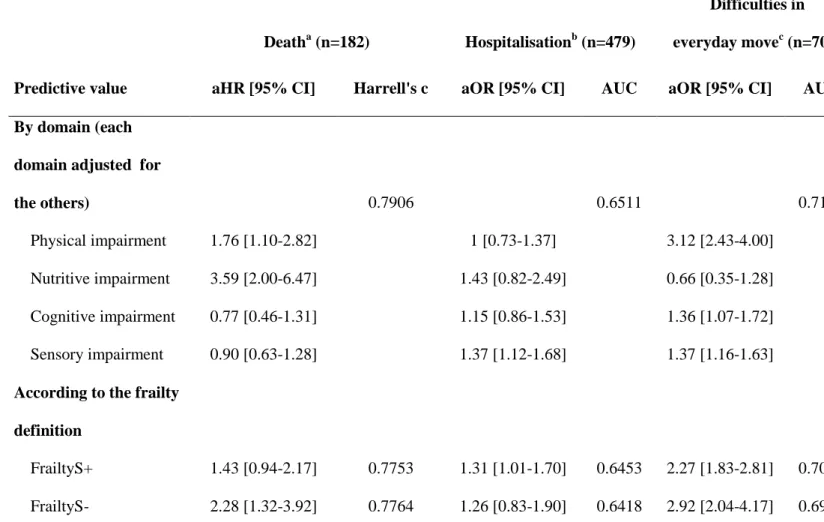
FrailtyS+ was not significantly associated with mortality whereas frailtyS- more than doubled the risk of dying within the follow-up (Table 5). Both definitions identified people at increased risk for onset of difficulties in performing movements of everyday life whereas frailtyS+ was the only one significantly associated with hospitalisations during the 12 months following the frailty assessment.
The discriminative ability of the definitions was not influenced by the frailty definition. Values of the Harrell’s C statistics and AUC were comprised between 0.64 and 0.77, with the higher values being observed for mortality.
We ensured that each domain of frailty was significantly associated with at least one outcome, independently of the other domains (Table 5). Risk factors for mortality were physical and nutritive impairments. The sensory domain was the only one predicting hospitalisations. As to incident difficulties in performing movements of everyday life, they were related to the presence of physical, cognitive and sensory impairments.
DISCUSSION
Main findings
This study assessed frailty through impairments in four domains that were the physical, nutritive, cognitive and sensory domains. The prevalence of frailty – defined as an impairment in at least two domains – varied substantially depending on whether the sensory domain participated in the identification of frailty or not, from 4.4% when it was excluded from the definition of frailty to 14.2% when it was included. Of note, most subjects identified as frailS+ reported visual or hearing difficulties (93.4%). In addition to an increase in the number of people identified as frail, the inclusion of a sensory domain in the definition of frailty led to identify people relatively healthier, with lower risks of adverse health outcomes.
Strengths and limits
Main strengths of this study are its prospective design, its large sample size and the broad scope of the data collected. The study population was selected among all the regions of France and represented various socio-professional categories. The participation rate was
noteworthy considering the 25 years follow-up and only few subjects were excluded because of missing data or loss of follow-up. Nevertheless, results should be interpreted with caution considering the age of the study population and the large proportion of males. Though the study sample was relatively young, the prevalence of sensory difficulties was similar to estimations in people aged 65-84 years in France (namely 11% for visual problems and 28% for hearing problems) (19). Considering gender differences in frailty, this study may not be the ideal setting to explore them. For instance, the low number of death in women (n=29) did not allow us to perform the survival analysis by gender. Elsewhere, the assessment of frailty did not include physical measures. Self-reported data enabled us to assess frailty in thousands of people but their accuracy can be questioned (particularly in ageing people who could present memory impairment).
Impact of the sensory domain on the prevalence and factors associated with frailty
Compared to other studies that used the Strawbridge questionnaire, we found a lower prevalence of frailty (14.2% versus 21% in the study by Matthews et al. (20) and 26% in original paper by Strawbridge et al. (15)), probably because of the younger age of our study population. Further comparisons with the literature are uncertain considering the variability of the prevalence of frailty according to the definition used. In a literature review published in 2012, the prevalence of frailty was estimated between 4.0 and 59.1% depending on the scores used (21).
In our study, there was a 3-fold increase in the prevalence of frailty when sensory impairment was considered in the frailty assessment (from 14.2% to 4.4%). This result shows that the very composition of the scores has a major impact on the prevalence of frailty and it reaffirms the need of further researches to study the relevance of each domain to get a consensual definition.
Despite differences in the prevalence of frailty according to the definition used, factors associated with frailty are relatively constant across studies. Thus, we found the same factors than those described in the literature: age, gender, number of pathologies, self-perceived health, depression, and body mass index (22, 23). In addition, we confirmed the role of socio-economic factors, also previously suggested in other studies (24-26).
Impact of the sensory domain on the prediction of adverse health outcomes
It’s widely accepted that frailty is a risk factor for death (27), hospitalisations and disability (4). Nevertheless, the Strawbridge definition of frailty predicted hospitalisations and incident difficulties in everyday movements, but not mortality in our study. Matthews et al (20) found that the Strawbridge definition of frailty was associated with mortality only when self-reported cognitive problems were replaced by cognitive tests. Here, we have shown that the exclusion of the sensory domain from the definition enabled to identify people with a higher risk of mortality.
Relevance of the frailty assessment
When analysing the prediction of adverse health outcomes, the values of the AUC and Harrell’s C statistics were fair, shedding light on the limited discriminative ability of the models. These results are not surprising in view of literature, where these statistics range between 0.58 and 0.78 for similar outcomes (28) (29) (30). This lack of discriminative ability is mainly related to the high rates of false positive. Our findings, together with results of previous studies, confirm that current frailty screening tools are not enough powerful to implement public health policies. Thought frailty is a risk factor for adverse health outcomes, it is not sufficient to be a good diagnostic tool (31).
More broadly, this study raises the question of the relevance of the concept of frailty compared to the separate assessment of physical, nutritional, cognitive, and sensory
impairments. Each type of impairment can already be prevented, diagnosed and treated, independently from the assessment of frailty. The identification of the frailty status based on the presence of difficulties in 2 domains or more could result in the underestimation of health care needs in subjects with only one domain impaired, thus identified as non-frail.
Nevertheless, the implementation of frailty measures in clinical practice may help the generalization of standardized geriatric evaluations that could otherwise be neglected.
Thus, the choice to include or not sensory impairment into the frailty definition should depend on the objective of the frailty assessment. If the aim is to screen subjects with
difficulties, the frailtyS+ definition seems to be the most interesting definition because it includes a wider range of age-related problems. But if emphasis is given to the prediction of health adverse outcomes, the frailtyS- definition may be more performant.
CONCLUSION
The inclusion of a sensory domain into a frailty definition has a major impact on the number of subjects identified, on the severity of their health problems, and on the risk of adverse outcomes. It allows for a broader assessment of age-related difficulties but does not improve the discriminative ability of the frailty concept. In order to develop the use of frailty screening instruments in clinical practice, further researches will need to carefully evaluate the impact on risk prediction of the different domains involved.
The Gazel Cohort Study was approved by the Commission Nationale de
l’Informatique et des Libertés and the Ethics Evaluation Committee of INSERM. Participants provided written informed consent.
Conflict of interest:
Dr. Linard has nothing to disclose. Dr. Herr has nothing to disclose. Dr Zins has nothing to disclose. Dr. Goldberg has nothing to disclose.
Dr. Czernichow reports personal fees from novo, personal fees from MSD, personal fees from servier, personal fees from Lilly, personal fees from covidien, outside the submitted work; . Dr. Aegerter has nothing to disclose.
Dr. Ankri has nothing to disclose.
References
1. Clegg A, Young J, Iliffe S, Rikkert MO, Rockwood K. (2013). Frailty in elderly people. Lancet, 381(9868), 752-62. doi: 10.1016/S0140-6736(12)62167-9
2. Sternberg SA, Wershof Schwartz A, Karunananthan S, Bergman H, Mark Clarfield A. (2011). The identification of frailty: a systematic literature review. Journal of the American Geriatrics Society, 59(11), 2129-38. doi: 10.1111/j.1532-5415.2011.03597.x
3. Bergman H, Ferrucci L, Guralnik J, Hogan DB, Hummel S, Karunananthan S, et al. (2007). Frailty: an emerging research and clinical paradigm--issues and controversies. The journals of gerontology Series A, Biological sciences and medical sciences, 62(7), 731-7.
4. Fried LP, Tangen CM, Walston J, Newman AB, Hirsch C, Gottdiener J, et al. (2001). Frailty in older adults: evidence for a phenotype. The journals of gerontology Series A, Biological sciences and medical sciences, 56(3), M146-56.
5. Mitnitski AB, Mogilner AJ, Rockwood K. (2001). Accumulation of deficits as a proxy measure of aging. TheScientificWorldJournal, 1, 323-36. doi: 10.1100/tsw.2001.58
6. Rockwood K, Song X, MacKnight C, Bergman H, Hogan DB, McDowell I, et al. (2005). A global clinical measure of fitness and frailty in elderly people. CMAJ : Canadian Medical Association journal = journal de l'Association medicale canadienne, 173(5), 489-95. doi: 10.1503/cmaj.050051
7. Gobbens RJ, Luijkx KG, Wijnen-Sponselee MT, Schols JM. (2010). Towards an integral conceptual model of frailty. The journal of nutrition, health & aging, 14(3), 175-81. 8. Walston J, Hadley EC, Ferrucci L, Guralnik JM, Newman AB, Studenski SA, et al. (2006). Research agenda for frailty in older adults: toward a better understanding of
physiology and etiology: summary from the American Geriatrics Society/National Institute on Aging Research Conference on Frailty in Older Adults. Journal of the American Geriatrics Society, 54(6), 991-1001. doi: 10.1111/j.1532-5415.2006.00745.x
9. Dalton DS, Cruickshanks KJ, Klein BE, Klein R, Wiley TL, Nondahl DM. (2003). The impact of hearing loss on quality of life in older adults. The Gerontologist, 43(5), 661-8. 10. Jin YP, Wong DT. (2008). Self-reported visual impairment in elderly Canadians and its impact on healthy living. Canadian journal of ophthalmology Journal canadien
d'ophtalmologie, 43(4), 407-13. doi: 10.3129/i08-077
11. Deshpande N, Metter EJ, Bandinelli S, Lauretani F, Windham BG, Ferrucci L. (2008). Psychological, physical, and sensory correlates of fear of falling and consequent activity restriction in the elderly: the InCHIANTI study. American journal of physical medicine &
rehabilitation / Association of Academic Physiatrists, 87(5), 354-62. doi: 10.1097/PHM.0b013e31815e6e9b
12. Doba N, Tokuda Y, Goldstein NE, Kushiro T, Hinohara S. (2012). A pilot trial to predict frailty syndrome: the Japanese Health Research Volunteer Study. Experimental gerontology, 47(8), 638-43. doi: 10.1016/j.exger.2012.05.016
13. Kamil RJ, Li L, Lin FR. (2014). Association between hearing impairment and frailty in older adults. Journal of the American Geriatrics Society, 62(6), 1186-8. doi:
10.1111/jgs.12860
14. Ng TP, Feng L, Nyunt MS, Larbi A, Yap KB. (2014). Frailty in Older Persons: Multisystem Risk Factors and the Frailty Risk Index (FRI). Journal of the American Medical Directors Association, 15(9), 635-42. doi: 10.1016/j.jamda.2014.03.008
15. Strawbridge WJ, Shema SJ, Balfour JL, Higby HR, Kaplan GA. (1998). Antecedents of frailty over three decades in an older cohort. The journals of gerontology Series B,
Psychological sciences and social sciences, 53(1), S9-16.
16. Goldberg M, Leclerc A, Bonenfant S, Chastang JF, Schmaus A, Kaniewski N, et al. (2007). Cohort profile: the GAZEL Cohort Study. International journal of epidemiology, 36(1), 32-9. doi: 10.1093/ije/dyl247
17. Morin AJ, Moullec G, Maiano C, Layet L, Just JL, Ninot G. (2011). Psychometric properties of the Center for Epidemiologic Studies Depression Scale (CES-D) in French clinical and nonclinical adults. Revue d'epidemiologie et de sante publique, 59(5), 327-40. doi: 10.1016/j.respe.2011.03.061
18. Alvarado BE, Zunzunegui MV, Beland F, Bamvita JM. (2008). Life course social and health conditions linked to frailty in Latin American older men and women. The journals of gerontology Series A, Biological sciences and medical sciences, 63(12), 1399-406.
20. Matthews. (2004). Use of a questionnaire to screen for frailty in the elderly : an exploratory study. Aging clinical and experimental research.
21. Collard RM, Boter H, Schoevers RA, Oude Voshaar RC. (2012). Prevalence of frailty in community-dwelling older persons: a systematic review. Journal of the American
Geriatrics Society, 60(8), 1487-92. doi: 10.1111/j.1532-5415.2012.04054.x
22. Santos-Eggimann B, Cuenoud P, Spagnoli J, Junod J. (2009). Prevalence of frailty in middle-aged and older community-dwelling Europeans living in 10 countries. The journals of gerontology Series A, Biological sciences and medical sciences, 64(6), 675-81. doi:
10.1093/gerona/glp012
23. Theou O, Brothers TD, Pena FG, Mitnitski A, Rockwood K. (2014). Identifying common characteristics of frailty across seven scales. Journal of the American Geriatrics Society, 62(5), 901-6. doi: 10.1111/jgs.12773
24. Szanton SL, Seplaki CL, Thorpe RJ, Jr., Allen JK, Fried LP. (2010). Socioeconomic status is associated with frailty: the Women's Health and Aging Studies. Journal of
epidemiology and community health, 64(1), 63-7. doi: 10.1136/jech.2008.078428
25. Peek MK, Howrey BT, Ternent RS, Ray LA, Ottenbacher KJ. (2012). Social support, stressors, and frailty among older Mexican American adults. The journals of gerontology Series B, Psychological sciences and social sciences, 67(6), 755-64. doi:
10.1093/geronb/gbs081
26. Sirven N. (2013). Une analyse des déterminants socio-économiques de la fragilité des personnes âgées à partir des données de panel et rétrospectives de SHARE. Document de travail N°52 IRDES.
27. Shamliyan T, Talley KM, Ramakrishnan R, Kane RL. (2013). Association of frailty with survival: a systematic literature review. Ageing research reviews, 12(2), 719-36. doi: 10.1016/j.arr.2012.03.001
28. Bouillon K, Sabia S, Jokela M, Gale CR, Singh-Manoux A, Shipley MJ, et al. (2013). Validating a widely used measure of frailty: are all sub-components necessary? Evidence from the Whitehall II cohort study. Age, 35(4), 1457-65. doi: 10.1007/s11357-012-9446-2 29. Sourial N, Bergman H, Karunananthan S, Wolfson C, Payette H, Gutierrez-Robledo LM, et al. (2013). Implementing frailty into clinical practice: a cautionary tale. The journals of gerontology Series A, Biological sciences and medical sciences, 68(12), 1505-11. doi: 10.1093/gerona/glt053
30. Pijpers E, Ferreira I, Stehouwer CD, Nieuwenhuijzen Kruseman AC. (2012). The frailty dilemma. Review of the predictive accuracy of major frailty scores. European journal of internal medicine, 23(2), 118-23. doi: 10.1016/j.ejim.2011.09.003
31. Wald NJ, Hackshaw AK, Frost CD. (1999). When can a risk factor be used as a worthwhile screening test? Bmj, 319(7224), 1562-5.
Tables and figures
:Table 1. Characteristics of the participants in the GAZEL study in 2012 according to their inclusion in the analysis
Subjects included in the analysis N= 13,128 Subjects excluded from the analysis
because of incomplete frailty assessment in 2012 N=459 Chi-2 test Gender Men 9,683 (73.8%) 334 (72.8%) p=0,635* Women 3,445 (26.2%) 125 (27.2%) Age Mean+/- std 66.8+/- 3.4 67.8+/- 3.4 p<0.001*** <65 years 4,240 (32.3%) 104 (22.7%) p<0.001* 65-70 years 6,046 (46.1%) 212 (46.2%) ≥ 70 years 2,842 (21.6%) 143 (31.1%)
Education Primary or secondary school 2,626 (20.9%) 96 (21.8%) p=0.03* Baccalaureate (professional or
not)
7,586 (60.2%) 283 (64.3%)
Higher level of education 2,385 (18.9%) 61 (13.9%)
Professional status In activity 161 (1.2%) 5 (1.1%) p=0.001**
Retired 11,422 (88.2%) 362 (82.3%)
Retired of EDF-GDF but another professional activity
1,339 (10.3%) 70 (15.9%)
Other 30 (0.2%) 3 (0.7%)
Family situation Married 10,800 (83.2%) 361 (81.9%) p=0.45*
Perceived social situation
Disadvantaged 601 (4.9%) 22 (5.7%) p=0.44*
Normal 9,849 (81.1%) 318 (82.4%)
Comfortable 1,698 (14.0%) 46 (11.9%)
Comorbidity score Mean +/-SD 1.42 +/- 1.0 1.44 +/- 1.0 p=0.64***
Body mass index (kg/m²) ≤18,5 114 (0.9%) 3 (0.7%) p=0.94 ** 18,5-25 5,198 (40.1%) 180 (40.8%) 25-30 5,762 (44.5%) 192 (43.5%) >30 1,884 (14.5%) 66 (15.0%) Tobacco Non-smoker 11,511 (92.2%) 357 (91.1%) p=0.31* Little smoker 595 (4.8%) 25 (6.4%)
Medium - Heavy smoker 370 (3.0%) 10 (2.5%)
Alcohol Abstinent 1,940 (18.4%) 78 (25.9%) p=0.01*
Little drinker 4,714 (44.8%) 120 (39.9%)
Medium drinker 2,746 (26.1%) 76 (25.2%)
Heavy drinker 1,131 (10.7%) 27 (9.0%)
Table 2. Prevalence of reported problems or difficulties in items included in the Strawbridge questionnaire (n=13,128).
Prevalence of problems or difficulties*
Whole sample n=13,128 Men n=9,683 Women n=3,445 Domain I: Physical function and balance 1,357 (10.3%) 792 (8.2%) 565 (16.4%) Experienced a sudden loss of balance 342 (2.6%) 192 (2.0%) 150 (4.4%)
Arm weakness 652 (5.0%) 325 (3.4%) 327 (9.6%)
Leg weakness 655 (5.1%) 413 (4.3%) 242 (7.2%)
Get dizzy when you rise from a seated position 420 (3.2%) 265 (2.8%) 155 (4.5%) Domain II: Nutritive function 256 (2.0%) 145 (1.5%) 111 (3.2%)
Unexplained weight loss 61 (0.5%) 35 (0.4%) 26 (0.8%)
Loss of appetite 230 (1.8%) 128 (1.3%) 102 (3.0%)
Domain III: Cognitive function 1,659 (12.6%) 1,140 (11.8%) 519 (15.1%) Difficulty finding the right word 880 (6.7%) 552 (5.7%) 328 (9.6%)
Difficulty paying attention 358 (2.8%) 238 (2.5%) 120 (3.5%)
Difficulty remembering things 670 (5.1%) 453 (4.7%) 217 (6.3%)
Forget where you put things 888 (6.8%) 618 (6.4%) 270 (7.9%)
Domain IV: Sensory function 5,462 (41.6%) 4,181 (43.2%) 1,281 (37.2%)
Difficulty reading a newspaper 295 (2.3%) 202 (2.1%) 93 (2.7%)
Difficulty recognizing a friend from across the street 377 (2.9%) 248 (2.6%) 129 (3.8%) Difficulty reading signs at night 1,556 (12.0%) 854 (8.9%) 702 (20.6%) Difficulty hearing on the phone 1,219 (9.4%) 957 (10.0%) 262 (7.7%) Difficulty hearing a normal conversation 1,552 (11.9%) 1,295 (13.4%) 257 (7.5%) Difficulty carrying on a conversation in a noisy room 4,694 (35.9%) 3,819 (39.6%) 875 (25.5%)
* Problems or difficulties were defined differently depending on the domain considered: “often” or “very often” for domains I II III and “some difficulty” or “great deal of difficulty” for domain IV.
Table 3. Prevalence of frailty according to age and gender Prevalence of frailtyS+ n=13,128 Chi-2 test Prevalence of frailtyS- n=13,128 Chi-2 test Gender Men 1,254 (13.0%) p<0.001 349 (3.6%) p<0.001 Women 612 (17.8%) 228 (6.6%)
Age Age < 65 years 504 (11.9%) p<0.001 159 (3.8%) p<0.001
Age 65-70 years 834 (13.8%) 244 (4.1%)
Age ≥70 years 528 (18.6%) 174 (6.2%)
FrailtyS+: definition of frailty including sensory domain; FrailtyS-: definition of frailty excluding sensory domain
Table 4. Factors associated with frailty in bivariate and multivariate analysis FrailtyS+ FrailtyS- OR 95% CI aOR 95% CI OR 95% CI aOR 95% CI Gender Men 1 1 1 1 Women 1.45 1.31-1.61 1.65 1.42 - 1.93 1.89 1.60-2.25 2.05 1.61- 2.60 Age <65 years 1 1 1 1 ≥65 and <70 years 1.19 1.05-1.34 1.21 1.03 - 1.42 1.08 0.88-1.33 1.17 0.90 - 1.52 ≥70 years 1.69 1.48-1.93 1.72 1.43 - 2.06 1.69 1.35-2.10 1.72 1.29 - 2.31 Education No baccalaureate 1 1 1 1 Baccalaureate 0.85 0.75-0.96 1.10 0.93 - 1.31 0.86 0.70-1.06 - - Higher education 0.79 0.67-0.93 1.35 1.08 - 1.69 0.74 0.56-0.97 - - Social situation Socially
disadvantaged 2.07 1.71-2.51 1.57 1.21 - 2.04 2.02 1.49-2.74 - - Normal 1 1 1 1 Socially comfortable 0.63 0.53-0.75 0.85 0.68 - 1.07 0.55 0.39-0.75 - -
Body mass index (kg/m²) ≤18.5 2.15 1.40-3.30 2.08 1.19 - 3.63 4.53 2.71-7.54 3.70 1.92 - 7.13 between 18.5-25 1 1 1 1 between 25-30 0.95 0.85-1.06 0.87 0.75 - 1.01 0.91 0.75-1.10 0.96 0.75 - 1.23 >30 1.39 1.20-1.60 0.87 0.72 - 1.06 1.33 1.05-1.69 0.84 0.61 - 1.14 Alcohol consumption Abstinent 1.68 1.45-1.94 1.04 0.87 - 1.25 2.36 1.89-2.96 - - Little drinker 1 1 1 1 Medium drinker 1.10 0.95-1.27 1.03 0.87 - 1.21 0.90 0.69-1.17 - - Heavy drinker 1.65 1.39-1.96 1.61 1.31 - 1.98 1.52 1.12-2.05 - - Depression No depression 1 1 1 1 Depression 5.81 5.18-6.53 3.19 2.73 - 3.73 9.69 8.11-11.59 4.97 3.97 - 6.23
Score of comorbidity 0 1 1 1 1 1 2.02 1.65-2.46 1.58 1.36 - 1.84 1.94 1.31-2.86 1.63 1.26 - 2.10 ≥2 4.26 3.52-5.16 2.02 1.68 - 2.43 5.44 3.76-7.87 2.45 1.85 - 3.26 Self-perceived health Very good 0.30 0.25-0.36 0.40 0.32 - 0.50 0.28 0.19-0.41 0.44 0.29 - 0.69 Good 1 1 1 1 Poor 3.00 2.67-3.37 2.07 1.77 - 2.42 4.55 3.78-5.48 2.42 1.91 - 3.06 Very poor 8.92 6.28-12.66 3.40 2.12 - 5.47 15.97 10.84-23.53 5.92 3.60 - 9.71
aOR: adjusted Odds Ratio
FrailtyS+: frail if 2 impaired domains among physical, nutritive, cognitive and sensory domains
Table 5. Prediction of death, hospitalisation, and onset of difficulties in everyday move according to the frailty definition in the GAZEL cohort
Deatha (n=182) Hospitalisationb (n=479)
Difficulties in everyday movec (n=703) Predictive value aHR [95% CI] Harrell's c aOR [95% CI] AUC aOR [95% CI] AUC By domain (each
domain adjusted for
the others) 0.7906 0.6511 0.7159
Physical impairment 1.76 [1.10-2.82] 1 [0.73-1.37] 3.12 [2.43-4.00] Nutritive impairment 3.59 [2.00-6.47] 1.43 [0.82-2.49] 0.66 [0.35-1.28] Cognitive impairment 0.77 [0.46-1.31] 1.15 [0.86-1.53] 1.36 [1.07-1.72] Sensory impairment 0.90 [0.63-1.28] 1.37 [1.12-1.68] 1.37 [1.16-1.63] According to the frailty
definition
FrailtyS+ 1.43 [0.94-2.17] 0.7753 1.31 [1.01-1.70] 0.6453 2.27 [1.83-2.81] 0.7005 FrailtyS- 2.28 [1.32-3.92] 0.7764 1.26 [0.83-1.90] 0.6418 2.92 [2.04-4.17] 0.6919
aHR: adjusted hazard ratio; aOR: adjusted odds ratio; CI:confidence interval; AUC:area under the curve
FrailtyS+: frail if 2 impaired domains among physical, nutritive, cognitive and sensory domains
FrailtyS-: frail if 2 impaired domains among physical, nutritive and cognitive domains
a
Model adjusted for: age, gender, alcohol and tobacco consumption, cancer, depression, antecedents of hospitalisation in last year and other domains of the Strawbridge for the analysis by domain
b
Model adjusted for: age, gender, socio-professional situation, familial status, depression, HTA, cancer, heart pathologies and others domains of Strawbridge questionnaire for the analysis by domain
c
Model adjusted for : age, gender, lung disease, diabetes, articular or muscular pain,
depression, antecedents of hospitalisation in last year and other domains of the Strawbridge score for the analysis by domain.
Figure 1. Flow chart of the study 20,625 subjects included in 1989
- 1,664 died before 2012 (8.1%)
- 437 were excluded before 2012 (2.1%) - 98 left EDF-GDF before 2012 (0.5%)
18,426 (89.3%) subjects still included in the cohort in 2012
13,587 subjects who returned the questionnaire in 2012 (participation rate = 73.7%)
13,128 subjects included in the study (96.6%)
- 12,118 with data for the entire Strawbridge score (92.3%)
- 940 with data in at least one item of each of the 4 domains (7.2%) - 70 with missing data among the items of the Strawbridge
questionnaire but with at least 2 impaired domains (0.5%)
459 were excluded (3.4%) because of missing data 4839 non-respondents in 2012 (26.3%)