HAL Id: hal-00828025
https://hal.archives-ouvertes.fr/hal-00828025
Submitted on 30 May 2013
HAL is a multi-disciplinary open access archive for the deposit and dissemination of sci-entific research documents, whether they are pub-lished or not. The documents may come from teaching and research institutions in France or abroad, or from public or private research centers.
L’archive ouverte pluridisciplinaire HAL, est destinée au dépôt et à la diffusion de documents scientifiques de niveau recherche, publiés ou non, émanant des établissements d’enseignement et de recherche français ou étrangers, des laboratoires publics ou privés.
Damien Arvor, N. Saint-Geours, S. Dupuy, S. Andrés, Laurent Durieux
To cite this version:
Damien Arvor, N. Saint-Geours, S. Dupuy, S. Andrés, Laurent Durieux. Identifying optimal classi-fication rules for geographic object-based image analysis. XVI Simpósio Brasileiro de Sensoriamento Remoto, Apr 2013, Igauçu, Brazil. p. 2290 - p. 2297. �hal-00828025�
Identifying optimal classification rules for geographic object-based image analysis Damien Arvor1 Nathalie Saint-Geours 2 Stéphane Dupuy 3 Samuel Andrés 1 Laurent Durieux 1 1
IRD - UMR ESPACE DEV 228
500, rue Jean-François Breton, 34093 Montpellier Cedex, France {damien.arvor, laurent.durieux, samuel.andres}@ird.fr
2
IRSTEA - UMR TETIS
500, rue Jean-François Breton, 34093 Montpellier Cedex, France [email protected]
3
CIRAD - UMR TETIS
500, rue Jean-François Breton, 34093 Montpellier Cedex, France [email protected]
Abstract. In Geographic Object-based Image Analysis (GEOBIA), remote sensing experts benefit from a large
spectrum of characteristics to interpret images (spectral information, texture, geometry, spatial relations, etc). However, the quality of a classification is not always increased by considering a higher number of features. The experts are then used to define classification rules based on a laborious "trial-and-error" process. In this paper, we test a methodology to automatically determine an optimal subset of features for discriminating features. This method assumes that a reference land cover map (or at least training samples) is available. Two approaches were considered: a rule-based approach and a Support Vector Machine approach. For each approach, the method consists in ranking the features according to their potential for discriminating two classes. This task was performed thanks to the Jeffries-Matusita distance and Support Vector Machine-Ranking Feature Extraction (SVM-RFE) algorithm. Then, it consists in training and validating a classification algorithm (rule-based and SVM), with an increasing number of features: first only the best-ranked feature is included in the classifier, then the two best-ranked features, etc., until all the N features are included. The objective is to analyze how the quality of the classification evolves according to the numbers of features used. The optimal subset of features is finally determined through the analysis of the Akaike information criterion. The methodology was tested on two classes (urban an non urban areas) on a Spot5 image regarding a study area located in the La Réunion island.
Keywords: GEOBIA, SVM, rule-based approach, Separability, Threshold, feature.
1. Introduction
Since the early 2000s, geographic object-based image analysis (GEOBIA) has appeared as a new paradigm shift in remote sensing image processing. GEOBIA relies on automated methods to partition remote sensing imagery into meaningful image-objects and the assessment of their characteristics to generate new geographic information. In GEOBIA, remote sensing experts benefit from a large spectrum of characteristics to interpret images (spectral information, texture, geometry, spatial relations, etc). However, the quality of a classification is not always increased by inserting a higher number of features due to a phenomenon called peaking, also known as the "Hughes effect" (Bruzzone et al., 2000). Consequently, a good classification must be based on a subset of relevant features identified due to their ability to discriminate the classes of interest. Furthermore, the classification accuracy also depends on the classification method chosen by the expert. Traditionally, the classification in GEOBIA is performed through the definition of rules by experts (e.g. a “vegetation” segment is a segment with a mean NDVI value higher than a threshold). In GEOBIA, this process is usually performed visually by an expert through a laborious “trial-and-error” process. On the one hand, this turns GEOBIA really efficient for interpreting high
resolution images since it allows the user to integrate his expert knowledge in the classification process. On the other hand, the final accuracy of the classification depends too much on the remote sensing expert knowledge, i.e. two experts will define different rules for a same class and thus produce different (but potentially correct) maps. Currently, new classifiers already tested in pixel-based approaches are now considered in GEOBIA. That is especially the case of the Support Vector Machine (SVM) classifier. However, such classifier still requires the user to select the features of interest before performing the classification.
In order to achieve more robust results in GEOBIA, it is necessary to assist the remote sensing expert in its interpretation process by advising him which features to select and which rules to apply. Image Information Mining (IIM) techniques can thus appear useful for rapidly acquiring knowledge on classification rules to map land cover classes. However, as mentioned by Durbha et al. (2010), whereas "earlier efforts were focused mainly on the reduction of features using clustering approaches [...] little was reported on the selection of the best feature subset”. For these authors, such a task should be led by combining predictive-models with feature selection and feature-generation approaches. In this paper, we tested such a combined approach to 1) automatically define features of interest and 2) test different classification methods for discriminating two classes, i.e. urban areas and non urban areas. For each step, we tested two approaches in order to compare a traditional rule-based classification approach with a SVM classification approach.
2. Study area and data
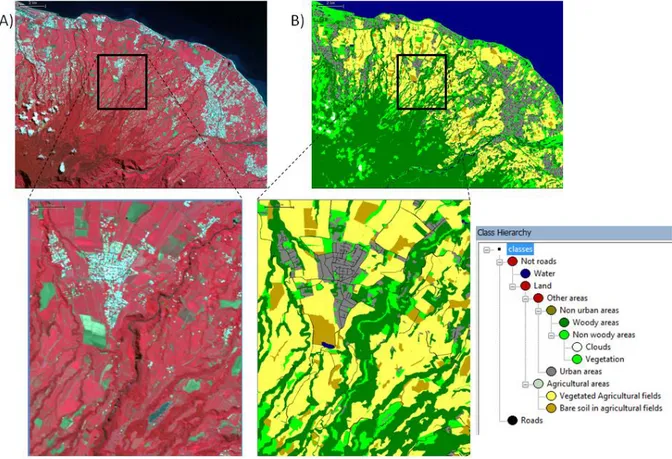
The study area is the La Réunion French island located in the Indian Ocean. This area is concerned with a large variety of landscapes. Especially, the presence of mountains restricts the human occupation to the coastal areas. These areas are thus dedicated to agriculture (especially sugar cane production) but are currently affected by an intense urbanization process, whose monitoring represents an important issue. Remote sensing data have long been considered for their potential to monitor land use changes. Especially, very high resolution images are useful to observe urbanization dynamics. In this paper, we used a SPOT5 image with four spectral bands (MIR, NIR, R, G) at a 10 m resolution and the panchromatic band at 2.5 m. In order to define the best subset of features to discriminate urban an non urban areas, we need a preliminary land cover map for training and validating our approach. Although we should ideally use maps performed through photo-interpretation and/or field campaigns, we here used an already existing land cover map of the study area produced by an expert in Geographic Object-Based Image Analysis (fig. 1). This expert applied a multi-resolution segmentation in eCognition and then identified urban areas thanks to two criteria: 1) the mean value of a contrast texture index computed on 2.5 m panchromatic band is higher than 65 and 2) the NDVI values must be higher than 0.4.
3. Methodology
We propose a method to identify the best subset of features and the corresponding classifier to achieve a complete geographic object-based image analysis. Two approaches are tested and compared: the rule-based approach and the SVM approach. For both approaches, the method proposed for extracting classification rules is based on four main steps. The first step is common and consists in pre-processing the data in order to: i) retrieve polygonal objects from the input classification, ii) extract a number N of features (regarding spectral, textural, and geometrical properties of the objects) for each object based on the corresponding Spot5 image, iii) normalize the data and iv) build a training sample and a validation sample of objects with their associated features, for the two classes of interest. Once data is ready, the second step consists in ranking the N selected features based on their ability to discriminate
the two classes of interest, i.e. urban areas and non urban areas. Two different approaches were tested: one based on separability distance and one based on SVM. The third step consists in training and validating a classification algorithm, with an increasing number of features: first only the best-ranked feature is included in the classifier, then the two best-ranked features, etc., until the N features are included. Both rule-based and SVM algorithms are tested. Finally, the fourth step consists in applying the Akaike information criterion to identify the best subset of feature through an analysis of the quality of the classification according to the numbers of features used.
Figure 1. Input data: A) Spot5 data and B) the corresponding classification obtained though GEOBIA on eCognition (urban areas are in grey).
3.1. Data preparation: Feature extraction, Object selection, Normalization
For each object identified in the input classification, we extracted 26 features about radiometric, texture and geometry. It is noteworthy that features referring to topological relations are not included. The extraction was performed in eCognition. We thus obtained two tables (for the two classes of interest) where each row refers to an object (e.g. polygon) and each column refers to the associated features. At this step, the tables were imported to the R software for further processing. As the classes represented very large numbers of polygons, we randomly selected 1000 objects per class. Furthermore, we then merged both tables in one table and we normalized the data according to the method proposed by Marpu (2006). Finally we divided the table in four subsets of same size (n = 500). Two tables (one for each class) were designed for training the feature ranking and classification algorithms whereas the two other tables (one for each class) were designed to validate the classification algorithms.
Once the datasets were prepared, we applied a procedure to rank features according to their potential for discriminating the two classes of interest. A different algorithm was applied on training data for each approach.
Rule-based approach
In the rule-based approach, we used the SEaTH method proposed by Nussbaum et al. (2006) and Marpu et al. (2006). This method is based on the well-known Jeffries-Matusita (JM) distance applied on single features. It computes the separability distance between two classes for a defined feature. The features are then ranked based on this JM distance.
SVM approach
In the SVM approach, we applied the SVM-RFE (Support Vector Machine Recursive Feature Extraction) method. This algorithm proposed by Guyon et al. (2002) returns a ranking of the features of a classification problem by training a Support Vector Machine (SVM) with a linear kernel and removing the feature with smallest ranking criterion. The svmrfeFeatureRanking function was used in R from package (e1071).
For both approaches, as we randomly selected a predefined number of objects for performing the feature ranking (see step 1 of the method), we are expected to get a certain variability in feature ranking (i.e. two runs give different rankings). To achieve more robustness, we ran the process 100 times. We then analyzed the mean rank for each feature in order to define the final feature ranking.
3.3. Iterative classification
Once the features have been ranked, the issue is to define an optimal combination of features to be used for discriminating two classes. As mentioned by Thomas et al. (1987): « any final assessment of the accuracy of a classification rests upon the classification process itself and not directly upon the separability index selection of appropriate channels ». Thus, searching for the most relevant combination of features must be based on classifications. For this purpose, we trained two classification algorithms (on the training samples) in order to classify the validation samples and thus compare the approaches.
Rule-based approach
In the rule-based approach, we reorganized the training and validation samples according to their potential of separability between the two classes. The features whose JM value was less than 0.5 were discarded as proposed by Marpu et al. (2006). For each remaining feature, we then computed the separability thresholds according to Marpu et al. (2006). For this purpose, we considered the “Urban areas” class as the class of interest (and consequently the “Non urban areas” class as the background class). Finally, we classified the objects based on an “AND” operator that successively applied the thresholds identified to discriminate both classes.
SVM approach
In the SVM approach, we tested the Support Vector Machine (SVM) from the svm function from the same R package as previously mentioned (e1071). For training the classifiers, we firstly only used the best feature that was determined at the feature ranking step. Then, we performed new tests by including each feature, one-by-one according to its potential for discriminating two classes of interest, i.e. its rank. For each combination of features, the classifier was trained and then applied to classify the validation sample.
For both approaches, we computed traditional statistical indices, i.e. overall accuracy and Kappa index, in order to assess the quality of these successive classifications. Here again, the process was run 100 times in order to achieve more robustness (because each classification was affected by variability linked to the training and validation samples randomly selected). The final results then include the mean overall accuracy and kappa values obtained for each successive classification.
3.4. Determining the best combination of features for classification
Once we had robust results on the classification accuracy of each successive classification (including one feature, two features,..., n features). We need to identify the optimum combination of features to reach high quality results. To address this issue, we used the Akaike information criterion that measures the relative goodness of fit of a statistical model. It is used to assess the quality of a classification by considering both the classification accuracy (i.e. the Kappa index) and the number of features required. In other words, the best classification is the one that achieve the best accuracy with the lowest number of feature. Since we have always used a fix sample of 1000 objects (500 objects for each class), we used the AICc formula defined for finite sample sizes (Equation 1) :
(eq.1) (eq.2) where k it he number of features in the model, L is the mean value of the classification accuracy statistics (i.e. Kappa index), and n is the sample size. The lowest AICc value indicates the optimal compromise between the classification accuracy and the subset of features.
4. Results
4.1. Data preparation
The method was applied in order to discriminate two classes, i.e. "urban areas” and "non urban areas" representing 5694 polygons and 20535 polygons, respectively. For each of these polygons, 26 features were extracted in order to build two databases (one per class) that were prepared as mentioned in section 3.2.1. The tables were then merged and normalized. The process was applied 100 times.
4.2. Feature ranking
Rule-based approach
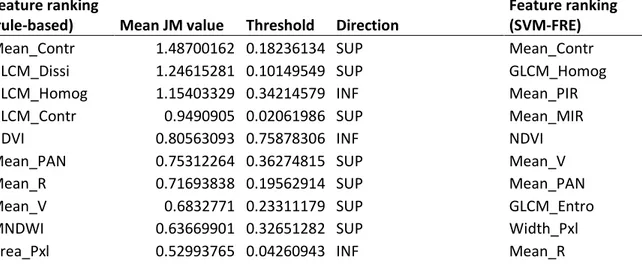
The Jeffries-Matusita separabality distance was computed for each feature on the 100 datasets randomly produced. The mean separabality distance was calculated to get the final ranking (Table 1). Only the features with JM distance higher than 0.5 were considered. The results highlight the importance of the contrast texture index, which confirms the efficiency of the method since this feature was considered by the expert in the input GEOBIA classification. Other important features refer to other textural indices (homogeneity and dissimilarity) whereas the NDVI feature only appears in fifth place.
SVM approach
The SVM-RFE algorithm was applied 100 times to rank the 26 features. We then defined the mean rank of each feature. The results are partly (only the 10 best ranked features) introduced in table 1. As for the separability distance, they highlight the importance of contrast textural index as a main discriminant feature for the two classes considered in this study.
Table 1. Ten best features ranked according to the Jeffries-Matusita separability distance (left part of the table) and by the SVM-RFE method (right part of the table).
Feature ranking
(rule-based) Mean JM value Threshold Direction
Feature ranking (SVM-FRE)
Mean_Contr 1.48700162 0.18236134 SUP Mean_Contr
GLCM_Dissi 1.24615281 0.10149549 SUP GLCM_Homog
GLCM_Homog 1.15403329 0.34214579 INF Mean_PIR
GLCM_Contr 0.9490905 0.02061986 SUP Mean_MIR
NDVI 0.80563093 0.75878306 INF NDVI
Mean_PAN 0.75312264 0.36274815 SUP Mean_V
Mean_R 0.71693838 0.19562914 SUP Mean_PAN
Mean_V 0.6832771 0.23311179 SUP GLCM_Entro
MNDWI 0.63669901 0.32651282 SUP Width_Pxl
Area_Pxl 0.52993765 0.04260943 INF Mean_R
4.3. Iterative classification
Once the features have been ranked, we trained two classifiers for different subsets of features, including features one-by-one according to their ranking, from the highest rank to the lowest rank. The process was run 100 times and the classification statistics were computed (figure 3).
Rule-based approach
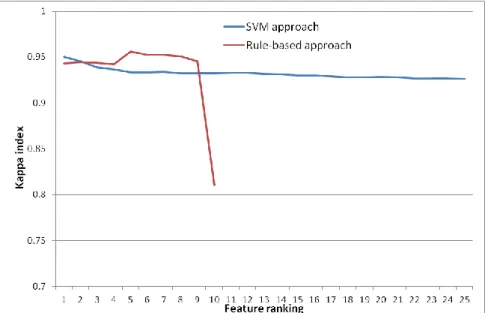
The separability and threshold (SEaTH) methodology allowed us to determine the optimal thresholds and corresponding directions (higher than or less than) for classifying the urban areas. These rules are introduced in table 1. We thus computed iterative classifications including additional rules step-by-step. For instance, urban areas are considered as objects with a mean contrast value higher than 0.18236134 and GLCM_dissimilarity value is higher than 0.10149549, and so on. The successive classifications were validated based on the randomly selected objects for validation. The results are introduced in figure 2 and highlight the efficiency of the method. Indeed, mean Kappa index reach high values (Kappa = 0.9563) after the introduction of the fifth rule regarding the NDVI feature. This is not surprising since the expert GEOBIA classification was indeed based on the mean contrast and NDVI feature. It means that the method was able to find the most efficient rules to discriminate the two classes (although it is noteworthy that the result is biased by the input data used in this study). SVM approach
The SVM classifier also led to good results (mean kappa value > 0.92). However, the best results are obtained by considering only the best ranked feature, i.e. mean contrast texture index. This is an interesting result as it validates the efficiency of the SVM approach to reach high quality results with a few number of features. The fact that the results obtained by the
SVM approach remains lower than the rule-based approach are biased by the fact that the input classification used was based on a rule-based approach. This result should then be considered carefully.
Figure 2. Mean Kappa indices computed based on SVM and rule-based approaches. The x-axis lists the features ranked according to the SVM-RFE approach or the Jeffries-Matusita distance (see table 1).
4.4. Iterative classification
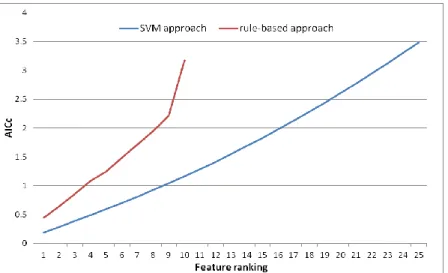
The results of the Akaike information criterion computed on both approaches are introduced in figure 3. The results highlight that, in both SVM and rule-based approaches, the best combination of features considers only one feature, i.e. the mean contrast texture index. It means that the best balance between the number of features to consider and the classification quality is reached with only one feature. Such result was not expected so that the method should be tested on other classes in order to valid the efficiency of the Akaike information criterion to identify the best subset of features.
5. Discussion and conclusion
This paper introduced preliminary results illustrating the global approach used for identifying an optimal subset of features to discriminate classes in GEOBIA. However, the method is not complete at this time and further improvements are required to achieve validating the approach. First, more tests should be carried out with other classes to check for the robustness of the results obtained. Second, the input data used in this study is biased by the fact that the input classification for training was performed based on a rule-based approach performed by a GEOBIA expert. Third, other features such as spatial relations were not considered. Fourth, redundant features could be eliminated (many features are correlated between each other). Fifth, the Akaike information criterion needs to be validated with other tests (we think in using the McNemar test as an alternative to identify the best subset of features). Sixth, the mapping has not been performed (this task is an issue since it would depend on the quality of the segmentation process, which is an important issue in GEOBIA). Seventh, we need to assess if the knowledge extracted from such approach (i.e. the classification rules) can lead to the determination of "visual pattern" of land cover classes and thus improve the semantic description of land cover classes (e.g. a urban area is identified by high values of contrast textural index) in order to formalize them in ontologies. Finally, the
methodology will be tested in the BIO_SOS project. BIO_SOS is a EU-FP7 funded project Biodiversity Multi-Source Monitoring System: From Space To Species (BIO_SOS) focusing on the development of tools and models for consistent multi-annual monitoring of protected areas exposed to human pressures and their surroundings in the Mediterranean and elsewhere (www.biosos.eu).
Figure 3. Evolution of the Akaike information criterion obtained for the SVM and rulee-based approaches.
Acknowledgements
The research leading to these results has received funding from the European Union Seventh Framework Program FP7/2007-2013 under grant agreement n° 263435 for the BIOSOS project.
References
Bruzzone, L.; Serpico, S. A technique for feature selection in multiclass problems. International Journal of
Remote Sensing, v. 21, n. 3, p. 549-563, 2000.
Durbha, S.S.; King, R.L.; Younan, N.H. Wrapper-based feature subset selection for rapid image information mining. IEEE Geoscience and Remote Sensing Letters, vol. 7, n. 1, p. 43-47, 2010.
Guyon, I.; Weston, J.; Barnhill, S.; Vapnik, V. Gene Selection for Cancer Classification using Support Vector Machines. Machine Learning, vol. 46, p. 389-422, 2002.
Korting, R.S.; Fonseca, L.M.G.; Escada, M. I. S.; Silva, F. C.; Silva, M. P. S. GeoDMA - A novel system for spatial data mining. in : IEEE Conference on Data Mining Workshops, 2008.
Marpu, P.R.; Niemeyer, I.; Nussbaum, S.; Gloaguen, R. A procedure for automatic object-based classification. In: Blaschke, T.; Lang, S.,; Hay, G. J. (Eds.). Object-Based Image Analysis. Spatial concepts for knowledge-driven remote sensing applications. Springer-Verlag Berlin Herdelberg, 2008. Cap. 2.4, p. 169-184.
Nussbaum, S.; Niemeyer, I.; Canty, M.J. SEATH - a new tool for automated feature extraction in the context of object-based image analysis. In : 1st International Conference on Object-based Image Analysis (OBIA). Salzburg: Austria, 2006.
Thomas, I.; Ching, N.; Benning, V.; D’Aguanno, J. A review of multi-channel indices of class separability.