HAL Id: tel-01314130
https://tel.archives-ouvertes.fr/tel-01314130
Submitted on 10 May 2016HAL is a multi-disciplinary open access
archive for the deposit and dissemination of sci-entific research documents, whether they are pub-lished or not. The documents may come from teaching and research institutions in France or abroad, or from public or private research centers.
L’archive ouverte pluridisciplinaire HAL, est destinée au dépôt et à la diffusion de documents scientifiques de niveau recherche, publiés ou non, émanant des établissements d’enseignement et de recherche français ou étrangers, des laboratoires publics ou privés.
Imaging the neurodegenerative component of a
demyelinating disorder : multiple sclerosis
Léorah Bosque-Freeman
To cite this version:
Léorah Bosque-Freeman. Imaging the neurodegenerative component of a demyelinating disorder : multiple sclerosis. Neurons and Cognition [q-bio.NC]. Université Pierre et Marie Curie - Paris VI, 2015. English. �NNT : 2015PA066522�. �tel-01314130�
UNIVERSITE PIERRE ET MARIE CURIE
ECOLE DOCTORALE CERVEAU COGNITION COMPORTEMENT
Imagerie de la dégénérescence neuronale dans une
maladie démyélinisante: la sclérose en plaques
Présentée par Léorah Freeman
Thèse de Doctorat, Spécialité Neurosciences
Dirigée par M. le Pr Bruno Stankoff
Présentée et soutenue publiquement le 10 décembre 2015
To my daughters, Maéva and Shoshanah, who bring sunshine to my
rainiest days...
Acknowledgements
This dissertation would not have been possible without many people who have inspired, challenged, supported, and trusted me. To each of them, I would like to express my appreciation and deepest gratitude.
I am incredibly fortunate to have Pr Bruno Stankoff as my advisor. I would like to thank him for shaping my approach to neuroimaging research and for sharing with me his unique insights on MS pathophysiology. His guidance and patience, never condescending and always supportive, have allowed me to not only explore the world of research but to blossom as a scientist.
I don’t think I would be where I am today if it were not for Pr Catherine Lubetzki. Her passion for the cause of MS and the compassion she shows her patients and students have inspired me tremendously. I can’t thank her enough for her support throughout my career and for the opportunities she has opened for me.
I am very grateful to Pr Jerry Wolinsky, who has followed up with me since my first observership in his department and later welcomed me to his lab as a post-doctoral fellow. I am truly indebted to him for taking the time to share with me his clinical and research expertise and for encouraging my independence.
I would like to thank Dr Michel Bottlaender for teaching me about PET imaging and for his critical input.
I would like to thank my colleagues for their contribution to this work and for their words of encouragement, particularly Celine Louapre, Benedetta Bodini, Daniel Garcia-Lorenzo, Laure Bottin, Claire Leroy, and Benjamin Granger.
This work would not have been possible without the neurologists of the MS team, Dr Rana Assouad, Dr Caroline Papeix, and Dr Elisabeth Maillart, the nurses of the Centre d’Investigation Clinique, the PET staff at Service Hospitalier Frederic Jolliot, and our collaborators, Drs Ayman Tourbah and Frederic Dollé.
I am very grateful for the generosity of the agencies who have funded my work: Journées de Neurologie de Langues Française (JNLF), Institut National de la Santé et de la Recherche Médicale (INSERM), and the National Multiple Sclerosis Society (NMSS). I would like to express my heartfelt appreciation to our MS patients who have humbled me and given me purpose.
Life would not have been as delightful without the many friends who have kept me centered. I love you all.
I would like to thank my loving and caring family. Thanks to my dad who truly understands and shares every little bit of excitement I have about what I do, to Danièle for being such a calming and loving presence in my life. Thanks to my sister Taliah, and my mom who always believed in me. Thanks to my in-laws John and Kathy for their constant love and encouragement.
To my husband Travis, thank you for your unfailing love and support, your interest in my work, your understanding of my calling for medicine and research, and above all for the many technical solutions you have provided that have made this work possible!
Table of Contents
LIST OF FIGURES 7
LIST OF TABLES 9
ABBREVIATIONS 10
INTRODUCTION 12
MULTIPLE SCLEROSIS: FROM INFLAMMATION TO NEURODEGENERATION 15
1. GENERALCONSIDERATIONS 16
1.1. EPIDEMIOLOGY 16
1.2. DIAGNOSIS OF MULTIPLE SCLEROSIS 17
1.3. EVOLUTION AND PROGNOSIS 22
2. MECHANISMSOFDISABILITYPROGRESSION 29
2.1. WHITE MATTER DAMAGE 29
2.2. GREY MATTER INVOLVEMENT 36
IMAGING NEURODEGENERATION IN THE MS GREY MATTER 50
1. GREYMATTERATROPHY 51
2. QUANTITATIVEMRI 54
2.1. DIFFUSION TENSOR IMAGING 54
2.2. MAGNETIZATION TRANSFER IMAGING (MTI) 56 2.3. PROTON MAGNETIC RESONANCE SPECTROSCOPY 57
3. POSITRONEMISSIONTOMOGRAPHY 59
2.2. CLINICAL EVALUATION 70
2.3. MAGNETIC RESONANCE IMAGING DATA ACQUISITION 70
2.4. PET ACQUISITION AND QUANTIFICATION 71
2.5. PROCESSING 73
2.6. STATISTICAL ANALYSES 76
3. RESULTS 77
3.1. CHARACTERISTICS OF MS PATIENTS AND HEALTHY CONTROLS 77
3.2. [11C]FMZ BINDING IN THE GREY MATTER 79
3.3. GM ATROPHY IN MS PATIENTS 81
3.4. REDUCED [11C]FMZ BINDING IN THE MSGM 84 3.5. SUBGROUP ANALYSES OF [11C]FMZ BINDING 89 3.6. CORTICAL MAPPING OF [11C]FMZ BINDING CHANGES 91 3.7. RELATIONSHIP BETWEEN [11C]FMZ BINDING AND WHITE MATTER LESIONS LOAD 93 3.8. RELATIONSHIP BETWEEN [11C]FMZ BINDING AND CLINICAL METRICS 94
DISCUSSION & PERSPECTIVES 97
1. INVIVOQUANTIFICATIONOFNEURONALDAMAGEINMS 98
2. CLINICALRELEVANCEOFPETWITH[11C]FMZ 102
3. UNDERLYINGMECHANISMSOFNEURONALDAMAGEINMS 103
3.1. RELATIONSHIP BETWEEN WM AND GM DAMAGE 103
3.2. RELATIONSHIP BETWEEN GM DEMYELINATION AND NEURODEGENERATION 107
3.3. OTHER ASPECTS 110
4. FUTUREROLEOF[11C]FMZPETINMS 114
5. LIMITSOFPRESENTSTUDY 117
CONCLUSION 118
ANNEX 120
1. ANNEXA 121
2. ANNEXB 123
Figures
FIGURE 1: MS LESIONS VISIBLE AS HYPERINTENSITIES ON FLAIR IMAGES. ... 18
FIGURE 2: MRI OF THE BRAIN POST-GADOLINIUM INJECTION IN ONE MS PATIENT ... 19
FIGURE 3: CERVICAL CORD LESION IN MS ON SAGITTAL MRI ... 20
FIGURE 4: CLINICAL PHENOTYPES OF MS ... 23
FIGURE 5: DURATION OF THE 2 PHASES OF MS (FROM LERAY ET AL., BRAIN, 2010) ... 26
FIGURE 6: ILLUSTRATION OF MECHANISM OF ACTION FOR MULTIPLE SCLEROSIS THERAPIES. ... 28
FIGURE 7: [11C]PIB IN MS. ... 31
FIGURE 8: PATHOLOGY AT DIFFERENT STAGES OF THE DISEASE ... 33
FIGURE 9: NORMAL APPEARING WHITE MATTER ON PK11195-PET IMAGES. ... 36
FIGURE 10: DIFFERENT TYPES OF CORTICAL LESIONS IN MS. ... 38
FIGURE 11: IMPROVED DETECTION OF INTRA-CORTICAL LESIONS ... 40
FIGURE 12: NEURONAL LOSS IN TYPE III CEREBRAL CORTICAL LESIONS IN MS ... 42
FIGURE 13: SYNAPTIC LOSS IN DEMYELINATED HIPPOCAMPUS ... 43
FIGURE 14: RETROGRADE AND ANTEROGRADE DEGENERATION ... 45
FIGURE 15: B-CELL FOLLICLE-LIKE STRUCTURES IN MENINGEAL SPACE OF SPMS PATIENT ... 46
FIGURE 16: OXIDATIVE STRESS-RELATED MECHANISMS OF TISSUE INJURY IN MULTIPLE SCLEROSIS ... 49
FIGURE 17: EXAMPLE OF FREESURFER FOR GM VOLUME AND CORTICAL THICKNESS ESTIMATION. ... 52
FIGURE 18: DIFFUSION TENSOR IMAGING. ... 55
FIGURE 19: 1H-MRS ... 58
FIGURE 20: PRINCIPLES OF PET IMAGING. ... 60
FIGURE 21: THE PARTIAL SATURATION METHOD ... 65
FIGURE 22: PARAMETRIC IMAGE OF THE [11C]FMZ BMAX FROM A SINGLE EXPERIMENT... 66
FIGURE 23: STUDY VISITS AND STEPS FROM INCLUSION TO IMAGE PROCESSING. ... 72
FIGURE 24: PROCESSING PIPELINE OF PET AND MRI DATA. ... 75
FIGURE 34: FREESURFER SURFACE-BASED ANALYSES OF [11C]FMZ BMAX ... 92
FIGURE 35: CORRELATION BETWEEN T2 LESION LOAD AND [11C]FMZ BINDING SITES ... 94
FIGURE 36: FREESURFER SURFACE-BASED CORRELATIONS BETWEEN [11C]FMZ BMAX AND PASAT
PERFORMANCE. ... 96 FIGURE 37: CORRELATIONS BETWEEN T2 LESION LOAD AND NAWM FA WITHIN 3 WHITE MATTER TRACTS ... 106 FIGURE 38: PROCESSING STEPS UNDERTAKEN TO ANALYZE AND COMPARE BMAX WITHIN DIR-VISIBLE
CORTICAL LESIONS AND CORTICAL NAGM ... 109 FIGURE 39: COMPARISON OF MEAN [11C]FMZ BMAX IN CORTICAL NAGM AND WITHIN DIR-VISIBLE
CORTICAL LESIONS ... 109 FIGURE 40: ROI ANALYSES OF CEREBRAL BLOOD FLOW ... 112 FIGURE 41: SURFACE-BASED COMPARISONS CBF BETWEEN MS PATIENTS AND HEALTHY CONTROLS. ... 113 FIGURE 42: PATIENTS VS CONTROLS COMPARISONS OF [11C]FMZ, [18F]FDG AND MULTIMODAL MRI
Tables
TABLE 1: 2010 REVISED MCDONALD CRITERIA FOR DIAGNOSIS OF MS (FROM POLMAN ET AL., ANNALS OF NEUROLOGY, 2010) ... 21 TABLE 2: CLINICAL RELEVANCE OF CORTICAL LESIONS USING MRI. ... 40 TABLE 3: DEMOGRAPHIC AND CLINICAL CHARACTERISTICS OF HEALTHY CONTROLS AND MS PATIENTS 78 TABLE 4: CLINICAL MEASURES OF PHYSICAL AND COGNITIVE PERFORMANCE FOR HEALTHY CONTROLS
AND MS PATIENTS. ... 79 TABLE 5: CLUSTERS OF DECREASED CORTICAL [11C]FMZ BMAX IN MS PATIENTS COMPARED TO HC. ... 92
TABLE 6: CLINICAL CORRELATIONS ... 95 TABLE 7: GLM CLUSTERS OF REDUCED CORTICAL [11C]FMZ BMAX IN PATIENTS WITH MULTIPLE
SCLEROSIS ... 96 TABLE 8: GLM CLUSTERS OF DECREASED CBF IN MS PATIENTS COMPARED TO CONTROLS. ... 113
Abbreviations
25-FW 25-foot walk 9-HPT 9-hole peg test
1H-MRS Proton Magnetic Resonance Spectroscopy BBB Blood Brain Barrier
BP Binding potential
BZD Benzodiazepine CBF Cerebral blood flow CDMS Clinically definite MS
CIS Clinically isolated syndrome CL Cortical lesion
CNS Central nervous system CSI Chemical Shift Imaging CWP Cluster-wise p-value DGM Deep grey matter
DIR Double inversion recovery DIS Dissemination in space DIT Dissemination in time DMT Disease modifying therapy DTI Diffusion Tensor Imaging
EAE Experimental autoimmune encephalomyelitis
ECTRIMS European committee for treatment and research in multiple sclerosis EDSS Expanded disability status scale
FDA Food and Drug Administration FDG Fluorodeoxyglucose
FLAIR Fluid attenuated inversion recovery fMRI Functional MRI
FMZ Flumazenil FOV Field of view
FSPGR Fast spoiled gradient recalled echo GA Glatiramer acetate
GM Grey matter
IFN Interferon
MAGNIMS Magnetic Resonance Imaging in MS MMSE Mini mental state examination MRI Magnetic resonance imaging MS Multiple sclerosis
MSFC Multiple Sclerosis Functional Composite MTI Magnetization transfer imaging
MTR Magnetization transfer ratio NAA N-acetyl aspartate
NAGM Normal appearing grey matter NAWM Normal appearing white matter NMO Neuromyelitis optica
NO Nitric Oxide
NODDI Neurite density and orientation dispersion PASAT Paced auditory serial addition test
pCASL Pseudo-continuous arterial spin labeling PET Positron emission tomography
PPMS Primary progressive multiple sclerosis PSIR Phase sensitive inversion recovery RIS Radiologically isolated syndromes RRMS Relapsing remitting multiple sclerosis SDMT Symbol digit modalities test
Introduction
Multiple sclerosis (MS) is the most frequent demyelinating disease of the central nervous system (CNS), affecting about 2 million individuals worldwide. The disease remains a major public health issue as the leading cause of non-traumatic neurological disability among young adults. Significant progress has been made in the past decades to address the inflammatory component of the disease, which has lead to the emergence of more successful disease modifying therapies (DMT) and to better clinical outcomes for patients at least in the early phases of the disease. Yet our picture of MS remains fuzzy at best, and our reach in terms of therapy limited as none of the drugs currently available has been shown to successfully prevent disability progression.
The classical dichotomy between inflammation and neurodegeneration had to be challenged to further our understanding of progression in MS. While inflammatory and demyelinating lesions of the white matter (WM) remain the hallmark of the disease and the most characteristic marker for diagnosis, grey matter (GM) changes and in particular neuronal damage is now thought to play a major role in the neurological decline of MS patients. Recognizing that besides myelin, synapses, dendrites and neurons are early targets of the disease process could have profound therapeutic implications. While this has been suggested in post-mortem tissue samples, further evidence in patients at different stages of the disease is critically needed. Several have tried to measure neurodegeneration in vivo using brain volumetry or non-conventional magnetic resonance imaging (MRI). But these techniques for the most part lack specificity to the neuronal compartment. Thus the development of a new imaging technique able to specifically assess the neuronal component of GM damage in MS patients may have significant impact.
This manuscript will first attempt to present current concepts of WM and GM damage in MS from a histological, immunological and neuroimaging point of view, highlighting the shift from inflammation to neurodegeneration in our understanding of disability progression. We’ll underscore the need for new imaging techniques specific of the neuronal compartment to fully capture the neurodegenerative process and its relevance over the course of the disease. In the second part of this work we will propose PET with [11C]-FMZ as potential marker of neuronal damage in MS by presenting the detailed methods and results of a pilot study conducted in relapsing remitting (RRMS) and secondary progressive MS (SPMS). Finally we will discuss our findings in the context of current and sometimes-conflicting ideas and theories of neurodegeneration in MS. We’ll aim to expand the scope of this work by presenting future avenues of research relevant to our topic.
Multiple Sclerosis:
from
Inflammation to
1.
GENERAL CONSIDERATIONS
Since its first pictorial descriptions by Jean Cruveilhier in his Anatomie Pathologique du
corps humain [1] and Robert Carswell in Pathological Anatomy: Illustrations of the Elementary Forms of Disease [2], followed by its identification and classification as a distinct entity by Jean Martin Charcot, we have come a long way in our ability to diagnose and document the features of la sclérose en plaques. Multiple Sclerosis is now recognized as one of the most common diseases of the central nervous system (CNS), and is a very active field of research.
1.1.
Epidemiology
In a recent review of existing literature, Melcon et al. [3] estimated the median MS incidence at 5.2 (range 0.5-20.6) per 100.000 p-yrs and median prevalence at 112/100.000 pop. Incidence and prevalence were found highest in North America. While low in childhood, MS incidence peaks between 20 and 40 years of age with a mean age of onset of symptoms often found around 30 years [4].
What was thought as a predominantly male disease at the beginning of the 20th century is now known to affect women disproportionately. Sex ratios of about 2-2.5/1 have been frequently reported but could be as high as 4.1 in some US communities [5]. The sex prevalence of MS seems to undergo dynamic changes, with several recent examples of increasing sex ratios. In Denmark, Koch-Henriksen and colleagues reported that the incidence of MS in men had remained virtually the same whereas that of women had doubled since 1970 [6]. This phenomenon may indicate potential environmental changes, not just a better diagnosis of benign cases in women.
MS prevalence varies greatly between continents. As mentioned above, North America was found to have the highest incidence and prevalence in a recent study [3], followed by Europe. In contrast, South and East Asia, South America and North Africa had much lower rates. However the notion of a latitudinal gradient suggested by early epidemiologic studies is now being increasingly questioned as genetic and
environmental factors are thought to play a key role over geography in the prevalence and incidence of MS. Of particular interest, lower circulating levels of vitamin D have been associated with a higher risk of MS [7] [8]. It has also been shown that vitamin D levels are inversely associated with clinical relapses and MRI activity in MS patients [9]. Other environmental factors such as cigarette smoking [10] and Epstein-Barr virus infection [11] have been identified.
1.2.
Diagnosis of Multiple Sclerosis
1.2.1. Clinical features
Initial presentation can greatly vary from patient to patient. Common presenting symptoms include: optic neuritis, brainstem or spinal cord manifestations or in less frequent instances hemispheric symptomatology. In up to one fourth of cases, symptoms at presentation may be multifocal [12]. When a patient presents with symptoms suggestive of WM tract damage, the exclusion of an alternate diagnosis is imperative before a diagnosis of MS can be made. Such diagnosis will then rely on the demonstration of “dissemination in space” (DIS), and “dissemination in time” (DIT) based on clinical grounds alone (clinically definite MS or CDMS) or a combination of clinical and radiological findings.
A “relapse” is defined as “patient-reported symptoms or objectively observed signs typical of acute inflammatory demyelinating event in the CNS […] with duration of at least 24 hours, in the absence of fever or infection” [13]. Based on the McDonald criteria of the International Panel on Diagnosis of MS, initially published in 2001 [14],
1.2.2. Magnetic Resonance Imaging
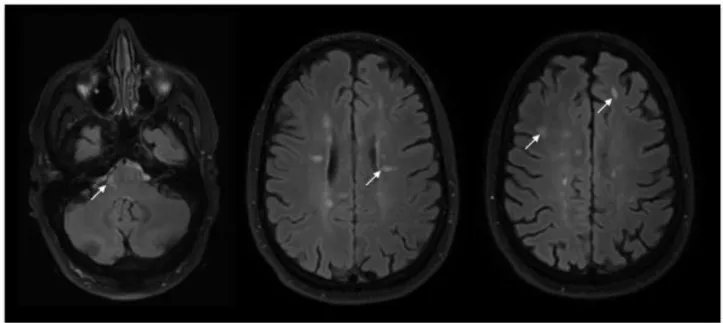
MRI is currently the most useful paraclinical tool for the diagnosis of MS. MS white matter plaques, the pathological hallmark of the disease, can be detected with great sensitivity particularly on T2-weighted or Fluid attenuated inversion recovery (FLAIR) sequences. Their objective presence on MRI is considered an essential requirement for the diagnosis of MS. These lesions are often periventricular with a characteristic ovoid shape, but can also be seen in juxtacortical or infratentorial areas (Figure 1).
Figure 1: MS lesions visible as hyperintensities on FLAIR images. Left: Infratentorial lesion found in the pons (arrow). Middle: numerous periventricular lesions, some of which have classic ovoid shape (arrow). Right: subcortical lesions in frontal areas (arrows).
MRI lesions enhancing after injection of Gadolinium (Figure 2) reflect active inflammation and breakdown of the blood-brain barrier (BBB) and are thus considered more recent (≤3 weeks on average).
Figure 2: MRI of the brain post-gadolinium injection in one MS patient. Periventricular lesions are seen as hyperintense foci on Flair image (left). Recent area of inflammation enhances after gadolinium injection on T1-weighted scan (right)
Spinal cord lesions have been reported in up to 90% of MS patients [16] and asymptomatic lesions have been detected in up to one third of patients presenting with a demyelinating event suggestive of MS. Spinal cord MRI at time of diagnosis can thus be useful to demonstrate DIS of the disease process. Spinal cord lesions, however, much less frequently present with contrast enhancement and are therefore rarely useful for demonstration of DIT. It is currently not recommended to perform follow-up spinal MRI in CIS patients, as it seems to have limited value [17]. However, it is important to perform spinal MRI for differential diagnosis in patients presenting with symptoms suggestive of spinal cord demyelination [18]. Compressive myelopathy can easily be
Figure 3: Active cervical cord lesion in MS on sagittal MRI. Lesion is visible as T2 hyperintensity (left) and enhances after Gadolinium injection on T1-weighted scan (right). MS lesions typically extend over <2 vertebral segments.
While earlier diagnostic criteria using MRI were based on lesion number [19], revised and simplified criteria by Swanton and colleagues now focus on lesion location (periventricular, juxtacortical, infratentorial, spinal cord) for demonstration of DIS [20]. Confirmation of DIT can be achieved on a single MRI with presence of enhancing and non-enhancing lesions, or otherwise by detection of additional lesions on follow-up scans. The revised McDonald criteria have the clear objective of allowing early diagnosis of MS in patients presenting with typical symptoms of CNS demyelination. Still, the risk of over-diagnosing MS remains real and as the Magnetic Resonance Imaging in MS (MAGNIMS) committee recently recommended: “MRI scans should be interpreted by experienced readers who are aware of the patient’s clinical and laboratory information” [17].
1.3.
Evolution and prognosis
1.3.1. Clinical phenotypes
Clarity and consistency in defining clinical phenotypes is essential for demographic studies, clinical trials and management of therapy in clinical practice. Newly revised classification proposed by Lublin and colleagues [21] recommends that patient phenotype be assessed on clinical grounds with input from imaging studies when needed. According to the new consensus, 3 disease phenotypes can be defined: clinically isolated syndrome, relapsing-remitting disease, and progressive disease including primary progressive and secondary progressive.
Clinically Isolated Syndromes (CIS) refer to the initial clinical presentation of the disease in patients with symptoms typical of demyelination of the CNS WM tracts, but who fail to show evidence of dissemination in time of the disease process. Patients with CIS may “convert” to definite MS if they meet criteria for DIS and DIT on clinical or radiological grounds.
A majority of patients diagnosed with definite MS will follow a relapsing remitting (RR) disease course characterized by exacerbations (relapses) with periods of clinical stability in between. Patients may recover fully or partially from relapses (figure 3-top). On the opposite end of the spectrum, 15% experience a gradual worsening from onset with no initial exacerbations (primary progressive course, figure 3- bottom)
Patients with an initial RR form of the disease may subsequently experience progression independently of relapse activity. This phenomenon is called secondary progression (SP, figure 3-middle). It is important to note that progressive disease (SPMS or PPMS) does not progress in a uniform fashion and patients may experience periods of relative clinical stability.
Assessment of disease activity may provide insights into individual prognosis and guide patient management. Thus, current consensus recommendations have included disease activity as a modifier of basic phenotype courses mentioned above. Clinical activity is defined by relapses or radiological activity (presence of contrast-enhancing lesions, new or unequivocally enlarged T2 lesions).
Figure 4: Clinical phenotypes of MS: Relapsing Remitting MS (RRMS, top) without (left) and with (right) accumulation of neurological deficits, Secondary progressive MS (SPMS, middle) without (left) or with (right) clinical exacerbations and primary progressive MS (PPMS, bottom) with linear course (left) or periods of relative stability (right).
With widespread availability of MRI, we have seen an increase in incidental abnormal findings. Radiologically isolated syndromes (RIS) are defined as MRI findings suggestive of MS in persons without typical MS symptoms and with normal neurological findings. This entity was recently introduced in the phenotypic description by Lublin et al. [21]. RIS individuals often have brain MRI performed for reasons such as headaches [22]. Okuda et al. [23] proposed a formal definition of RIS. The RIS Consortium recently presented the results of a retrospective study of 451 RIS subjects from 22 databases in 5 countries [24]. This study showed that 34% of RIS individuals would develop an initial clinical event within 5 years of RIS diagnosis. Age < 37 years, male sex, and spinal cord involvement appear to be the most important independent predictors of
1.3.2. Prognosis and prediction
It is important to understand clinical phenotypes as a dynamic process. Patient with CIS may convert to RRMS, and patients with RRMS may subsequently follow a SP course. Brownlee et al. [25] followed 157 patients with CIS over 6 years: 71 (45%) had a second attack and thus developed clinically definite MS, 36 (23%) had MRI-only MS, and 50 (32%) didn’t have MS according to 2010 McDonald criteria at the end of the follow-up period. Several independent risks factors for conversion to MS have been identified: young age [26], presence of cognitive impairment at onset [27], genetic factors such as HLA-DRB1 [28], and vitamin D deficiency [8]. One of the most significant predictors of conversion to MS from CIS is the presence of brain abnormalities on baseline MRI [29], with number, location and activity of the lesions all providing prognostic information. While relapses may have unforgiving consequences in rare cases, the socio-economic impact of the disease is driven by the increasing and unrelenting disability progression that can follow the RR phase. Scalfari et al. recently provided a review of the London Ontario MS database [30], which evaluated 806 patients annually or semi-annually for 28 years (shortest follow-up=16 years). None of the patients received DMTs. At the end of the study period, 66.3% of patients had developed a SP course. The authors demonstrated that the rate of conversion to SPMS increases proportionally to disease duration. However they highlighted the fact that individual prognosis was highly variable. About 25% of patients will become progressive within 5 years of onset of the disease, while on the opposite end of the spectrum, 25% of patients will remain RR at 15 years. This natural history study confirmed previous findings suggesting that male sex [31] and older age of onset [32] were significant risk factors for conversion to SPMS. The role of early clinical activity in the probability and latency of secondary progression remains debated. Annual relapse rates are today the primary endpoint of many controlled clinical trials, and some have argued it could be used as a surrogate for disability progression [33]. Total relapse numbers were however found to have no or little significant effect on the risk of progression, the latency to onset of the SP phase or attainment of high disability levels [34] [35].
Beyond conversion to SP course, physical disability in the clinical setting or in research trials can be assessed using the Expanded Disease Severity Scale (EDSS, Annex A). This scale quantifies disability in eight functional systems (FS). These ratings are then used in conjunction with observations and information concerning gait and use of assistive devices to rate the EDSS from 0 (normal neurological examination) to 10 (death due to MS). In a recent publication [36], Tintore et al. performed multivariate analyses incorporating not only demographic and clinical data but also MRI and biological variables to determine the risk of attaining EDSS= 3.0 in individual patients. Their comprehensive work on a prospective cohort of 1015 patients with CIS highlights the importance of radiological and biological metrics to more accurately assess early risk of disability. They found that oligoclonal bands in the cerebro-spinal fluid (CSF), as well as the presence of over 10 lesions on baseline MRI were associated with a higher risk of accumulation of disability (up to EDSS= 3.0) with adjusted hazard ratios of 2.0 (95% CI 1.2–3.6) and 2.9 (95% CI 1.4– 6.0). In a presentation at the latest ECTRIMS meeting (Barcelona, 7-10 October 2015), the authors presented a more dynamic prediction model, which included not only baseline metrics but also data acquired at one year after CIS diagnosis. Again, MRI metrics such as new T2 lesions at 1 year were identified as relevant prognostic markers that modified baseline risk score at 12 months. The inclusion of dynamic variables improved risk prediction, with a reasonable C-statistic of 0.75. The model however was not designed to predict the risk of disability beyond EDSS=3.0 or the risk of entering a secondary progressive course.
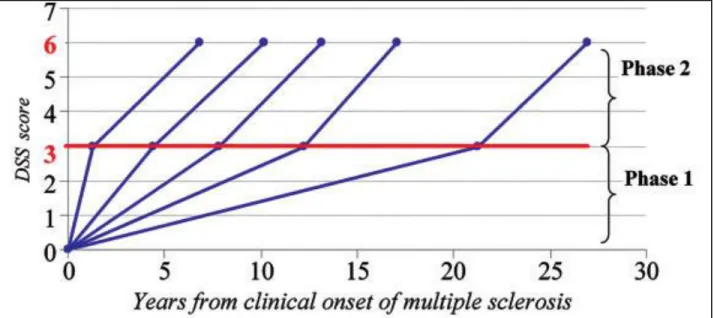
Beyond the early stages of the disease, focal MS pathology appears less relevant to disease progression. Particularly, once a threshold of disability is reached, progression may not be influenced by relapses either before or after onset of the SP phase [37]. Leray and colleagues [38] proposed the concept of MS as a 2-stage disease. The early phase is
found to be highly variable while the duration of the late phase was remarkably constant, as illustrated in figure 5. The dissociation between the 2 phases of MS, with different underlying mechanisms, is supported by MRI evidence. Calabrese et al. followed RRMS patients with at least 5 years of clinical history (mean>10 years) and showed that at this stage, variables such as T2 lesion volume did not influence the risk of entering the secondary progressive phase of the disease [39].
Figure 5: Duration of the 2 phases of MS (from Leray et al., Brain, 2010). Disability progression during Phase 2 (mean time from EDSS 3 to EDSS 6) in five subgroups defined according to the duration of Phase 1 (mean time from MS clinical onset to EDSS 3) in 718 MS patients who have reached both EDSS 3 and EDSS 6.
Patient prognostication is a complex and dynamic task in MS, as different clinical, radiological and biological factors can influence outcome depending on the disease stage. This reality reflects the variety of pathological mechanisms thought to underpin disability progression in MS, which will be discussed in a later section
1.3.3. Disease-modifying therapies available in 2015
The last 20 years have seen the emergence and systematic use of DMT in MS. There are currently 13 FDA-approved therapies with many more emerging drugs under trial or consideration. Available DMTs primarily target the inflammatory process of the disease and their mechanisms of action are illustrated in figure 4.
This major development in the MS therapeutic arsenal has almost exclusively benefitted patients with RRMS. All currently approved therapies have been shown to prevent, with varying degrees of efficacy, exacerbations and new brain T2 and Gadolinium enhancing lesions in RRMS. When studied in CIS, first line injectable immunomodulators such as glatiramer acetate (GA) or interferons (IFN) also reduced the risk of conversion into clinically definite MS [40].
The notion of “sustained disability progression”, as used in RRMS clinical trial outcomes is defined as a worsening of EDSS performance that persists for 3 to 6 months. As noted by Lublin et al. [21], worsening in RRMS can occur in the context of multiple attacks, poor recovery after severe exacerbation or true onset of a progressive phase. Kalincik et al., recently suggested that disability outcomes of clinical trials based on 3-6 months “confirmed disability progression” overestimate the accumulation of permanent disability by 30% [41]. Consequently reported effects on “sustained disability progression” may not reflect actual efficacy on the accrual of disability occuring independently of relapse activity. In fact, when tested in SP or PPMS, none of the currently available therapies have demonstrated any effect in slowing progression or reversing disability, leaving about half of the MS patient population with a sense of neglect and frustration.
Figure 6: Illustration of mechanisms of action of currently available or in-trial MS therapies. APC = antigen presenting cell, BBB = blood–brain barrier, C5b-9 = complement complex 5b-9, CNS = central nervous system, FasL = Fas ligand, GA = glatiramer acetate, IFN = interferon, MHC I = major histocompatibility complex I, NO = nitrous oxide, Nrf2 = nuclear factor (erythrocyte derived) related factor 2, S-1-P1 = sphingosine-1-phosphate 1, TCR = T cell receptor, VCAM-1 = vascular cell adhesion molecule 1, VLA-4 = very late antigen 4. From Broadley et al., Journal of Clinical Neuroscience, 2014 [42].
2.
MECHANISMS OF DISABILITY PROGRESSION
2.1.
White matter damage
2.1.1. Focal demyelination and inflammation
The pathological hallmark of the disease is the formation of WM plaques of demyelination. Clinical relapses are considered the physical expression of these WM lesions. In the early stages of the disease, active WM tissue demyelination within plaques is associated with significant inflammation, BBB damage and microglial activation. Inflammatory infiltrates composed of clonally activated CD8+ T-lymphocytes and to a lesser degree CD4+ T-lymphocytes and B-cells are characteristically detected around post-capillary venules or scattered throughout the brain parechyma. Data suggest that the extent of T- and B-cell infiltration correlates with the degree of demyelination in focal active lesions [43]. Remyelination can occur in MS lesions. This process is particularly stable and extensive in animal models of the disease, but more limited in a majority of MS patients. A study of 168 WM lesions showed that only 22% were completely remyelinated as “shadow plaques”, 73% partially remyelinated and 5% completely demyelinated [44].
Axonal transection, also a prominent feature of acute and active lesions, appears related to local inflammatory changes [45] [46]. Several factors may contribute to axonal transection during acute inflammatory injury of the WM. Activated T-cells may initiate a pro-inflammatory cascade resulting in the production of interferon gamma, which will subsequently activate macrophages to produce nitric oxide (NO). NO is a potent
Focal damage to the WM can be particularly well appreciated using MRI. T2-weighted sequences can detect WM plaques with great sensitivity. Beyond the diagnostic process, MRI can help detect subclinical disease activity by the presence of contrast-enhancing lesions or presence of new/enlarging lesions on subsequent scans. These markers of disease activity are particularly useful to the clinician to evaluate response to therapies which currently target the inflammatory process of the disease. Treatment non responders, or suboptimal responders, in whom a change of therapy should be considered, can thus be identified [17]. However, as we have seen earlier, MRI studies fail to show significant correlations between focal WM demyelination and inflammation and severity of progression, especially once the patient reaches a certain threshold of disability [48] [49] [39] [38].
To this day, conventional MRI cannot differentiate WM lesions that are fully or partly remyelinated from fully demyelinated ones, though this may be of importance in our understanding of the impact of WM lesions. Indeed, experimental studies have established that remyelination may promote short-term neuronal function recovery and help prevent subsequent axonal degeneration, possibly via trophic effects of axon-myelin interactions [50]. At the patient population level, studies of post-mortem tissue have shown diversity in the amount of remyelination between MS cases independently of the disease stage [51]. A patient may thus exhibit extensive or low remyelinating capacity. This was further confirmed by PET study of MS patients using radiotracer [11C]PIB, a thioflavine derivative sensitive to changes in myelin content in tissue (figure
7) [52]. We recently longitudinal follow-up of MS patients with [11C]PIB PET to support
the notion of a patient-specific “remyelination profile”. We demonstrated that patients’ dynamic remyelination potential was strongly associated with clinical scores (Bodini et al., manuscript in revision), bringing novel insights on the role of WM lesions in MS pathophysiology.
Figure 7: [11C]PIB in MS. The uptake of [11C]PIB is lower in MS lesions compared with normal-appearing white matter in patients with MS, suggesting the presence of demyelination. (A) T1-weighted image and (B) corresponding map of [11C]PIB PET binding in a patient with MS, showing lower [11C]PIB uptake in the GM in general compared with WM and lower uptake in a MS lesion (arrow head) compared to normal-appearing WM. (C) Coregistration of images shown in (A) and (B). (D) Time–activity curve of the normal-appearing WM (red) and the lesion seen in (A) (blue). PIB=thioflavine-T derivative 2-(40-methylaminophenyl)-6-hydroxybenzothiazole.
of contrast-enhanced lesions and new/expanding T2 lesions on MRI, which become poor markers of evolution at this stage.
A characteristic feature of progressive MS is diffuse pathology of brain tissue, outside of focal lesions. Abnormalities have been described in the so-called “normal-appearing WM” (NAWM), ie WM tissue that appears normal both on macroscopic examination and MRI [55]. Pathologically, almost 75% of macroscopically normal white matter samples have been found histologically abnormal [56]. Areas of “dirty-appearing WM” (DAWM) have also been characterized on MRI as having an intensity higher than that of the NAWM, but lower than focal lesions. DAWM can be found in direct proximity of focal lesions or in locations not related to WM lesions and may represent a separate pathologic entity [57].
Pathology of the normal appearing white matter (NAWM) has been well described by post-mortem studies and has been found to differ significantly from that of early focal WM plaques. Kutzelnigg et al. analyzed 52 post-mortem MS brains at different stages of the disease and provided a clear picture of the diffuse pathology affecting the WM [58] (figure 8). The authors reported a global reduction in myelin staining in the NAWM due to decreased fiber density as well as diffuse axonal injury, which is most significant in the progressive MS cases compared to RRMS or acute MS. Axonal pathology is evident by the presence of axonal swellings, axonal end-bulbs and degenerating axons throughout the WM. It may be of importance to note that axonal degeneration is increased around MS lesions and in tracts emerging from plaques. Inflammation is also diffuse at the later stages of the disease and consists of perivascular cuffs of mononuclear cells and diffuse tissue infiltration by T-lymphocytes. Scattered microglial activation is another significant component of NAWM pathology and is profound at the later stages of the disease. Activated microglia, while present diffusely in the NAWM, tend to aggregate in the periplaque of slowly expanding, also called smoldering, lesions where it is associated with ongoing axonal injury [53]. Microglial cells are the resident macrophages of the CNS and can be activated following tissue injury [59]. They can then adopt diverse phenotypes, either protective or driving the degenerative process of the disease. Studies in animal models of MS have suggested that blood-borne monocytes, morphologically indistinguishable from resident microglia, may also infiltrate the brain parenchyma and play an important role in potentiating axonal degeneration [60].
Finally, meningeal inflammation, present at all stages of the disease, may influence the extent/topography of diffuse white matter damage.
Figure 8: Pathology at different stages of the disease, acute MS (AMS), RRMS, PPMS and SPMS. White matter plaques (green) dominate the disease process in AMS and RRMS, while diffuse WM inflammatory infiltration (blue dots) and GM pathology (orange) are prevalent in PPMS and SPMS. From Kutzelnigg et al., Brain, 2005.
Few post-mortem studies have specifically focused on the DAWM as a separate entity from the NAWM. Moore et al. described a loss of myelin phospholipids that appeared intermediate between NAWM levels and that of focal plaques [61]. Seewann et al. reported in a larger number of subjects significant reduction of myelin density,
degeneration) [57]. Chronic demyelination in these areas may also imply loss of myelin trophic support, as suggested by evidence of axonal degeneration associated with genetic ablation of myelinating oligodendrocytes in animal models [50]. Loss of myelin staining in the NAWM however appears related to loss of fiber rather than primary demyelination. Recent studies in animal models have suggested that oligodendroglia may support axonal integrity through myelin-independent mechanisms. Impairment of these mechanisms may induce axonal damage without considerable demyelination. In particular, transport of lactate mediated by MCT-1 appears crucial to maintain axon function and survival [62]. Such axo-oligodendrocyte coupling may be particularly relevant when axons are energy-deprived [63].
By definition, NAWM is difficult to characterize using conventional MRI techniques such as T1- or T2-weighted sequences. MRI studies have used non-conventional imaging methods to assess the chonology of diffuse WM changes and the impact these changes can have on disease and disability progression. These advanced techniques include diffusion tensor imaging (DTI), magnetization transfer imaging (MTI) or Proton Magnetic Resonance Spectroscopy (1H-MRS). Quantitative MRI studies have shown that diffuse WM changes are present from the early stages of the disease [64] and increase significantly over time. MRI studies have supported post-mortem evidence of NAWM damage occuring independently from focal damage [58] [65]. DAWM quantitative MRI measures, as reported by Vrenken et al., are intermediate between values of the NAWM and that of focal lesions [66].
MTI is a technique that is sensitive to microstructural changes in MS and its main metric, magnetization transfer ratio (MTR) is affected by myelin content and possibly axonal loss in post-mortem tissue [67]. Liu et al. found not only a significant decrease in MTR in the NAWM of MS patients compared to controls, but the authors were able to detect a clearly greater disease effect close to the ventricles [68]. It had already been shown that MS lesions are also more likely to occur around the ventricles [69]. Several factors could account for this pattern. Diffusion of CSF-mediated factors related to levels of meningeal inflammation has been suggested. CSF from MS patients has been shown to impair oligodendrocyte progenitor cells [70] as well as neuro-axonal function [71]. Decreased oxygen availability could also account for these findings as periventricular white matter is particularly prone to hypoperfusion in MS [72].
Metabolic neuro-axonal function can be assessed in the MS WM by evaluating N-acetyl-aspartate levels using Proton Magnetic Resonance Spectroscopy (1H-MRS). The extent of NAA reduction within the NAWM at the early stages of the disease was found to correlate with subsequent cognitive deficits [73]. These results echo similar findings using MTI [74] and support the concept of a disconnection syndrome as an underlying mechanism of cognitive disability in MS.
PET imaging, using new tracers able to detect activated microglia and macrophages in vivo, has the potential to better our understanding of the role of diffuse microglial infiltration in disability progression. The translocator protein receptor (TSPO), a protein complex expressed by the outer mitochondrial membrane, is upregulated in activated microglial cells and macrophages, while maintaining low levels of expression in the brain parenchyma. These properties have encouraged the use of TSPO as a target for PET tracers. Compounds such as [11C]PK11195, [11C]PBR28 [75] or [18F]DPA714 [76] all bind specifically to the TSPO complex, with different levels of affinity. Studies conducted using [11C]PK11195 have found a significant increase in tracer uptake in widespread areas of periventricular and subcortical WM [77] suggesting diffuse infiltration by activated microglia at the SPMS stage of the disease. This technique was also able to detect the active inflammatory rim of chronic smoldering plaques. Giannetti et al. demonstrated the clinical significance of widespread microglial activation, showing that this phenomenon was detectable using PET with [11C]PK11195 in the NAWM of patients with CIS and more pronounced in those who later developed CDMS (figure 9) [78].
Figure 9: Normal appearing white matter on PK11195-PET images co-registered with MRI in three study subjects. The first subject is a healthy control (A) with PK11195 binding potential (BPND) in NAWM of 0.028; the second is a CIS subject without T2 MRI lesions (B), an EDSS score of 3.5 and PK11195 BPND in NAWM of 0.037; the third is a CIS subject with T2 MRI lesions (C), EDSS = 2.0 and PK11195 BPND in NAWM of 0.136. The color scale bar represents the BPND of PK11195. From Giannetti et al., Brain, 2015 [78].
2.2.
Grey matter involvement
As studies have been limited in their ability to correlate neurological disability to focal WM pathology, the focus shifted not only to diffuse WM abnormalities but also to the possibility of associated GM damage. GM involvment in MS has perplexed scientists for many decades. Dawson’s question “Is then, the process that attacks the cortex different in its nature and origin from that which affects the rest of the central nervous system?” still resonates, though histopathological and neuroimaging studies have provided great insight into the nature, extent and chronology of GM pathology in MS.
2.2.1. Grey matter demyelination
Unlike WM lesions, demyelination of cortical neurons is not visible macroscopically in post-mortem samples. In their seminal study, Brownell and Hughes (1962) [79] showed that about 22% of all brain lesions were located at least partly in the cerbral cortex and an additional 4% in the deep grey matter (DGM) structures. Improvement of immunocytochemical staining of myelin proteins has allowed more reliable investigation of GM demyelination, which has proven even more extensive than initially suspected. Recent pathological studies reported that the extent of GM demyelination often exceeds that of the WM in progressive patients [80], reaching up to 68% in extreme cases [58]. Grey matter demyelination is particularly extensive in the spinal cord, cerebellum, cingulate gyrus [80], thalamus [81] and hippocampus [82], regions that are of particular relevance to MS symptomatology, both physical and cognitive. Some have suggested that GM demyelination could, by impacting neuronal gene expression, reduce function in affected areas [82].
Lesions found in the MS grey matter differ strikingly from their WM counterparts. Lymphocyte infiltration, complement deposition, and BBB disruption, all typical pathological hallmarks of WM lesions, are not usually found in cortical lesions (CLs). Different types of CLs (figure 10) have been described according to their location and extent and include: leukocortical, intracortical and subpial [83] [84]. Leukocortical lesions consist of WM lesions which extend into the GM. Intracortical lesions project along vessels within the cortical ribbon. Subpial lesions are bandlike plaques which extend from the pial surface into the cortical layer 3 or 4 and can involve several gyri. In DGM structures, lesions are more often mixed GM/WM lesions (about 60%) [81], whereas subpial lesions are more frequent at the cortical level.
Figure 10: Different types of cortical lesions in MS: leukocortical (a), intracortical (b) and subpial (c). (d) highlights the extensive nature of subpial demyelinating lesions which can extend over several gyri. From Calabrese et al., Nature Reviews Neuroscience, 2015 [85].
At the earliest stages of the disease, leukocortical lesions were found to be the most frequent and inflammatory in nature [86], with predominantly perivascular CD3+ and CD8+ T-cell infiltrates and less commonly B-cell infiltrates. These differ from cortical lesions found at the latter stages of the disease, which are more frequently subpial and less inflammatory. Whether inflammation is a prerequisite to GM demyelination still remains unsettled.
It has been hypothesized that GM demyelination, and in particular subpial lesions, could be due to a myelinotoxic factor diffusing from the meninges. Subpial cortical lesions are often topographically related to mononuclear inflammatory infiltrates of the meninges in both early and late-stage MS [58] [86]. The presence of these meningeal
B-cell follicles has been associated with more extensive cortical damage and a more severe disease course [87].
The development of new MRI techniques sensitive to GM demyelination has allowed us to appreciate the clinical relevance of these lesions from the early stages of the disease. Sequences such as double-inversion recovery (DIR) or phase-sensitive inversion recovery have improved the detection of such lesions, and can be implemented on clinical grade scanners (figure 11). Although MRI techniques have become more sensitive to cortical demyelination, many cortical lesions remain undetected using MRI, especially with sequences available for routine practice. At 1.5T, only 18% of cortical lesions are detected when compared to histopathology [88] Higher field strength or combination of sequences can improve detection [89] [90] [91] [92]. Jonkman and colleagues recently reported that T2-weighted sequences at ultra-high field (7T) allowed prospective detection of 28% of cortical lesions [93]. Visualization of band-like subpial lesions still remains challenging [94] and availability of such techniques is currently limited. It is thus only the “tip of the iceberg” that can be seen and quantified using new MRI techniques [95]. But this “tip of the iceberg” still holds clinical significance. MRI measures of cortical demyelination have shown that GM lesions play an important role in physical and cognitive deficits (table 2). Cerebellar cortical lesion load also correlates with cerebellar function.
The potential contribution of CLs to the diagnostic process was recently suggested by Filippi et al. [96]. The authors found that the presence of at least one CL on baseline DIR MRI improved the identification of patients with CIS at risk of converting to CDMS. The applicability of new criteria of DIS which would include the presence of CLs remains to be further explored, especially considering the high false positive detection of CLs [88] [93] despite established consensus scoring recommendations [97].
Figure 11: Improved detection of intra-cortical lesions (white arrow) using phase sensitive inversion recovery (PSIR, left) in combination with double inversion recovery (DIR, middle), compared to conventional fluid attenuated inversion recovery (FLAIR, right). Images kindly shared by Dr Flavia Nelson, Associate Professor of Neurology at the University of Texas, Medical School at Houston.
Study Patients Technique Findings
Harrison et al.,
2015 [98] 30 RRMS/ 6 SPMS 7T, MPRAGE and MPFlair - CL volume correlates with EDSS more robustly than WM lesions. - CLs also associated with cognitive
performance Favaretto et al.,
2015 [99] 10 CIS/ 24 RRMS/ 6 SPMS 3T, DIR and PSIR - Cerebellar CL number correlates with cerebellar clinical scores Harrison et al.,
2015 [100] 28 RRMS/ 6 SPMS 7T, MPRAGE and MPFlair - Thalamic lesion burden correlates with EDSS scores Calabrese et al.,
2013 [39] 334 RRMS 1.5T, DIR - CLs one of three best predictors of conversion to SPMS at 5 years Papadopoulou et
al., 2013 [101] 65 CIS - RRMS/ 26 SPMS - PPMS 1.5T, DIR - CL volume correlates with cognitive outcome measures but does not independently predict cognitive status Calabrese et al.,
2013 [102] 95 RRMS/ 45 “benign” MS 1.5T, DIR - Low CL burden associated with benign disease course Nelson et al.,
2011 [103] 39 RRMS and SPMS 3T, DIR, PSIR - Strong association between CLs and cognitive impairment Mike et al., 2011
[104] 20 RRMS, 6 SPMS 3T, 3D Flair and 3D-IRSPGR - CL metrics correlate with EDSS scores and cognitive measures (SDMT and CVLT-II)
Table 2: Selection of neuroimaging studies performed within the last 5 years that have assessed the clinical relevance of cortical lesions using MRI.
2.2.2. Neurodegeneration
As we have seen previously, degenerative changes in axons within acute WM lesions or NAWM have been well documented. Postmortem studies have also provided evidence of early and evolutive neuronal pathology in the MS grey matter. Peterson and colleagues reported neuritic changes within cortical lesions described as axonal transections, dendritic transections and apoptotic loss of neurons [83]. Axonal loss in GM structures is associated with on-going inflammatory activity [83] [81]. Yet, axonal damage in active GM lesions remains much less extensive than in acute active WM lesions. Neuronal death on the other hand was seen in chronic lesions without significant inflammation, suggesting that this phenomenon was not directly linked to the immune insult but might be a consequence of chronic injury. Wegner et al. quantified neuronal damage in the MS neocortex. The authors found a 10% reduction in mean neuronal density in leukocortical lesions compared to normally myelinated cortex, with decrease in neuronal size and significant changes in neuronal shape [105] [106]. Synaptic loss was significant in lesional cortex and occurred in greater proportion than neuronal soma reduction (-50% synaptophysin signal), suggesting that loss of dendritic arborization is an important feature in MS [105]. Pathologic changes in neuronal morphology, as well as reduced neuron size and axonal loss were also detected in normal-appearing cortex compared to controls [105] [107]. Klaver et al. reported a 25.4% loss of NeuN-positive neurons, reduced axon density (-31.4%) and 11.4% smaller neurons in type III cortical lesions (figure 12), while axonal density and neuronal size were also significantly reduced in the NAGM (-33.0% and -13.1% respectively) [108].
Figure 12: Neuronal loss in Type III cerebral cortical lesions in MS. Control (Ctrl) (A) and MS (B) sections immunostained for NeuN demonstrating overall neuronal loss in MS cortex. (C) Antimyelin PLP immunostained section from a patient with MS (B) showing subpial demyelination (original magnification: 100x). High-magnification pictures from cortical layer II (D, E), with matching pictures demonstrating the quality of segmentation scripts (F, G) (digital zoom from original magnification: 100x). From Klaver et al., J Neuropathol Exp Neurol, 2015 [108].
Figure 13: Synaptic loss in demyelinated hippocampus. Confocal images of multiple sclerosis (MS) hippocampus immunostained with antibodies specific to MAP2 (red) and synaptophysin (green) show punctuate presynaptic terminals (green) surrounding neurons in CA1 (A, B) and dentate gyrus (C, D) regions in MS myelinated (A, C) and MS
a 23% reduction in mean neuronal density corresponding to a 35% loss of total neuronal numbers in the MS thalamus compared to controls [110]. Unlike neocortical structures, neuronal density was decreased in both demyelinated and non-demyelinated DGM compared to control DGM, though the loss of neurons may be more pronounced in demyelinated areas [81]. Neuronal atrophy and morphologic changes were also detected in the MS DGM regardless of myelination status and may precede or accompany neuronal loss. In the hippocampus, neuronal counts were decreased by up to 30% depending on location [111]. Also in the hippocampus, Dutta et al. reported substantial reduction in synaptic density (figure 13) [109]. They found decreased expression of neuronal proteins involved in axonal transport, synaptic plasticity, and neuronal survival in demyelinated hippocampi as well as altered expression of neuronal miRNA [109] [82]. These findings may explain, at least partly, some of the cognitive deficits observed in MS patients.
The mechanisms underlying neuronal pathology remain to be fully established. Of particular interest is the interplay between WM and GM pathology. At least at the late stage of the disease, which is more frequently explored by post-mortem studies, focal WM damage fails to correlate with neuronal changes in the GM [112] [113]. However recent neuroimaging studies demonstrated that focal WM pathology, at least in relevant locations, might impact MRI-driven GM atrophy measures at earlier stages of the disease [114] [115] [116]. It can also be suggested that loss of myelin and reduction in axonal density observed diffusely in the NAWM plays a role in the neurodegenerative process by promoting retrograde or trans-synaptic degeneration (figure 14). In support of this hypothesis, anatomical connection has been shown to influence the progression of neurodegeneration. Recent studies have provided evidence of neuronal dysfunction in connected GM neurons and correlated loss of integrity of WM tracts to histopathological measures of neurodegeneration in corresponding GM structures [112]. This was further supported by reports of tract-specific associations between cortical thinning patterns and MRI-derived metrics of NAWM integrity [117]. These findings suggest a link between diffuse damage of the WM and neurodegenerative processes in connected GM. Many however argue that WM pathology cannot satisfactorily explain the full extent of diffuse GM damage observed in MS, including pathological changes observed therein
[85]. Despite a clear degree of relationship, neuronal damage may also occur independently from WM pathology.
Figure 14: Undisturbed neuronal connectivity (upper panel) can be impaired by retrograde degeneration (middle panel) propagating backwards in cortical neurons whose axons have been damages by WM lesions or along WM tracts. The WM tract damage can lead to microglial inflammation (middle panel) and retrograde neuronal cell death (lower panel), as well as anterograde Wallerian degeneration below the damage. From Calabrese, Nature Reviews Neuroscience, 2015 [85].
suggesting that focal GM demyelination and neurodegeneration are at least partly distinct phenomena in progressive MS.
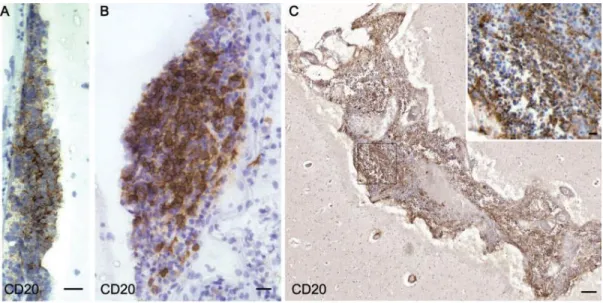
A number of studies have drawn attention to the inflammatory process occuring in the meningeal compartment. Meningeal inflammation is widespread and can be exacerbated by the presence of B-cell follicles in the meningeal space (figure 15) in a proportion of patients with progressive MS [87] [118]. These lymphoid structures appear to spatially coincide with subpial demyelinating lesions and were associated with quantitative increase in microglial activation within the GM [118]. SPMS cases with B-cell follicles presented a more severe disease course, with younger age at onset, younger age at irreversible disability and earlier death, emphasizing the clinical significance of these findings [87]. Magliozzi et al. later demonstrated significant neuronal loss with a gradient away from the pial surface and more severe cortical thinning in SPMS patients characterized by B-cell follicle-like structures in the meninges [113]. The link between meningeal inflammation and GM damage is further corroborated by studies pointing to a specific role exerted by both meningeal T cells and activated microglia in diffuse axonal loss in the spinal cord [119]. These findings strengthen the hypothesis that meningeal inflammation is implicated in neurodegeneration in MS and contributes to clinical severity and progression.
Figure 15: B-cell follicle-like structures in meningeal space of SPMS patient. (A, B) follicle of modest size. (C) Extensive infiltrate filling entire sulcus. From Howell et al. Brain, 2011 [118].
Both inflammatory cells present in the meninges and activated microglia in the GM can induce the production of oxygen and nitric oxide (NO) species by enzymes including nicotinamide adenine dinucleotide phosphate oxidase [120]. This oxidative burst can lead to or further amplify mitochondrial dysfunction and energy failure which are increasingly being recognized as major pathways of neurodegeneration in MS [121] [122]. Neurons in MS GM exhibit decreased respiratory chain function and mitochondrial gene expression [123]. Furthermore, multiple clonally expanded deletion of neuronal mitochondrial DNA are found diffusely and irrespectively of lesions in the MS cortex [124]. Respiratory deficiency creates a mismatch between energy demand and ATP supply which is thought to drive neuronal dysfunction or degeneration via excessive stimulation of calcium-dependent degradative pathways [125].
Sodium channel redistribution along denuded axons can aggravate this imbalance by significantly increasing energy demand in a context of supply deficit, leading to a state of “virtual hypoxia” [126]. Demyelinated axons are unable to maintain ionic balance between intracellular and extracellular space. Sodium channel influx triggers calcium cellular entry by reversing activity of Na+/Ca2+ exchangers, resulting in elevated intra-axonal calcium levels. Increased Ca2+ concentration can be further exacerbated by injury-induced release of calcium from neuronal intracellular stores. Multiple degradation pathways are subsequently activated resulting in mitochondrial damage, activation of NO synthase, proteases and lipases which will contribute to neuronal injury [127].
Iron stored within oligodendrocytes and myelin sheaths may be liberated following demyelination. In its extracellular form, iron generates reactive oxygen species and contributes actively to oxidative damage. Iron is absorbed by microglia and macrophages where it accumulates until these cells degenerate and cause a second
flow, thought to be mediated via release of vasoconstrictive peptides such as Endothelin-1 (ET-Endothelin-1) by activated astrocytes [Endothelin-130], has been reported in MS patients evaluated by MRI from the early stages of the disease [131] [72] [132]. Cerebral hypoperfusion might play a role in certain lesion formation [133], axonal and neuronal damage and consequently in disability progression [134] [135]. Toxic exogenous factors such as free radicals and cyanates from smoking may further exacerbate mitochondrial dysfunction and oxidative stress-related mechanisms [136].
Glutamate excitotoxicity may also play a role in GM neuronal degeneration beyond acute inflammatory attacks. MS-related modifications of glutamate levels in specific GM regions have been reported using MR spectroscopy [137], though these findings were not confirmed by others [138].
In conclusion, many well-conducted studies of post-mortem tissue have shown that GM damage dominates the pathological process as MS progresses. These studies have demonstrated the clinical significance of the degenerative process occuring in the MS GM and underscored the need to understand its causes. Strong focus on the very early stages of the disease is necessary to determine the primary insult affecting the MS grey matter and longitudinal follow-up will shed light on the relationship between demyelination, inflammation and neurodegeneration at different stages of the disease. Such approach may not be feasible using post-mortem or biopsy tissue samples. Development of pathology-specific imaging techniques, in particular techniques able to assess specifically the neuronal compartment, are necessary to further our understanding of GM pathology in MS. They will also prove uniquely useful to monitor individual patients in the clinical setting or in the context of clinical trials focused on neuroprotective therapy.
Figure 16: Oxidative stress-related mechanisms of tissue injury in multiple sclerosis. (a) Microglia is activated by unknown trigger pathology, the breakdown of the blood-brain barrier, and local and systemic inflammatory stimuli. Microglia releases nitric monoxide and superoxide molecules into the extracellular space. Additional amplification mechanisms involve microglia preactivation via axonal degeneration (d). (b) Iron is physiologically stored within the myelin sheets and liberated into the extracellular space upon demyelination. Extracellular iron amplifies oxidative stress inducing the production of highly reactive hydroxyl radicals. Iron is absorbed by microglia, which show histological signs of cell death under the high iron load and thus may release iron and initiate a second wave of oxidative stress. (c) Mitochondrial DNA (mtDNA) is vulnerable to free radical-mediated damage resulting in mtDNA deletions, which are found in neurons and axons of patients with multiple sclerosis. Mitochondria carrying such mutations are amplified by


![Figure 7: [11C]PIB in MS. The uptake of [11C]PIB is lower in MS lesions compared with normal-appearing white matter in patients with MS, suggesting the presence of demyelination](https://thumb-eu.123doks.com/thumbv2/123doknet/14296818.493426/32.918.112.773.106.628/figure-lesions-compared-appearing-patients-suggesting-presence-demyelination.webp)