Any correspondence concerning this service should be sent
to the repository administrator:
[email protected]
This is an author’s version published in:
http://oatao.univ-toulouse.fr/27288
To cite this version: Walls, Daniel J. and Espitalié, Emilie
and
Hum, Gabriel and Chen, Jun and Gattrell, Michael and Li, Anwu and
Frostad, John M. Demonstrating Aqueous-Phase
Low-Molecular-Weight-Gel Wicking of Oil for the Remediation of Oil Spilled into
Surface Water. (2020) Langmuir, 36 (44). 13155-13165. ISSN
0743-7463
Official URL
DOI :
https://doi.org/10.1021/acs.langmuir.0c00917
Open Archive Toulouse Archive Ouverte
OATAO is an open access repository that collects the work of Toulouse
researchers and makes it freely available over the web where possible
Demonstrating Aqueous-Phase Low-Molecular-Weight-Gel Wicking
of Oil for the Remediation of Oil Spilled into Surface Water
Daniel J. Walls, Emilie Espitalié, Gabriel Hum, Jun Chen, Michael Gattrell, Anwu Li,
and John M. Frostad
*
ABSTRACT: Oils spilled into surface water require effective and timely treatment. In this paper, we report on a low-molecular-weight gelator that can form gels in organic and aqueous phases. The aqueous gel was observed to absorb oils, which is proposed as a new class of materials for remediating oil spilled into surface water. The gels and the low-molecular-weight gelator have both fundamental and applied significance. Fundamentally, identifying the mechanisms that govern the formation of these gels and their resultant mechanical properties is of interest. Subsequently, these fundamental
insights aid in the optimization of these gels for addressing spilled oil. First, we briefly compare the organic and aqueous gels qualitatively before focusing on the aqueous gel. Second, we demonstrate the ability of the aqueous gel to wick oils through experiments in a Hele-Shaw cell and compare our results to the Washburn equation for porous media. The Washburn equation is not entirely adequate in describing our results due to the change in volume of the porous media during the wicking process. Finally, we investigate mechanisms proposed to govern the formation of low-molecular-weight gels in the literature through rheological shear measurements during gel formation. Our experiments suggest that the proposed mechanisms are applicable to our aqueous gels, growing as anisotropic crystal networks with fractal dimensions between one and two dimensions from temporally sporadic nucleation sites.
■
INTRODUCTIONOil spills. In doing so, it poses both acute and chronic hazards to ecosystems, requiring effective and timely treatment. As large quantities of crude and processed oils are transported across and in the proximity of oceans, rivers, and other waterways, and as large spills have occurred, it is critical to have techniques that enable the remediation of oil spilled into surface water. The dynamic, variable, and sensitive character of aquatic environments highlights the need for early, rapid, and dexterous responses to contain a spill, limit its dispersion, and facilitate its removal.
In striving to develop better remediation technologies, it is also important to recognize that no remediation activity can completely ameliorate spilled oil and its effects. Future sources of energy must be anticipated by developers of remediation technologies as well. For example, the combustion of petroleum products has been comprehensively linked to climate change by the Intergovernmental Panel on Climate Change (IPCC).1 Potential shifts in scale of production and distribution, or to carbon-neutral fuels, may present new challenges and require flexible and economical remediation technologies that can be applied at many scales. Here, we report a fundamental and applied investigation on a low-molecular-weight gelator, its self-assembled networks, and its potential for remediating oil spilled into surface water.
Oil spilled into open water is typically remediated through physical means, with booms and skimmers employed to contain and remove the oil from the environment, or burned in situ.2 A variety of chemical options for oil remediation have been used or considered as well, such as dispersants, herders,3,4 absorbents,5−8 and gelators.9−21 Membrane filtration to
separate oil−water mixtures has also been reported in the literature.22,23 Historically, the toxicity, efficiency, and cost of available chemical options are usually prohibitive. More recently, however, new technologies have been sought to protect the sensitivity of the aquatic environment and alleviate the cost of remediation.
Gelators (also known as gelling agents, gellants, and sometimes solidifiers) constitute a class of chemicals with distinct advantages for remediating oil spilled into surface water. In principle, gelators “gel” or “solidify” spilled oil to increase the ease with which the oil can be removed from the water and to reduce the impact on coastal environments.11 Another prime advantage of gelators would be the cohesion of
the resultant gel that resists and delays the breakup and dispersion of the oil spill, extending the window of time for effective remediation. Gelators could enhance the utility of herders, which modify surface tensions to produce contractions of oil slicks but dissipate over a period of tens of minutes. Applying a gelator to the herded oil could prevent the oil from respreading.3 Additionally, most remediation methods are encumbered by rough seas, including booms and herders, but gelators have the potential to be applied in all weather conditions.24
Currently available gelators are not commercially relevant, rendered impractical due to toxicity of formulations, large dose requirements, cumbersome deployment methods, and high costs.25 Recently, a renewed interest in gelators has led researchers to begin developing new chemistries to overcome some of the challenges mentioned above.12,16−21 Both
Mukherjee and Mukhopadhyay12 and Vibhute et al.19
independently reported environmentally friendly, carbohy-drate-based gelators capable of selectively gelling organic liquids and oils in organic−aqueous mixtures at low doses. The field of gelators for the remediation of oil spilled into open water is reviewed by Motta et al.,24including these two papers. An additional challenge for gelation as a method for remediating oil spilled into surface water is its deployment. Gelators require a trigger to induce the formation of gels, which is commonly achieved through a heating and cooling cycle after its addition or by first dissolving it in a cosolvent prior to its addition. Neither is practical for oil spilled into open water. Lee and Rogers26 proposed using a xerogel,
derived from an organogel in a volatile organic solvent, as an absorbent for spilled oils. By this method, xerogels can be prepared in advance with only small amounts of gelator, but this preparation still requires volumes of solvent comparable to the volumes of oil to be absorbed. These authors measured the uptake of oil as a function of time by placing the xerogel in a beaker of oil and water, and periodically removing and weighing the xerogel. Absorbent materials usually need to be applied in large quantities to soak up oil, but as demonstrated by Lee and Rogers, gels derived from a small self-assembling gelator at low concentrations (<1−3 wt %) could be effective. The gelators noted here belong to a broader class of molecules, called low-molecular-weight gelators, reviewed by Raeburn et al.27 and Okesola and Smith.28
Low-molecular-weight gelators self-assemble through noncovalent intermo-lecular interactions to form volume-spanning networks. In a set of investigations to understand the formation of these larger hierarchical structures, Liu and co-workers29−34 proceeded
from a theoretical standpoint of nucleation and crystallization. Based on images acquired using scanning electron microscopy (SEM) of xerogels and their fiberlike character, Liu and co-workers proposed that low-molecular-weight gelators crystal-lize anisotropically, and that branch points along the fibers are caused by crystallographic mismatching. Further, they linked measurements of complex modulus by shear rheometry during the formation of these structures to the Avrami equation,35−37
which was initially theorized to explain crystal growth. The complex modulus was related to the volume encompassed by the fibrous networks through the Einstein viscosity law for a dilute suspension,38yielding a modified Avrami equation,
L N MMMM \ ^ ]]]] − * − * * ∞ − * = − − G t G G G k t t ln 1 ( ) (0) ( ) (0) ( ) d g (1)
where G* is the complex modulus, k is a constant, t is time, tgis
the time at the onset of gelation, and d is the modified Avrami exponent. The left side ofeq 1can also be written as ln(1 − X), where X is the volume encompassed by the fibrous network. Liu and co-workers used this modified Avrami equation with their data to determine d by treating it as a fitting parameter. This exponent accounts for the dimension of crystal growth and the temporal character of nucleation events. The dimensional contribution is between 1 and 3, indicating the dimension of growth, and the nucleation contribution is 0 or 1, indicating the limiting cases of nucleation sites all present at time zero or emerging sporadically throughout crystal growth. They found noninteger dimensions of network growth and concluded that the structure of the low-molecular-weight gel grew as a fractal.39 Other researchers have taken up the
Avrami equation in its classic or modified form to study self-assembling gelators. These researchers have also considered other methods to measure the solid phase or proxies for the volume fraction encompassed by the growing solid phase, including infrared spectroscopy and hydrogen bonding, dynamic scanning calorimetry and heat flow, and polarized light microscopy and fiber length.40−45
Researchers at BC Research, Inc., have recently developed a low-molecular-weight gelator that was observed to form gels in oil as well as hierarchical structures in aqueous solutions at concentrations of about 1 wt %.46 We have not seen other reports in the literature of a molecule that can form sample-spanning structures in both organic and aqueous phases. Further, when brought into contact with oil, the aqueous structure absorbs it, with the water being displaced. These absorbent low-molecular-weight gels represent a new class of materials. The development of an oil-absorbing gel that can be formed on site from a small quantity of gelator and water and no additional organic solvent suggests the possibility of overcoming existing challenges of gelator deployment. Indeed, while this gelator still requires heating and cooling to induce gelation, it can be done in a straightforward way on board a vessel and subsequently added to spilled oil, in contrast to an organogelator that would necessitate heating a vast oil slick on the ocean.
Here, we investigate this low-molecular-weight gelator and its self-assembling gels. We compare the structures formed in organic and aqueous phases briefly, before focusing on the structures formed in aqueous environments, their ability to absorb oil as a function of time, and the applicability of the nucleation, growth, and crystallographic mismatching theories proposed by Liu and co-workers. Throughout this study, we use the terms gelator, low-molecular-weight gelator, and gellant interchangeably.
■
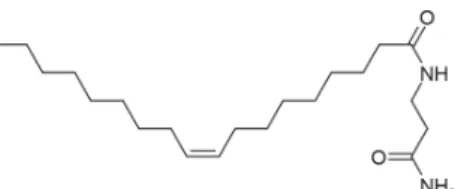
EXPERIMENTAL SECTIONMaterials.The gellant used in this study is a low-molecular-weight gelator and is shown inFigure 1. It is a (n-fatty acid)−(amino acid) conjugate, synthesized in an aqueous reaction at BC Research, Inc. Its sol−gel transition occurs in response to temperature in aqueous and several organic phases, with gelation occurring upon cooling. The experiments presented here make use of this gellant, deionized (DI) water (Elga, PURELAB Option-Q), diesel (Petro-Canada, Farm grade), and n-decane (Alfa Aesar, 99%).
Rinsing of Low-Molecular-Weight Gelator. The synthesized gellant powder contains residual amounts of surface active materials from the synthesis reaction. In the experiments in this study, the gellant powder was used as synthesized as well as after thorough rinsing with DI water to remove as much residual material as possible.
The following procedure was used in rinsing the synthesized gellant powder. First, the powder was finely ground using a coffee grinder (Krups, F203). Approximately 1 g of the ground powder was added to a 50 mL centrifuge tube along with approximately 40 mL of DI water. The tube was then capped, shaken vigorously for 60 s, and placed in a centrifuge to separate the solids and supernatant. The supernatant was poured from the tube while retaining the solids. Rinses with DI water were repeated 20 times before the solids were placed in an oven at 60 °C to dry. Finally, the powder was finely ground again.
Hele-Shaw Cell. A Hele-Shaw cell was constructed to allow imaging of the formation of the gellant structures in either organic or aqueous phases, as well as the absorption of oils by the structures formed from aqueous solution. A schematic diagram of the cell is displayed in Figure 2. The Hele-Shaw cell is formed from an
aluminum base and lid machined to set two glass faces parallel to one another at a distance of 0.5 mm apart. The aluminum base is 1.5 mm thick, and two rectangular slots are machined into it. The first slot forms the cell; it is machined into the top face of the aluminum base with dimensions 50 mm (l) × 8 mm (w) × 0.5 mm (h). The second rectangular slot is where the bottom glass face of the cell, a microscope slide with a thickness of 1 mm, is affixed; it is machined into the bottom face of the aluminum base, centered on the top rectangular slot, with dimensions 26 mm (l) × 12 mm (w) × 1 mm (h). The upper face of the glass microscope slide forms a flush surface with the top slot to form the bottom of the cell. The aluminum lid is 2 mm thick, and a rectangular slot, with dimensions of 26 mm (l) × 7.6 mm (w), is machined through its center. A glass coverslip with a
thickness of 0.17 mm is affixed to the underside of the aluminum lid to span the rectangular window. Mounting the aluminum lid onto its base with four screws forms the Hele-Shaw cell. The aluminum base can be mounted to capture images within the Hele-Shaw cell using a camera (Imaging Development Systems, UI-3880LE) attached to either a microscope (Nikon, Eclipse E200) or a conventional camera lens (Pixco, 35 mm F1.7 2/3” CCTV lens).
Gels can be formed directly in the Hele-Shaw cell. To the side of the cell, a hot plate and stir bar were used to heat the solvent and dissolve gellant at the desired concentration. Once the gellant was dissolved, the hot solution was transferred to the Hele-Shaw cell with a glass pipet, where it would wick into and fill the volume of the cell. The solution then cooled as its heat dissipated, and the gel would form.
The temperature of the Hele-Shaw cell was held at room temperature for all experiments in this study; however, it can be controlled between room temperature and 100 °C using two 25 W cartridge heaters (Watlow, C1E14-L12), a variable transformer (Staco Energy Products), a thermocouple (Omega, SA1-J), and a temper-ature controller (Watlow, Series CV). The aluminum base has two cylindrical slots on opposite sides of the Hele-Shaw cell where the two cartridge heaters can be inserted (not depicted in the schematic diagram ofFigure 2).
Absorption and Image Analysis. Absorption experiments were performed in the Hele-Shaw cell with gels formed from aqueous solutions. Once the gel reached room temperature, an aliquot of oil was placed adjacent to one of the openings at the end of the Hele-Shaw cell. Absorption begins spontaneously, and images were taken at a frequency of one frame per second using the camera and lens.
MATLAB was utilized to analyze sequences of images acquired during the absorption of oils into the aqueous gellant structures. The first image in a sequence was subtracted from subsequent images in order to accentuate the regions of the image where oil had penetrated. Subtracted images were then processed in batch with a consistent binarization procedure to identify pixels where oil was absorbed. Then, the area of the absorbed region was calculated and subsequently divided by the width of the Hele-Shaw cell to determine an average length. Accuracy of the batch image binarization was verified by manually comparing videos of the experimental and binarized images side-by-side for each experiment.
Shear Rheology.A rheometer (TA Instruments, Discovery HR-2) equipped with a cone (TA Instruments, 60 mm diameter, 2° angle, model 513606.905) and plate geometry was used to perform oscillatory shear measurements during the formation of gels from aqueous solutions.
Prior to conducting an experiment, the Peltier plate of the rheometer was set to 99 °C. To the side of the rheometer, a hot plate and stir bar were used to heat DI water to approximately 99 °C and dissolve gellant at the desired concentration. Once the gellant was dissolved, the hot aqueous solution was transferred to the rheometer with a glass pipet, where it would wick into and fill the volume of the gap between the cone and plate. This gap was set to the truncation of the cone, 52 μm.
The rheometer was programmed to run four sequential steps. First, the temperature of the Peltier plate was held at 99 °C for 15 s while measurements were conducted at a frequency of 5 Hz and strain of 0.075%. Second, the temperature set point of the Peltier plate was rapidly decreased to 40 °C while measurements were conducted at the same frequency and strain over 180 s. Third, a frequency sweep was conducted from 0.1 to 100 Hz at a strain of 0.075% and temperature of 40 °C. Fourth, an amplitude sweep was conducted from 0.01% to 10% at a frequency of 1 Hz and temperature of 40 °C. The frequency and amplitude sweeps were performed to verify that the frequency and strain selected for the first two steps were in ranges over which the complex modulus was constant.
Differential Scanning Calorimetry. A differential scanning calorimeter (TA Instruments, DSC 250) was used to perform calorimetry measurements on gellant added to DI water. Gellant and DI water were added to the sample pan to achieve the desired concentration. The calorimeter was programmed to run thermal Figure 1. Chemical structure of the low-molecular-weight gelator
used in this study.
Figure 2.Schematic diagram of the Hele-Shaw cell formed from an aluminum base and lid machined to set two glass faces parallel to one another at a distance of 0.5 mm apart. The two pieces of glass are a microscope slide and coverslip. The slide is mounted into the underside of the base, and the coverslip is mounted into the underside of the lid. The viewable portion of the Hele-Shaw cell has dimensions of 26 mm (l) × 7.6 mm (w) × 0.5 mm (h). The aluminum base can then be mounted onto a microscope stage or positioned under a camera lens for imaging.
cycles with heating and cooling rates of 5 °C/min. The first cycle was started from 40 °C, heating to 110 °C before cooling to 50 °C. Subsequent cycles then started from 50 °C, heating to 110 °C before cooling to 50 °C. After each half-cycle of heating or cooling, the temperature was held for 30 s before starting the next half-cycle.
Surface Tension, Interfacial Tension, and Contact Angle. The pendant drop method was used to measure the surface tensions of supernatants generated during the rinsing of the synthesized gellant powder as well as the interfacial tension between diesel and the aqueous solution displaced during absorption experiments.
An inverted sessile drop was used to measure the contact angle of a droplet of diesel on the underside of a surface coated by a thin film of gellant while immersed in the aqueous solution displaced during the absorption experiments. The surface coated with gellant was prepared by melting gellant onto a glass slide. The surface was then mounted to a rod that was then fixed to submerge the surface with the gellant side down in a bath of the aqueous solution. A droplet of diesel was formed at the surface using a curved syringe needle and allowed to equilibrate before measuring the contact angle.
■
RESULTSGelling Organic and Aqueous Phases.Figure 3shows images of the gellant structures formed in (a) decane and (b) DI water. The gellant used was not rinsed with DI water beforehand. Forming the gel required bringing each solvent containing the indicated concentration of gellant close to its boiling point (150 and 100 °C, respectively) and then cooling.
The same gelation procedure cannot be followed using diesel, as diesel boils at a lower temperature than necessary for the gellant to dissolve. In the left panels, the formed structures span the entire volume of both liquids in 20 mL vials, appear opaque, and can support their own weight upon inversion. Viewing the structures as they form in time under a microscope in the thin gap of the Hele-Shaw cell reveals differences in the character of the structures (right panels). In decane, the composite appears translucent at all times, reaching a consistent translucency after approximately 2 min; conversely, in DI water, the composite grows increasingly opaque, revealing a textured appearance.
The International Union of Pure and Applied Chemistry defines a gel as a “nonfluid colloidal network or polymer network that is expanded throughout its whole volume by a fluid” and that it can contain “a polymer network formed through the physical aggregation of polymer chains, caused by hydrogen bonds, crystallization, helix formation, complexation, etc., that results in regions of local order acting as the network junction points.”47 Both the decane−gellant and DI water− gellant composites meet this description of a gel, and we refer to these organic and aqueous self-assembled networks as gels throughout this study.
However, the translucent character of the thin layer of gelled decane contrasted with the opacity of the thin layer of gelled DI water would seem to indicate that the gellant forms a more finely dispersed network in decane. Further, the increased surface area of a more finely dispersed network implies a lower surface energy between the network and fluid phase, indicating that this gellant interacts more favorably with the organic phase. In support of this claim, we separately observed that the rinsed gellant is readily wetted when added to a vial of decane, whereas it becomes pinned at the air−DI water interface and requires agitation to completely wet it. We will return to this observation later, but we now direct our focus to the aqueous gel.
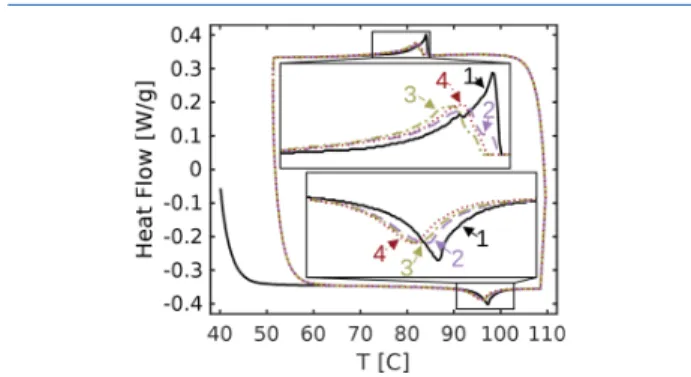
Calorimetry of an Aqueous Gel.Figure 4shows a plot of measurements of heat flow as a function of temperature for
four thermal cycles of a single sample containing 58 mM gellant in DI water. A relatively larger concentration of gellant was used in calorimetry experiments to accentuate the observed heat flow. The first cycle begins at 40 °C and is heated to 110 °C before cooling to 50 °C. The three
Figure 3.Structure formed by the gellant in (a) decane with 60 mM gellant and (b) DI water with 15 mM gellant. For each liquid, the fully formed structure is shown in an inverted 20 mL vial (left) alongside a sequence of images taken during the formation of the structure at the respective times in the Hele-Shaw cell (right). The scale bar is 0.2 mm for the sequences of images taken in the Hele-Shaw cell.
Figure 4. Plot of measurements of heat flow as a function of temperature for four thermal cycles of a single sample containing 58 mM gellant in DI water. Two insets magnify regions of the curves corresponding to dissolution (lower inset) and gelation (upper inset) of the gellant in relation to the aqueous phase. Each curve is labeled with its cycle number in both insets.
subsequent cycles occur between 50 and 110 °C. The four thermal curves largely overlay one another aside from the first heating half-cycle and the two regions magnified in the two insets. These regions of the curves correspond to the dissolution (lower inset) and gelation (upper inset) of the gellant in relation to the aqueous phase, and slight differences are observed between the four curves.
The most pronounced difference is observed between the first cycle and subsequent three cycles during dissolution and gelation. Dissolution in the first cycle corresponds to a narrow peak in heat flow at a temperature of 97.3 °C. In subsequent cycles, dissolution corresponds to wider peaks in heat flow that occur at a lower temperature, approximately 96 °C. This difference can be attributed to the different distribution of gellant in the sample pan. At the start of the first cycle, the sample pan contains powdered gellant simply resting at the bottom of the volume of DI water. In subsequent cycles, the gellant is better distributed throughout the sample pan in the form of the aqueous gel. Gelation in the first cycle corresponds to a steep peak in heat flow at a temperature of 84 °C with a broad tail. In subsequent cycles, peaks corresponding to gelation shift to lower temperatures, approximately 82 °C, and are more broad. This difference can be attributed to the differing distribution of gellant. The contents of the sample pan are not actively mixed, so the dissolved gellant is least well distributed in the first cycle and should become more evenly distributed with successive cycles.
Dissolution after the first cycle approaches a consistent behavior. The peaks in heat flow shift slightly to lower temperatures. Each successive shift is smaller than the previous, with the third and fourth cycles exhibiting nearly identical curves with peaks at 96 °C.
In the region corresponding to gelation, the curves approach a consistent shape, but not a consistent peak temperature through four thermal cycles. The second and third cycles see shifts to lower peak temperatures (82.8 and 81.6 °C, respectively), before the fourth cycle shifts back to an intermediate peak temperature (82.3 °C). The lack of active mixing in the sample pan may be the cause of this slight variation, but it is difficult to do more than postulate without the possibility of visual observation. Due to this limitation, we do not pursue calorimetry further. Instead, we focus on techniques that allow us to separately dissolve the gellant in aqueous solution under active mixing prior to the experiment, as well as to visually inspect the aqueous gel throughout or at the conclusion of the experiment. Results from those techniques are presented below.
Absorbing Oil with Aqueous Gels. Interestingly, the aqueous structure was found to absorb oil when the two are brought into contact, with the absorbed oil displacing the water from the structure. The absorption of oil by the aqueous structure is likely due to the more favorable interactions between the gellant molecule and organic solvent. Using the decane gel for absorbing another or additional organic liquid was not attempted due to the impracticality of adding additional organic solvent to the environment in the clean up of a large-scale spill. However, we would speculate that an organic-phase low-molecular-weight gel could absorb addi-tional oil to some extent. Likewise, we did not measure the absorption capacity of the original gellant powder, as it has no intrinsic mechanical structure to hold itself together. We postulate that the absorption capacity of the gellant powder would be approximately equal to its void fraction.
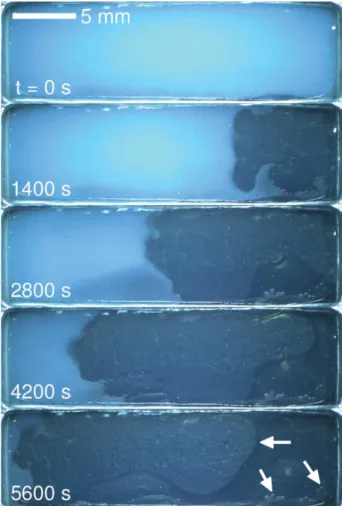
Figure 5shows a sequence of images taken over time of the absorption of diesel into a structure formed from an aqueous
solution of 15 mM gellant in the Hele-Shaw cell. The gellant used was not rinsed with DI water beforehand. At time zero (first frame), diesel was added adjacent to the opening on the right side of the Hele-Shaw cell. As diesel is absorbed into the structure, roughly from right to left, it displaces water, and the structure becomes translucent. The absorption front is not entirely uniform, as a liquid penetrating into a porous medium due to capillary forces follows the path of least resistance, and water is not strictly displaced from right to left. In the last frame, it is clear that some water remains trapped in the Hele-Shaw cell, made evident by the various small droplets that remain as well as the three-phase contact line (oil−water− glass) that can be seen against the glass surface of the Hele-Shaw cell. In fact, the movement of the three-phase contact line appears to coincide with the gel detaching from the glass,
Figure 5.Sequence of images taken over time of the absorption of oil (diesel) into, and displacement of water from, the aqueous structure of the low-molecular-weight gelator in the Hele-Shaw cell. The concentration of the gelator used to form the aqueous structure is 15 mM. Diesel absorbs from right to left, producing a distinct change in the transparency of the material as it progresses. In the last frame, arrows indicate the three-phase contact line (diesel−water−glass) and water droplets that remain after the absorption of oil. The scale bar is 5 mm for all images. The full movie from which these frames were taken can be found in theSupporting Information.
indicating that the volume of the gel shrinks as it absorbs diesel and displaces water.
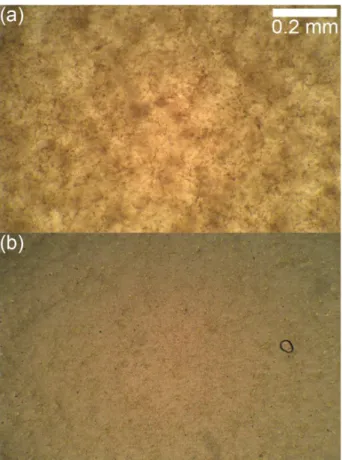
InFigure 6, a gel in the Hele-Shaw cell, formed with 7.5 mM gellant in aqueous solution, is observed under the microscope
(a) before and (b) after the absorption of diesel. The gellant used was not rinsed with DI water beforehand. It is visually apparent that the features of the initially aqueous gel change when diesel displaces water, becoming finer and more compact. This change seems to suggest that the gelled structure partially collapses during absorption. It is also possible that molecular rearrangement of the individual gellant molecules may occur due to exchanging a polar liquid phase for a nonpolar one. However, the appearance of the oil-soaked gel does not become translucent to the degree observed when forming an organic gel directly, as inFigure 3a, suggesting that if molecular rearrangement of the gellant does occur, then it is restricted by the arrangement of the initial aqueous structure. A more discerning experiment would need to be designed to investigate the possibility of molecular rearrangement.
The absorption process can be tracked as a function of time. Previous researchers have investigated the absorption, or wicking, of liquids, which is driven by capillary forces. Washburn studied the wicking of a liquid into, and the displacement of air from, a cylindrical capillary, deriving an equation for the position of the wicking front as a function of time.48Successive researchers have extended this equation for
wicking into porous media.49 This version of the Washburn equation describes the wicking rate, v:
σ θ μ μ = [ + − ] v r x L x 2 cos 8 ( ) e a b (2)
where μaand μbare the dynamic viscosities of the wicked and
displaced fluids, respectively, x is the position of the wicking front, L is the total length of porous media, reis the equivalent
radius of the pores, σ is the interfacial tension between the two fluids, and θ is the contact angle formed by the fluid−fluid interface at the surface of the porous media. By measuring the position of the wicking front as a function of time, the Washburn equation can be used to determine a parameter in the coefficient, such as the equivalent radius of the pores, given that the other parameters are known.
Figure 7 shows plots of measurements of the average positions of the wicking front, x, as functions of time for diesel
wicking into aqueous structures of the low-molecular-weight gelator in the Hele-Shaw cell for four concentrations of gellant.
Figure 7a shows wicking within the first 10 mm of the Hele-Shaw cell, whileFigure 7b shows the same experiments across the entire length of the cell. We note that diesel does not wick into the Hele-Shaw cell to displace DI water if no gellant is present, such that all wicking is due to the gellant structures rather than the Hele-Shaw cell. Following an initial “wetting delay”, diesel wicks into the structure formed by the gellant from aqueous solution at its maximum rate, proceeding ever
Figure 6.Images taken using a microscope (a) before and (b) after the absorption of oil (diesel) into the aqueous structure of the low-molecular-weight gelator at a concentration of 7.5 mM in the Hele-Shaw cell. The scale bar is 0.2 mm for both images.
Figure 7. Plots of measurements of the average positions of the wicking front, x, as functions of time for oil (diesel) wicking into aqueous structures of the low-molecular-weight gelator in the Hele-Shaw cell for several concentrations of gellant. (a, b) Identical experiments, with panel a showing wicking within the first 10 mm of the Hele-Shaw cell and panel b across the entire length of the cell. Symbols indicate measurements of average wicking lengths, while the dashed lines indicate theoretical predictions of wicking length from the Washburn equation,eq 2, for each experiment with σ = 20 mN/ m, θ = 0, μa= 3.2 mPa s, μb= 1 mPa s, and re= 290, 280, 170, and 130 nm for 5, 10, 15, and 25 mM gellant, respectively.
more slowly as the wicking length increases. Additionally, with increasing concentrations of gellant, wicking proceeds more slowly. The Washburn equation, eq 2, predicts these two features of the wicking process: the rate of wicking diminishes with respect to the wicked length because of the increasing pressure drop within the Hele-Shaw cell due to the displacement of a lower-viscosity liquid (water) by one of higher viscosity (diesel), and the rate of wicking also diminishes with respect to the increasing concentration of gellant due to decreasing porosity. The dashed lines ofFigure 7a are predictions of the Washburn equation using independently measured values for σ = 10 mN/m, θ = 0, μa
= 3.2 mPa s, and μb= 1 mPa s, choosing reto fit the data (290,
280, 170, and 130 nm for 5, 10, 15, and 25 mM gellant, respectively), and shifting time to account for the wetting delay.
The predictions of the Washburn equation within the first 10 mm of the Hele-Shaw cell appear adequate. However, across the entire length of the cell, the observed wicking distance does not keep pace with its prediction, as shown in
Figure 7b. InFigures 5and6, it appears that the volume of the gellant structure becomes more compact and less porous when oil displaces water, which would further suppress the rate of wicking beyond the simple prediction of the Washburn equation. To examine the change in volume directly, separate experiments were conducted where aqueous gels of 4 mL were formed in a vial from concentrations of 5, 10, 15, 20, and 25 mM gellant. Additional water was added so that the gel would float freely before diesel was slowly added under gentle agitation of the vial until the gel was saturated. Saturation was determined to occur when a liquid lens of diesel was visually observed to emanate from the oil-wicked gel. The mass of diesel added was then determined as the difference in mass of the vial and its contents before and after the addition of diesel, from which the volume of diesel was calculated. Single repetition experiments indicated that 4 mL of aqueous gel from 5, 10, 15, 20, and 25 mM gellant can absorb 1.9, 2.8, 3.4, 3.9, and 4.3 mL of diesel, respectively. Changes in volume were irregular rather than an affine transformation, and some water remained trapped in small pockets within the oil-wicked gel. Thus, deviations from the Washburn equation at longer wicking lengths are expected due to this irregular change in volume and pore radius, particularly at lower gellant concentrations where the volumes of the structures contract to larger degrees.
From the results ofFigure 7, maximizing the rate of wicking of these aqueous gels and minimizing the amount of gellant necessary to form them are two desirable outcomes that coincide. A potential competing priority is the mechanical strength of the aqueous gel, which will be considered explicitly in a subsequent study focused on the tuning of these aqueous gels for remediating oil spilled into surface water. Such an undertaking would benefit from a thermodynamic, first-principles understanding of their formation. Liu et al.29
proposed the mechanisms of nucleation, growth, and crystallo-graphic mismatching as a basis for low-molecular-weight gelators, and we will evaluate their applicability to our gellant in aqueous solution in the remainder of this paper.
Theory of Low-Molecular-Weight Gelation.Liu and co-workers showed that the concentration of surfactant has a considerable effect on the macroscopic structure that low-molecular-weight gellants form, both visually through micros-copy and mechanically with rheometry. The concentrations of
surface active agents that remain after the synthesis of our gellant are not negligible and need to be removed to perform a systematic study of the effect of surfactant. We plan to conduct such study in the future. Here, the macroscopic structures and their formation by the gellant as synthesized with residual surfactants (not rinsed) and after rinsing to remove residual surfactants (rinsed) are compared through microscopy and rheology.
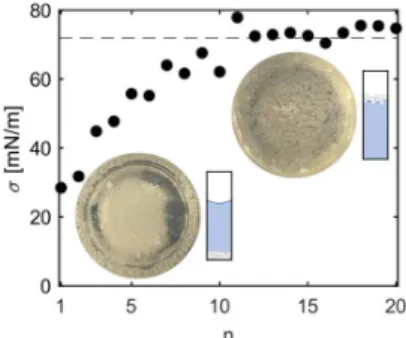
Figure 8 shows the surface tension of the supernatant in successive rinses of the gellant with DI water following the
rinsing procedure described earlier. The supernatant from the first rinse has a surface tension of approximately 30 mN/m, and the surface tension of successive rinses rises steadily, reaching a value of 72 mN/m, the surface tension of DI water, after approximately 10 rinses. Subsequent rinses of the gellant show that the surface tensions of the supernatants remain approximately 72 mN/m, demonstrating that all or nearly all surface active agents have been removed from the powdered gellant. The two insets show the powdered gellant before (lower left) and after (upper right) rinsing when added to a vial of DI water, depicted by a photograph looking down into the vial and by a cartoon from the side. Before rinsing, the powder is easily wetted by DI water, but after rinsing, it largely adheres to the air−water interface. With agitation, the rinsed gellant can be wetted by DI water and removed from the air− water interface.
Figure 9 shows two images of the gellant structure in the Hele-Shaw cell at a concentration of 15 mM gellant, formed with gellant rinsed to remove residual components of the synthesis, (a) before and (b) after the introduction of diesel to the openings of the Hele-Shaw cell. InFigure 9a, the structure that forms is unable to span the entire volume of the Hele-Shaw cell without the residual surfactants of the synthesis. This disconnected structure is still able to wick oil to some degree, as seen in Figure 9b, albeit limitedly when the distance between segments of the structure is too large. Due to the discontinuous and sparse character of the structure formed with gellant rinsed to remove residual components of the synthesis, wicking experiments in the Hele-Shaw cell were not feasible. It is clear that surfactant has a significant influence on
Figure 8.Plot of measurements of surface tension of the supernatants, σ, from sequential rinses of the low-molecular-weight gelator as a function of the rinse number, n. Symbols indicate measurements of surface tension of the supernatants, while the dashed line indicates the surface tension of DI water as a reference. Insets: powdered gelator before (lower left) and after (upper right) rinsing when added to DI water, depicted by a photograph looking down into the vial and by a cartoon from the side. Before rinsing, the powder is wetted by DI water and settles to the bottom, whereas after rinsing, a large amount remains pinned at the air−liquid interface.
the formation of the structure of the low-molecular-weight gel, and supports the applicability of the proposed theory of Liu and co-workers for our gelator in aqueous environments.
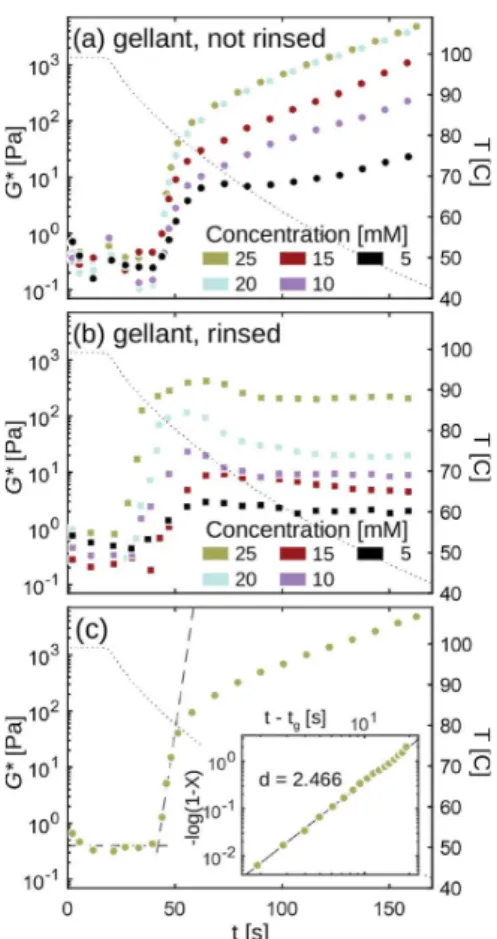
Liu and co-workers supported their proposed theory with measurements of complex modulus during the formation of gels by low-molecular-weight gelators.Figure 10shows plots of measurements of complex modulus, G*, and temperature, T, as functions of time during the nucleation and growth of the macroscopic structure of the gellant at several concentrations (a) without rinsing and (b) with rinsing. For all experiments, the Peltier plate of the shear rheometer initially holds the temperature at 99 °C as the rheometer measures a baseline complex modulus while the gellant remains dissolved in solution. After 15 s, the set point of the Peltier plate is rapidly decreased to 40 °C, and the temperature of the material begins to decrease. At some point in time and temperature later, the complex modulus rapidly increases. In the experiments shown inFigure 10a, where the gellant was not rinsed, the complex modulus then begins to increase more gradually, with higher concentrations of gellant producing both steeper initial increases and larger values of the complex modulus. The times and temperatures at which the large initial increases occur are similar, occurring between 40.0 and 42.5 s (41.40 ± 0.88 s), and between 82.75 and 84.28 °C (83.49 ± 0.43 °C). In the experiments shown in Figure 10b, where the synthesized gellant was rinsed, the complex modulus reaches a maximum and decreases slightly before reaching a plateau, with higher concentrations of gellant generally producing both steeper initial increases and larger plateau values of the complex modulus. The times and temperatures at which the large initial increases occur are similar, but more disparate than the data of
Figure 10a, occurring between 27.0 and 40.0 s (33.90 ± 4.65 s), and between 83.85 and 90.75 °C (87.20 ± 2.44 °C). On average, the large initial increase in complex modulus occurs earlier in time and at a higher temperature when the gellant has been rinsed of residual surface active agents. The temperature of only one experiment is plotted for simplicity, as the measured temperatures for all experiments fall nearly identically along one another.
The data in Figure 10a,b are qualitatively similar to the results of Liu and co-workers.29They found the behavior of the complex modulus to change with respect to the concentrations of both gellant and surfactant, although the changes here occur over a much shorter time scale. InFigure 10c and its inset, an example calculation of the modified Avrami exponent, d, is shown. Two dashed lines are drawn to determine the baseline complex modulus, G0*, and gelation time, tg. The horizontal
dashed line indicates the baseline complex modulus, and its intersection with the second dashed line drawn as the slope of the sudden increase in complex modulus determines the gelation time. The inset uses the modified Avrami equation,eq 1, to fit the complex modulus as a function of time in order to determine the modified Avrami exponent. Unsurprisingly, measuring the growth of the gel using rheology is most suitable at the initial stages of growth when the assumption of a dilute suspension inherent in the modified Avrami equation through the Einstein viscosity law is valid. Once growing fragments of
Figure 9. (a) Image of the structure formed by the rinsed low-molecular-weight gelator in DI water within the Hele-Shaw cell. The concentration of the gelator used to form the aqueous structure is 15 mM. The structure that forms is unable to fully span the volume of the DI water within the Hele-Shaw cell. (b) Image of the same structure displayed in panel a after oil (diesel) was introduced to the open ends of the Hele-Shaw cell. Diesel is able to partially wick into the formed structures, but does not entirely fill the cell due to the fragmented character of the aqueous structure formed by the gelator rinsed to remove residual surfactants. Additionally, two air bubbles are trapped within the cell. The scale bar is 5 mm for both images.
Figure 10. Plots of measurements of complex modulus, G*, and temperature, T, as functions of time during the nucleation and growth of the low-molecular-weight gelator structure in aqueous solution at several concentrations (a) without rinsing and (b) with rinsing. Complex modulus (left), temperature (right), and time are plotted on logarithmic, linear, and linear scales, respectively. Symbols indicate measurements of complex modulus, while the dotted line indicates representative measurements of temperature across all experiments. (c) Example calculation of the modified Avrami exponent for a particular trial from panel a. The two dashed lines are drawn to identify G0*(baseline) and tg(intersection). Inset: the measurements of complex modulus are transformed and fitted following eq 1to determine the modified Avrami exponent, d, from the slope of the solid line.
the network from separate nucleation sites encounter one another, the model begins to fail. It is unable to predict later features observed beyond a simple plateau. Here, the model is unable to explain the secondary, more gradual rise in the complex moduli observed using unrinsed gellant or the peak in complex moduli before falling to a lower plateau value observed using rinsed gellant shown in Figure 10a,b, respectively. In the case of the continual gradual rise of the complex modulus when using unrinsed gellant, this certainly suggests that the gel network continues to grow and become more entangled. The peak in complex modulus when using rinsed gellant is less obvious. Given the sparse character of the structure that forms when using rinsed gellant, the peak and subsequent lower plateau may suggest that growing fragments of the network reorient after encountering one another. We do not believe that the evaporation of water from the sample volume is substantial, as the complex moduli remain steady while holding the initial temperature of 99 °C to measure baseline values, and it reaches a steady plateau when using rinsed gellant as seen inFigure 10b.
Despite its limitations, the model is still insightful during the initial growth of the gel network. Interestingly, the modified Avrami exponent did not vary significantly with respect to concentration, only with respect to whether the gellant was rinsed or not: without rinsing, d = 2.48 ± 0.13, and with rinsing, d = 2.03 ± 0.28. The higher value of the exponent when the gellant was not rinsed (residual surface active agents present) fits the theory of crystallographic mismatching where surfactants cause branching and a higher dimension of network growth. Avrami36 stated that the exponent contains informa-tion related to the dimension of crystal growth as well as the emergence of nucleation sites. In the limit that all nucleation occurs simultaneously, the exponent will be between 1 and 3, corresponding to the dimension of crystal growth. Conversely, when nucleation sites occur throughout the duration of crystal growth, the exponent will be between 2 and 4, corresponding to one greater than the dimension of crystal growth. The exponents calculated from our experiments would then indicate that the structure grows as a fractal between two and three dimensions from nucleation sites that all emerge simultaneously, or that it grows as a fractal between one and two dimensions from nucleation sites that emerge throughout crystal growth. Based on the slow cooling rate of the material, it seems more likely that nucleation sites emerge in time and that the fractal dimension is between one and two. These exponential values are on the order of those calculated by Liu and Sawant29as well as Rogers et al.44and further support the applicability of the theory proposed by Liu and co-workers when considering the aqueous structures formed by our gellant.
■
CONCLUSIONIn this paper, we investigated a low-molecular-weight gelator that was found to form macroscopic structures in both organic and aqueous phases. Additionally, the macroscopic structures formed in aqueous phases were found to wick oil. Thus, one application for these aqueous gels could be as cleaning agents for oil spilled into aquatic environments that can be formed at a spill from a small quantity of gelator, water, and no additional organic solvent to overcome existing challenges of gelator deployment. Research toward cleaning up spilled oil should also anticipate potential changes in the use and distribution of liquid fuels in the future.
Several experiments were conducted to evaluate the uptake of oil by these aqueous gels and to identify the mechanisms responsible for their formation and performance. A simple Hele-Shaw cell was constructed to observe the wicking process as a function of time. The Washburn equation for wicking into porous media was utilized to calculate the equivalent pore radius of the aqueous gels, but was limited based on the volume change and apparent contraction of the macroscopic structure during wicking.
Rinsing the powdered gellant had a substantial effect on its ability to form a continuous, volume-spanning macrostructure. Using shear rheology and a modified Avrami equation, the gellant was found to grow as a fractal between one and two dimensions, with the presence of residual surfactant increasing the fractal dimension of growth. These initial experiments support the applicability of the thermodynamic first-principles theories of nucleation, growth, and crystallographic mismatch-ing proposed by Liu and co-workers for the formation of the macrostructure of the low-molecular-weight gelator from aqueous solution presented here. Differential scanning calorimetry provided insight into the dissolution of the gellant, but variable behavior observed in the heat flow during gelation limited its utility as a characterization technique.
Movie of the absorption of oil into, and the displace-ment of water from, the aqueous gel in the Hele-Shaw that was displayed as a sequence of images in Figure 5 (MP4)
■
AUTHOR INFORMATIONCorresponding Author
John M. Frostad − Department of Chemical and Biological Engineering and Food Science, University of British Columbia, Vancouver, British Columbia V6T 1Z3, Canada;
Email:[email protected]
Authors
Daniel J. Walls − Department of Chemical and Biological Engineering, University of British Columbia, Vancouver, British Columbia V6T 1Z3, Canada; orcid.org/0000-0002-2744-0722
Emilie Espitalié − Department of Chemical and Biological Engineering, University of British Columbia, Vancouver, British Columbia V6T 1Z3, Canada; Département de Génie Chimique, INP-ENSIACET, Université de Toulouse, 31030 Toulouse, France
Gabriel Hum − BC Research Inc., Richmond, British Columbia V6V 1M8, Canada
Jun Chen − BC Research Inc., Richmond, British Columbia V6V 1M8, Canada
Michael Gattrell − BC Research Inc., Richmond, British Columbia V6V 1M8, Canada
Anwu Li − BC Research Inc., Richmond, British Columbia V6V 1M8, Canada
Notes
The authors declare no competing financial interest.
■
ACKNOWLEDGMENTSThe authors are grateful for funding from the Mitacs Accelerate Industrial Postdoctoral Fellowship (D.J.W., J.M.F.) and the NRCan Oil Spill Response Science Program (G.H., J.C., M.G., A.L.). The authors would like to thank Brian Louie for laboratory support in conducting this study.
■
REFERENCES(1) Intergovernmental Panel on Climate Change, Global Warming of 1.5 °C; United Nations, 2018.https://www.ipcc.ch/sr15/.
(2) Fingas, M. The basics of oil spill cleanup; CRC Press, 2012. (3) Buist, I.; Potter, S.; Nedwed, T.; Mullin, J. Herding surfactants to contract and thicken oil spills in pack ice for in situ burning. Cold Reg. Sci. Technol. 2011, 67, 3−23.
(4) Gupta, D.; Sarker, B.; Thadikaran, K.; John, V.; Maldarelli, C.; John, G. Sacrificial amphiphiles: Eco-friendly chemical herders as oil spill mitigation chemicals. Sci. Adv. 2015, 1, No. e1400265.
(5) Bayat, A.; Aghamiri, S. F.; Moheb, A.; Vakili-Nezhaad, G. R. Oil Spill Cleanup from Sea Water by Sorbent Materials. Chem. Eng. Technol. 2005, 28, 1525−1528.
(6) Carmody, O.; Frost, R.; Xi, Y.; Kokot, S. Adsorption of hydrocarbons on organo-claysImplications for oil spill remediation. J. Colloid Interface Sci. 2007, 305, 17−24.
(7) Liu, Y.; Ma, J.; Wu, T.; Wang, X.; Huang, G.; Liu, Y.; Qiu, H.; Li, Y.; Wang, W.; Gao, J. Cost-Effective Reduced Graphene Oxide-Coated Polyurethane Sponge As a Highly Efficient and Reusable Oil-Absorbent. ACS Appl. Mater. Interfaces 2013, 5, 10018−10026.
(8) Ge, J.; Ye, Y.-D.; Yao, H.-B.; Zhu, X.; Wang, X.; Wu, L.; Wang, J.-L.; Ding, H.; Yong, N.; He, L.-H.; Yu, S.-H. Pumping through Porous Hydrophobic/Oleophilic Materials: An Alternative Technol-ogy for Oil Spill Remediation. Angew. Chem., Int. Ed. 2014, 53, 3612− 3616.
(9) Bhattacharya, S.; Krishnan-Ghosh, Y. First report of phase selective gelation of oil from oil/water mixtures. Possible implications toward containing oil spills. Chem. Commun. 2001, 185−186.
(10) Rosales, P. I.; Suidan, M. T.; Venosa, A. D. A laboratory screening study on the use of solidifiers as a response tool to remove crude oil slicks on seawater. Chemosphere 2010, 80, 389−395.
(11) Basak, S.; Nanda, J.; Banerjee, A. A new aromatic amino acid based organogel for oil spill recovery. J. Mater. Chem. 2012, 22, 11658−11664.
(12) Mukherjee, S.; Mukhopadhyay, B. Phase selective carbohydrate gelator. RSC Adv. 2012, 2, 2270−2273.
(13) Prathap, A.; Sureshan, K. M. A mannitol based phase selective supergelator offers a simple, viable and greener method to combat marine oil spills. Chem. Commun. 2012, 48, 5250−5252.
(14) Konda, M.; Maity, I.; Rasale, D. B.; Das, A. K. A New Class of Phase-Selective Synthetic β-Amino Acid Based Peptide Gelator: From Mechanistic Aspects to Oil Spill Recovery. ChemPlusChem 2014, 79, 1482−1488.
(15) Nikiforidis, C. V.; Gilbert, E. P.; Scholten, E. Organogel formation via supramolecular assembly of oleic acid and sodium oleate. RSC Adv. 2015, 5, 47466−47475.
(16) Ren, C.; Ng, G. H. B.; Wu, H.; Chan, K.-H.; Shen, J.; Teh, C.; Ying, J. Y.; Zeng, H. Instant Room-Temperature Gelation of Crude Oil by Chiral Organogelators. Chem. Mater. 2016, 28, 4001−4008.
(17) Ren, C.; Chen, F.; Zhou, F.; Shen, J.; Su, H.; Zeng, H. Low-Cost Phase-Selective Organogelators for Rapid Gelation of Crude Oils at Room Temperature. Langmuir 2016, 32, 13510−13516.
(18) Sundaravadivelu, D.; Suidan, M. T.; Venosa, A. D.; Rosales, P. I. Characterization of solidifiers used for oil spill remediation. Chemosphere 2016, 144, 1490−1497.
(19) Vibhute, A. M.; Muvvala, V.; Sureshan, K. M. A Sugar-Based Gelator for Marine Oil-Spill Recovery. Angew. Chem., Int. Ed. 2016, 55, 7782−7785.
(20) Li, J.; Huo, Y.; Zeng, H. Polar Solvent-Induced Unprecedented Supergelation of (Un)Weathered Crude Oils at Room Temperature. Langmuir 2018, 34, 8058−8064.
(21) Chen, J.; Boott, C. E.; Lewis, L.; Siu, A.; Al-Debasi, R.; Carta, V.; Fogh, A. A.; Kurek, D. Z.; Wang, L.; MacLachlan, M. J.; Hum, G. Amino acid-containing phase-selective organogelators: A water-based delivery system for oil spill treatment. ACS Omega 2020, 5 (30), 18758−18765.
(22) Yang, X.; Yan, L.; Ran, F.; Huang, Y.; Pan, D.; Bai, Y.; Shao, L. Mussel-/diatom-inspired silicified membrane for high-efficiency water remediation. J. Membr. Sci. 2020, 597, 117753.
(23) Yan, L.; Yang, X.; Long, J.; Cheng, X.; Pan, D.; Huang, Y.; Shao, L. Universal unilateral electro-spinning/spraying strategy to construct water-unidirectional Janus membranes with well-tuned hierarchical micro/nanostructures. Chem. Commun. 2020, 56, 478− 481.
(24) Motta, F. L.; Stoyanov, S. R.; Soares, J. B. P. Application of solidifiers for oil spill containment: A review. Chemosphere 2018, 194, 837−846.
(25) Petty, S.; Wakamiya, W.; English, C.; Strand, J.; Mahlum, D. Assessment of synfuel spill cleanup options; Pacific Northwest Laboratory: Richland, WA, 1982.
(26) Lee, P.; Rogers, M. A. Phase-Selective Sorbent Xerogels as Reclamation Agents for Oil Spills. Langmuir 2013, 29, 5617−5621.
(27) Raeburn, J.; Cardoso, A. Z.; Adams, D. J. The importance of the self-assembly process to control mechanical properties of low molecular weight hydrogels. Chem. Soc. Rev. 2013, 42, 5143−5156.
(28) Okesola, B. O.; Smith, D. K. Applying low-molecular weight supramolecular gelators in an environmental settingself-assembled gels as smart materials for pollutant removal. Chem. Soc. Rev. 2016, 45, 4226−4251.
(29) Liu, X.-Y.; Sawant, P. D. Determination of the Fractal Characteristic of Nanofiber-Network Formation in Supramolecular Materials. ChemPhysChem 2002, 3, 374−377.
(30) Liu, X.-Y.; Sawant, P. D.; Tan, W. B.; Noor, I. B. M.; Pramesti, C.; Chen, B. H. Creating New Supramolecular Materials by Architecture of Three-Dimensional Nanocrystal Fiber Networks. J. Am. Chem. Soc. 2002, 124, 15055−15063.
(31) Li, J.-L.; Liu, X.-Y. Architecture and engineering of a supramolecular functional material by manipulating the nanostructure of fiber network. Appl. Phys. Lett. 2005, 87, 113103.
(32) Liu, X.-Y. Gelation with Small Molecules: from Formation Mechanism to Nanostructure Architecture. Top. Curr. Chem. 2005, 256, 1−37.
(33) Wang, R.; Liu, X.-Y.; Xiong, J.; Li, J.-L. Real-Time Observation of Fiber Network Formation in Molecular Organogel: Super-saturation-Dependent Microstructure and Its Related Rheological Property. J. Phys. Chem. B 2006, 110, 7275−7280.
(34) Li, J.-L.; Liu, X.-Y. Architecture of Supramolecular Soft Functional Materials: From Understanding to Micro-/Nanoscale Engineering. Adv. Funct. Mater. 2010, 20, 3196−3216.
(35) Avrami, M. Kinetics of Phase Change. I General Theory. J. Chem. Phys. 1939, 7, 1103−1112.
(36) Avrami, M. Kinetics of Phase Change. II Transformation-Time Relations for Random Distribution of Nuclei. J. Chem. Phys. 1940, 8, 212−224.
(37) Avrami, M. Granulation, Phase Change, and Microstructure Kinetics of Phase Change. III. J. Chem. Phys. 1941, 9, 177−184.
(38) Leal, L. G. Advanced Transport Phenomena; Cambridge, 2007. (39) Vicsek, T. Fractal Growth Phenomena; World Scientific, 1989. (40) Huang, X.; Terech, P.; Raghavan, S. R.; Weiss, R. G. Kinetics of 5α-Cholestan-3β-yl N-(2-Naphthyl)carbamate/n-Alkane Organogel Formation and Its Influence on the Fibrillar Networks. J. Am. Chem. Soc. 2005, 127, 4336−4344.
(41) Marangoni, A. G.; Ollivon, M. Fractal character of triglyceride spherulites is a consequence of nucleation kinetics. Chem. Phys. Lett. 2007, 442, 360−364.
(42) Lam, R.; Quaroni, L.; Pedersen, T.; Rogers, M. A. A molecular insight into the nature of crystallographic mismatches in
self-assembled fibrillar networks under non-isothermal crystallization conditions. Soft Matter 2010, 6, 404−408.
(43) Ho Lam, R. S.; Rogers, M. A. Experimental validation of the modified Avrami model for non-isothermal crystallization conditions. CrystEngComm 2011, 13, 866−875.
(44) Rogers, M. A.; Liu, X.; Mallia, V. A.; Weiss, R. G. Dissecting kinetic pathways to formation of the fibrillar objects in molecular gels using synchrotron FT-IR. CrystEngComm 2015, 17, 8085−8092.
(45) Rogers, M. A.; Corradini, M. G.; Emge, T. Solvent induced supramolecular anisotropy in molecular gels. Mater. Chem. Phys. 2017, 194, 224−230.
(46) Hum, G.; Kurek, D. Z.; Li, A. Products and methods for the treatment of mixtures of water and hydrophobic liquids. Patent Application WO2019/232629A1.
(47) Jones, R. G.; Wilks, E. S.; Metanomski, W. V.; Kahovec, J.; Hess, M.; Stepto, R.; Kitayama, T. Compendium of Polymer Terminology and Nomenclature; The Royal Society of Chemistry, 2009. (48) Washburn, E. W. The dynamics of capillary flow. Phys. Rev. 1921, 17, 273−283.
(49) Berg, J. C. An introduction to interfaces and colloids: The bridge to nanoscience; World Scientific, 2010.