Crashworthiness Optimization of
Ultralight Metal Structures
by
Weigang Chen
B.S., Naval Architecture, Shanghai Jiao Tong University, 1992
M.S., Mechanical Engineering, Massachusetts Institute of Technology, 2000
M.S., Ocean Engineering, Massachusetts Institute of Technology, 2000
Submitted to the Department of Ocean Engineering
in Partial Fulfillment of the Requirements for the Degree of
Doctor of Philosophy in Applied Mechanics
at the
MASSACHUSETTS INSTITUTE OF TECHNOLOGY
February 2001
@Massachusetts
Institute of Technology 2001. All rights reserved.
Author...
..
...
...
...
Weigang Chen
January 26, 2001
C ertified by...
....----.--..---.
Tomasz Wierzbicki
Professor of Applied Mechanics
Thesis Supervisor
Accepted by..
MASSACHUSETrS INSTnrmr OF TECHNOLoGyAPR 1
8
Nicholas M. Patrikalakis
Kawasaki Professor of Engineering
Chairman, Department Committee on Graduate Students
Dynamic Stiffness and Transfer Matrix Analysis of Marine
Riser Vibration
by
Yongming Cheng
Submitted to the Department of Ocean Engineering on January 24, 2001, in partial fulfillment of the
requirements for the degree of Doctor of Philosophy
Abstract
This dissertation extends the use of the dynamic stiffness and transfer matrix methods in marine riser vibration. Marine risers possess a predominant chain topology. The transfer matrix method is appropriate for the analysis of such structures. Wave trans-mission and reflection matrices are formulated in terms of transfer-matrix elements. The delta-matrix method is introduced to deal with numerical problems associated with very long beams and high frequencies. The general internal relationships be-tween the transfer matrix and dynamic stiffness methods are derived and applied to the problem of a non-uniform beam with discontinuities. An implicit transfer matrix of a general non-uniform beam is derived.
The vibration analysis of non-uniform marine risers is addressed by combining the procedure of the dynamic stiffness method with the WKB theory. The WKB-based dynamic stiffness matrix is derived and the frequency-dependent shape function is expressed implicitly. The Wittrick-Williams algorithm is extended to the analysis of a general non-uniform marine riser, allowing automatic computation of natural frequencies. Marine riser models with complex boundary conditions are analyzed. The WKB-based dynamic stiffness method is improved and applied to a non-uniform beam system with discontinuities. A dynamic stiffness library is created.
Dynamic vibration absorbers and wave-absorbing terminations are investigated as a means of suppressing vibration. The optimal tuning of multiple absorbeis to a non-uniform beam system under varying tension is investigated. The properties of wave-absorbing terminations of a beam system are derived.
The vibration of two concentric cylinders coupled by the annulus fluid and by periodic centralizers is modeled. The effects of coupling factors on vibration are nu-merically evaluated. It is shown that a properly designed inner tubular member may be used to damp the flow-induced vibration of the outer cylinder.
Thesis Supervisor: J. Kim Vandiver Title: Professor of Ocean Engineering
Acknowledgment
First, I would like to express my deepest appreciation to my advisor, Professor Tomasz
Wierzbicki, for his continuous guidance, support and encouragement during the three
and half years of my study at MIT. I would also like to thank Professor Franz-Josef
Ulm, Professor Nicholas Patrikalakis, and Dr. Christopher Magee, for serving in my
dissertation committee and for their inspiring comments and discuosions.
I am very grateful to Dr. Tony Warren and Dr. Dubravko Nardini for giving me the
opportunity to work as a summer intern at Alcan International, Banbury Laboratory
in England, where all the specimens used in this thesis were manufactured and some
preliminary tests were conducted. Thanks are also extended to Mr. Stephen Rudolph
and Mr. Jim Tansley for their assistance in preparing specimens and conducting tests.
My appreciation goes out to my colleagues at the Impact and Crashworthiness
Lab-oratory. In this intellectually enlightening and friendly work environment, I have
the opportunity to work together with many brilliant staff members and fellow
stu-dents. In particular, I would like to thank Dr. Mulalo Doyoyo for proof-reading the
manuscript, and for his valuable comments and discussions. Thanks are also due to
Mr. Heung-Soo Kim for his technical assistance on computer system.
I gratefully acknowledge all the members of the Joint MIT/Industry Ultralight
Con-sortium for their financial support of this research.
Last, but not the least, I would like to thank my wife Zhenrong for her encouragement
and patience during this study.
Contents
1
Introduction
1.1
Motivation . . . .
1.2 Research Objective . . . .
1.3 Overview of the Thesis . . . .
28
28
30
31
2 Ultralight Core Materials and Ultralight Structures
34
2.1
Introduction...
34
2.2 Aluminum Foam . . . .
35
2.2.1
Production Process of Aluminum Foam . . . .
35
2.2.2
Mechanical Behavior of Aluminum Foam . . . .
38
2.3 Aluminum Honeycomb . . . .
45
2.3.1
Production Process of Aluminum Honeycomb . . . .
46
2.3.2
Mechanical Behavior of Aluminum Honeycomb
. . . .
47
3 Axial Crushing of Ultralight Structures
3.1 Single-cell and Multi-cell Thin-walled Extrusions . . . .
3.1.1 Superfolding Element Theory . . . .
3.1.2 Simplified Superfolding Element Theory for Multi-cell Sections
3.1.3 Numerical Simulations of Multi-cell Sections . . . .
3.1.3.1
Finite Element Modeling . . . .
3.1.3.2 Numerical Results . . . .
3.2 Foam-filled Extrusions . . . .
3.2.1
Foam-filled Single-cell Sections . . . .
3.2.2
Foam-filled Multi-cell Sections . . . .
3.2.2.1
Finite Element Modeling . . . .
3.2.2.2 Numerical Results . . . .
3.2.2.3 Mean Crushing Force Prediction . . . .
3.2.3 Discussions . . . .
3.3 Foam-filled Sheet Profiles . . . .
3.3.1 Experimental Details . . . .
3.3.1.1 "Standard" Hat Section . . . .
3.3.1.2
Foam-fitting . . . .
3.3.1.3 Joining Techniques . . . .8
54
56
56
60
65
66
67
70
70
72
73
74
76
78
81 8181
83
87
3.3.1.4 Material Properties . . . . 87
3.3.1.5
Triggering . . . .
90
3.3.1.6
Axial Crushing Tests . . . .
91
3.3.2 Test Results . . . . 92
3.3.2.1
Empty Profiles . . . .
92
3.3.2.2
Foam-filled Profiles . . . .
97
3.3.3 Energy Absorption and Specific Energy Absorption . . . . 106
3.3.4 Discussions . . . . 107
4 Bending Collapse of Ultralight Structures 110 4.1 Experimental and Numerical Study on Foam-filled Hat Profiles . . . . 112
4.1.1 Experimental Study . . . . 112
4.1.1.1 Specimen Preparation . . . . 112
4.1.1.2 Material Properties . . . . 113
4.1.1.3 Experimental Design . . . . 113
4.1.1.4
Stage I: Three-point Bending . . . .
115
4.1.1.5 Stage II: Vertical Compression . . . . 119
4.1.1.6 Moment-rotation Characteristics . . . . 126
4.1.1.7 Energy Absorption and Specific Energy Absorption . 131
4.1.2
Numerical Study . . . .
134
4.1.2.1
Finite Element Modeling . . . .
134
4.1.2.2
Material Modeling . . . .
135
4.1.2.3 Numerical Results . . . . 137
4.1.3
Discussions . . . .
143
4.2 Quantifying the Strengthening Effect of Ultralight Filler . . . . 144
4.2.1 Plastic Bending Resistance of Empty Square Sections . . . . . 144
4.2.2 Plastic Bending Resistance of Foam-filled Sections . . . . 146
4.2.3 Numerical Simulation of Bending Collapse of Foam-filled Beams 147
4.2.3.1
Finite Element Modeling . . . .
148
4.2.3.2
Material Modeling . . . .
148
4.2.3.3 Numerical Results . . . . 149
4.2.4 The Bending Moment Elevations due to Foam Filling . . . . . 152
4.2.5 The Bending Moment Elevations due to Honeycomb Filling. . 154 4.2.6 Comparison Between Foam and Honeycomb Fillings . . . . 158
5 Torsional Crushing of Foam-filled Thin-walled Thbes
160
5.1 Thin-walled Empty Square Tubes . . . . 1625.1.1 Numerical Solutions . . . . 162
5.1.1.1
Finite Element Modeling . . . .
162
5.1.1.2 Deformation Pattern . . . . 164
5.1.1.3 Plastic Resistance . . . .
5.1.2 Theoretical Solution . . . .
5.1.2.1 Theoretical Formulation . . . .
5.1.2.2 The Deformation Modes . . . .
5.1.3 Critical Twisting Rotation for Plastic Buckling . . . .
5.1.4 Comparison Between Theoretical Solution and Finite element Solution . . . .
5.2 Plastic Resistance of Thin-walled Rectangular and Hexagonal Tubes .
5.2.1 Theoretical Solution . . . .
5.2.2 Numerical Study . . . .
5.3 Foam-filled Thin-walled Tubes . . . .
5.3.1 Upper Bound of Torsional Resistance . . . .
5.3.2 Lower Bound on Torsional Resistance . . . .
5.3.3 Torsional Resistance of the Foam Core . . . .
5.3.4 Numerical Simulations . . . .
5.3.4.1
Finite Element Modeling . . . .
5.3.4.2
Failure Modes . . . .
5.3.4.3 Plastic Resistance... . . . .5.3.5
Strengthening Effect of Foam Filling . . . .
5.3.5.1
Twisting Moment Elevation due to Foam Filling.
.165
166
167
169
176
179
181
181
182
185
186
187
188
190
190
191
193
194
194
5.3.5.2
Quantifying the Strengthening Effect . . . .
196
5.4 Experimental Study . . . . 199 5.4.1 Experimental Design . . . . 199 5.4.2 Specimens . . . . 2015.4.3
Testing Results . . . .
201
5.5 Summary . . . . 2066 Design Optimization of Ultralight Structures 208 6.1 General Formulation . . . . 210
6.2 Solution Algorithms . . . . 211
6.2.1 Graphical Approach . . . . 212
6.2.2 Sequential Quadratic Programming . . . . 212
6.3 Optimization for Axial Crushing . . . . 213
6.3.1 Formulation . . . . 213
6.3.2 Summary of Crush Resistance of Thin-walled Columns with
Ultralight Filler . . . .
216
6.3.3 Optimization of Foam-filled Square Section . . . . 220
6.3.3.1 Empty Square Section . . . . 220
6.3.3.2 Foam-filled Square Sections . . . . 223
6.3.4 Optimization of Other Sections . . . . 232
6.3.4.1
Foam-filled Hexagonal Section . . . .
233
6.3.4.2
Foam-filled Double-hat Rectangular Section . . . . .
235
6.3.4.3
Foam-filled Double-hat Hexagonal Section . . . .
237
6.3.4.4
Double-walled Sandwich . . . .
239
6.3.5
Discussions . . . .
242
6.4 Optimization for Bending Collapse . . . . 242
6.4.1 Optimization of Foam-filled Sections . . . . 244
6.4.2 Optimization of Honeycomb-filled Sections . . . . 246
6.5 Optimization for Combined Compression/Bending Loading . . . . 248
6.5.1 Optimization Formulation . . . . 249
6.5.2 Optimum Solutions . . . . 250
6.6 Optimization for Torsional Crushing . . . . 254
6.7 Discussions . . . . 257
7 Conclusions and Recommendations 260 7.1 Conclusions . . . . 260
7.2 Future Research . . . . 263
List
of Figures
2.1
Aluminum foam (a) Hydro (b) IFAM ...
37
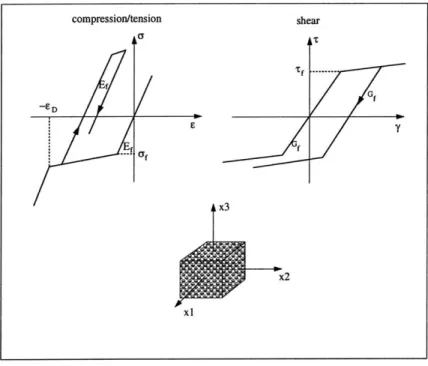
2.2 Compressive stress-strain curve of aluminum foam . . . .
38
2.3
Tensile stress-strain curve of aluminum foam . . . .
39
2.4 Yield surfaces. (a)Von Mises model (b)Drucker-Prager model (c)Modified
Drucker-Prager model (d) Maximum principal stress criterion
. . . .
42
2.5 Yield surfaces in biaxial loading. Solid line:the maximum principal
stress yielding model. Dotted line: Gibson's model. Dashed line:
Deshpande & Fleck model . . . .
... ... ...42
2.6 The Arcan apparatus with a butterfly cellular solid specimen at the
center . . . .
43
2.7 Material model for the aluminum foam used in numerical simulation .
44
2.8 Expansion process of aluminum honeycomb production . . . .
46
2.9 Corrugated process of aluminum honeycomb production . . . .*...47
2.10 Compressive stress-strain curve for Hexcel Aluminum honeycomb
. .
48
2.11 The material modeling of aluminum honeycomb in the numerical analysis 49
2.12 Aluminum foam and aluminum honeycomb filled extrusions . . . .
51
2.13 Aluminum foam-filled single-hat and double-hat profiles . . . . 51
2.14 Double-walled sandwich components . . . . 52
3.1 The geometry of the Superfolding Element . . . . 57
3.2 Basic folding mechanism in Superfolding Element theory . . . . 58
3.3 Single-cell, double-cell and triple-cell cross-sections . . . . 61
3.4 The global geometry of the basic folding mechanism. (a) Before defor-mation. (b) After defordefor-mation. (c) Side view . . . . 61
3.5 Extensional elements and bending hinge lines . . . . 62
3.6 A simplified model of post-deformation geometry . . . . 63
3.7 Energy equivalent flow stress . . . . 65
3.8 Triggers introduced in the finite element models . . . . 66
3.9 Tensile stress-strain curve of AA6061 T4 . . . . 67
3.10 Deformation patterns of single-cell, double-cell and triple-cell columns 67 3.11 Crushing force responses of single-cell, double-cell and triple-cell columns 68 3.12 Mean crushing forces predicted by theoretical solutions and by numer-ical simulations . . . . 68
3.13 Mean crushing force elevation due to foam filling:experiments and
pre-diction... . . . .
. . . ...
.
...
72
.
3.14 Foam-filled double-cell and triple-cell sections . . . . 73
3.15 Deformation patterns of column walls of double-cell and triple-cell filled with 10% relative density foam . . . . 74
3.16 Crushing force responses of foam-filled double-cell columns . . . . 75
3.17 Crushing force responses of foam-filled triple-cell columns . . . . 75
3.18 The increase of mean crushing strength due to foam filling for double cell . . . . 77
3.19 The increase of mean crushing strength due to foam filling for triple cell 77 3.20 Specific energy absorptions of various types of columns . . . . 79
3.21 A "Standard" open hat section . . . . 82
3.22 Geometry of a single-hat section (empty and foam-filled) . . . . 82
3.23 Geometry of a double-hat section (empty and foam-filled) . . . . 82
3.24 Geometry of a double-hat with center flange section (empty and
foam-filled)...
...
83
3.25 Precisely fitted sections . . . . 83
3.26 Illustration of pre-compression fitting . . . . 84
3.27 Illustration of pre-compression fitted open hat with small slant angles 85 3.28 Pre-compression fitted sections . . . . 85
3.29 Illustration of adhesive bond fitting . . . . 86
3.30 Adhesive bond fitted sectioned . . . . 86
3.31 Typical tensile stress-strain curves of aluminum alloy HS5754, 2.0mm
gauge . . . .
88
3.32 Stress-strain curve of aluminum foam in uni-axial crushing . . . . 89
3.34 Triggers on the axial crushing members . . . . 90
3.35 Trigger jig for axial crushing specimens . . . . 90
3.36 Some of the pre-test specimens . . . . 91
3.37 Testing machines . . . . 91
3.38 Asymmetric folding mechanism of a single hat empty column . . . . . 92
3.39 Crushing force response of empty single hat members . . . . 93
3.40 Crushing force response of empty double-hat members . . . . 96
3.41 Crushing deformation of double hat columns. Left: double-hat w/o center plate. Right: double-hat w/ center plate . . . . 96
3.42 The crushing force of empty double-hat columns with center plates . 97 3.43 Crush deformation of single-hat foam-filled members. Left: specimen
S4. Right: specimen S43 . . . .
99
3.44 Crush deformation of single-hat foam-filled columns with rivets added. Left: specimen S3. Right: specimen S81 . . . . 99
3.45 Crush deformation of single-hat foam-filled member (Specimen S2) . . 100
3.46 The crushing forces of single-hat foam-filled specimens . . . . 100
3.47 Crush deformation of double-hat foam-filled column (Specimen S6) . 101 3.48 Crush deformation of double-hat foam-filled columns. Left: specimen
S44. Right: specimen S45 . . . .
102
3.49 Crush deformation of double-hat foam-filled columns. Left: specimen
S10. Right: specimen S8 . . . .
102
3.50 Crushing force responses of double-hat foam-filled columns . . . . 103
3.51 Crush deformation of double-hat foam-filled columns. Left: specimen
S13. Right: specimen S46 . . . .
104
3.52 Crush deformation of double-hat foam-filled columns. Left: specimen
S15. Right: specimen S14 . . . .
105
3.53 Crushing forces of double-hat foam-filled columns with center plates . 105
4.1 Experimental setup for the deep bending tests. (a) stage 1; (b) stage 2 114
4.2 A specially designed end fixture . . . . 114
4.3 Post-test specimens of bending stage I . . . . 116
4.4 The deformation patterns of single-hat beams after three-point
bend-ing(left:empty; right:filled) . . . .
117
4.5 The deformation patterns of double-hat beams after three-pointbend-ing (left:empty; right:filled) . . . .
117
4.6 The deformation patterns of double-hat with closure beams afterthree-point bending (left:empty; right:filled) . . . .
117
4.7 The punch force-displacement curves of single-hat beams . . . . 1184.8 The punch force-displacement curves of double-hat beams . . . . 118
4.9 The punch force-displacement curves of double-hat with closure beams 119
4.10 Vertical compression configuration for the second bending stage . . . 120
4.11 Compressive force-displacement responses of single-hat beams . . . . 121
4.12 Compressive force-displacement responses of double-hat beams . . . . 121
4.13 Compressive force-displacement responses of double-hat with closure beam s . . . . 122
4.14 Bending deformations of empty single-hat beam (from left to right:
first jamming, second fold, second jamming) . . . . 123
4.15 Bending deformations of filled single-hat beam (from left to right: first jamming, second fold, second jamming, third fold) . . . . 123
4.16 Bending deformations of empty and filled single-hat beams(left:empty;
right: filled) . . . .
124
4.17 Cut-through of empty and filled single-hat beams(left:empty; right:
filled) . . . .
124
4.18 Bending deformations of empty double-hat beams(left:first fold; right:
jam m ing) . . . .
125
4.19 Bending deformations of filled double-hat beams(left to right: first fold, first jamming, subsequent folds and jammings) . . . . 125
4.20 Negative curvature and fracture at the tensile flange of double-hat beam126 4.21 Moment-rotation responses of single-hat beams . . . . 128
4.22 Moment-rotation responses of double-hat beams (Note a sudden drop in strength of fractured beam dbl-bf3) . . . . 129
4.23 Moment-rotation responses of double-hat with closure beams (Note a sudden drop in strength of fractured beams dblc.bfl and dblc-bf2) . . 129
4.24 The generalized plastic hinge subjected to bending moment and axial com pression . . . . 130
4.25 An illustration of partial filling . . . .
132
4.26 The finite element model of a single-hat beam . . . . 134
4.27 The material model for aluminum foam in L-direction . . . . 136
4.28 The material model for aluminum foam in W-direction ... 136
4.29 The material model for aluminum foam in T-direction . . . . 137
4.30 The deformation modes of empty single-hat beams at the end of bend-ing stage I: numerical and experimental . . . . 138
4.31 The deformation modes of filled single-hat beams at the end of bending stage I: numerical and experimental . . . . 139
4.32 Cut-through view of filled single-hat beams at the end of bending stage I: numerical and experimental . . . . 139
4.33 Bending collapse deformation of empty beams at the end of bending stage II: numerical and experimental . . . . 140
4.34 Cut-through view of empty beams at the end of bending stage II: numerical and experimental . . . . 140
4.35 Bending collapse deformation of filled beams at the end of bending stage II: numerical and experimental . . . . 141
4.36 Cut-through of filled beams at the end of bending stage II: numerical and expeririiental . . . ... . . . . 141 4.37 The punch force-displacement responses of beams in bending stage I . 142
4.38 The compressive force-displacement responses of beams in bending
stage II . . . .
142
4.39 A simplified model of bending collapse of a thin-walled beam . . . . . 1444.40 Schematicai illustration of the moment increase resulting from foam
filling . . . .
146
4.41 A foam-filled thin-walled square beam undergoing bending . . . . 1484.42 Stress-strain curves of stainless steel Cr18Ni8 . . . . 149
4.43 Deformation patterns of empty beam: experimental and numerical . . 150
4.44 Deformation pattern of foam-filled beam: experimental and numerical 150
4.45 Deformation patterns of foam-filled hat sections(left:non-filled;
right:foam-filled). . . . .
151
4.46 Punch force-displacement response of beams . . . . 1514.47 Bending moment-rotation response of beams . . . . 152
4.48 Rectangular hat section tested by BMW . . . . 153
4.49 Bending moment elevation resulting from foam filling . . . . 154
4.50 The deformation pattern of a honeycomb-filled beam (relative density
0.15) . . . .
155
4.51 The moment-rotation responses of beams . . . . 1574.52 Bending moment elevation resulting from honeycomb filling . . . . 157
4.53 Comparison of strengthening effects of foam filling and honeycomb filling158
5.1 An illustration of Audi A8 space frame structure . . . . 161
5.2 A thin-walled square tube under torsional loading . . . . , . . . . 163
5.3 Finite Element Model of the tube . . . . 163
5.4 Deformed shape of the thin-walled square tube at 450 rotation (nor-malized rotation 0.0785) . . . . 165
5.5 Evolution of the shape at the mostly deformed cross-section . . . . . 165
5.6 Torsional plastic resistance of thin-walled square tubes (To normalize, plot 2T vs with ao = 105.4MPa, t = 1mm and corresponding b
and I) . . . .
166
5.7 Theoretical pre-buckling deformation of a square tube under torsion . 169
5.8 An axially free tube with displacement UO . . . . 171
5.9 Theoretical buckling deformation of the cross-section under torsion 172
5.10 Buckling deformation of a square tube under torsion . . . . 173
5.11 Deformed sections along the tube . . . . 174
5.12 Most-deformed section . . . . 175
5.13 Equivalent tube with spreaded most-deformed area when 0 > 0" . . 176
5.14 Torsional buckling of a cylindrical shell (n=2) . . . .
177
5.15 Torsional buckling mode of a cylindrical shell (n=4) . . . .
178
5.16 Plastic resistance of square tubes of alloy AA6063 T7 (Solid lines:analytical
model; dotted lines: FEM results. To normalize, plot 2TJ vs b with -o = 105.4MPa, t = 1mm and corresponding b and 1) . . . . 180
5.17 Rectangular and hexagonal tubes subjected to torsion . . . . 181
5.18 Plastic deformation of a rectangular tube at 900 rotation . . . . 183
5.19 Plastic deformation of a hexagonal tube at 90* rotation . . . . 183
5.20 Torsional resistance of rectangular tubes(Q/b = 5, b/t = 50) . . . . 184
5.21 Torsional resistance of hexagonal tubes( = 250mm, t = 1mm; The
unit for b in figure is also mm) . . . . 185
5.23 An equivalent foam cylinder subjected to torsion . . . . 188
5.24 A foam-filled tube subjected to torsion . . . . 190
5.25 Deformed shapes of square tubes at 45*: empty . . . . 191
5.26 Deformed shapes of square tubes at 450: unbonded foam filling (o-=
0.689M Pa) . . . .
191
5.27 Deformed shapes of square tubes at 45*: Bonded foam-filling(o- =
0.689M Pa) . . . .
192
5.28 Evolution of shapes at the mostly deformed cross-sections. Upper row
empty tube; Middle row unbonded filling; Lower row bonded filling . 192
5.29 Possible modes of cross-sectional deformation. Shaded areas denote
the crushed foam. . . . . 193
5.30 Torsional resistance of foam-filled square tubes . . . . 194
5.31 Strengthening effect of foam filling . . . .
196
5.32 Torque responses of empty and filled tubes up to 900 twisting rotation 197
5.33 Curve-fitted AT and AO . . . .
198
5.34 Testing rig design . . . .
200
5.35 Design details of the lever arm . . . . 200
5.36 Engineering stress-strain curve of AA6063 T7 . . . . 201
5.37 Torsional deformation shapes: experimental and numerical . . . . 202
5.38 Sectional deformation: experimental, numerical and model . . . . 203
5.39 Torsional resistance of empty tube:analytical, numerical and
experi-mental (To normalize, plot 2 t vs b9 with corresponding b, t,I and
ao).. . . . .
...
204
5.40 Deformation shapes of a foam-filled tube: experimental and numerical 204
5.41 Sectional deformation of foam-filled tubes: experimental and numerical 204
5.42 Torsional resistance of foam-filled tube: experimental and numerical . 205
5.43 Torque-twist curves for tested specimens(S1 and S2 are empty tubes; the others are foam filled ones) . . . . 205
5.44 Welding failure of the end fixture of a tube . . . . 206
6.1 A foam-filled thin-walled column subject to axial crushing . . . . 213
6.2 An illustration of crushing force response . . . . 214
6.3 Various foam-filled sections . . . . 216
6.4 Empty thin-walled sections (i) hexagonal; (ii) double-hat rectangular;
(iii) double-hat hexagonal . . . .
217
6.5 Geometry of foam-filled square and hexagonal section . . . . 218
6.6 Geometry of foam-filled double-hat rectangular section . . . . 218
6.7 Geometry of double-walled sandwich section . . . . 219
6.8 Graphical approach for optimization with fixed b and 0o . . . . 225
6.9 Graphical approach for optimization with oo = 106.1 MPa and t=0.8mm226
6.10 Specific energy absorption under various conditions . . . . 230
6.12 Geometry of a foam-filled hexagonal section . . . .
233
6.13 Specific energy absorptions of hexagonal sections . . . .
234
6.14 Geometry of a foam-filled double-hat rectangular section . . . .
235
6.15 Specific energy absorption of double-hat rectangular sections ...
236
6.16 Geometry of a foam-filled double-hat hexagonal section . . . .
237
6.17 Specific energy absorptions of double-hat hexagonal sections . . . . .
238
6.18 Geometry of double-walled sandwich section . . ...
...
239
6.19 Specific energy absorptions of double-walled sandwich sections . . . . 241
6.20 Specific energy absorption vs. target force level for various sections .
243
6.21 Specific energy absorptions at various energy absorption levels . . . . 248
6.22 Transition from axial progressive crushing to global bending collapse .
249
6.23 Specific energy absorption at various energy absorption levels . ..-....
252
6.24 Specific energy absorption at various transition ratio . . . .
253
6.25 Graphical approach to solve the optimization problem with two active
design variables . . . .
255
6.26 Specific energy absorption of filled and non-filled tubes . . . .
257
List of Tables
2.1 The mechanical properties of aluminum honeycomb . . . . 50
3.1 Mechanical properties of aluminum alloy HS5754 . . . . 87
3.2 Mechanical properties of adhesive XD4600 . . . . 88
3.3 Details of the specimens for axial crushing tests . . . . 94
3.4 Energy absorption and specific energy absorption of the specimens . . 106
4.1
Summary of specimens (SH=Single-hat; DH=Double-hat;
DHC=Double-hat with closure). Parameters a, b, and s are referred to Fig.3.22 ^Fig.3.24 . . . .
115
4.2 The summary of specimens in the bending stage II (SH=single-hat;DH=double-hat; DHC=double-hat with a center flange; E=empty; F=filled). Parameters R, e,
Gj,
A and8
are referred to Fig.4.10 . . . 120 4.3 The moment drop at transition point of two bending stages . . . . 1314.4 Energy absorption and specific energy absorption of specimens (8f =
1500) . . . . 133
4.5 The predictions of bending moment elevation AM . . . . 153
5.1 Strain hardening data for AA6063 T7 . . . .
164
5.2 Specimen summary . . . 202
6.1 Optimization solutions with t unconstrained . . . 228
6.2 Optimization solutions with t
=
[0,4] . . . .
.
228
6.3 Optimization solutions with t
=
[0,3] . . . .
.
.
229
6.4 Optimization solutions with t
=
[0,2] . . . .
.
.
229
6.5 Optimization solutions with EI varying . . . a...
231
6.6 Optimization solutions of hexagonal sections . . . *...234
6.7 Optimization solutions of double-hat rectangular sections . . . 236
6.8 Optimization solutions of double-hat hexagonal sections . . . 238
6.9 Optimization solutions of double-walled sandwich sections (H:honeycomb;
F: foam)...241
6.10 Optimum solutions for foam-filled and empty sections . . . 245
6.11 Optimum solutions for honeycomb-filled and empty sections ...
247
6.12 Optimum results (SE = 0.7, =
0.2,G0
= 300)... 2516.13 Optimum results (SE
=
0.7, E
=8kJ, Oo
=
30*) . . . .
253
6.14 Optimum solutions for foam-filled and empty sections . . . 256
Chapter 1
Introduction
1.1
Motivation
The term "crashworthiness" evolved around 1950s and was first associated with
avia-tion safety [1]. It refers to the capacity of a vehicle or component to provide occupant
protection during potentially survivable collisions. A crashworthy design should be
able to dissipate in a controlled manner the kinetic energy of the impact, and to
retain a survival space for occupants and to attenuate the forces and accelerations
experienced by the occupants. Because of the very demanding requirement of crash,
it is plausible that the crush criteria will dominate the structural design of a vehicle
body. Well designed crashworthy structures will, as a rule, meet the general stiffness
criteria set by other requirements such as NVH (Noise, Vibration and Harshness) [1].
The most important challenge for today's automotive engineers is to design vehicles
that are not only structural safe, but also light, fuel efficient and environmentally
friendly. The quest for reduction of vehicle weight without jeopardizing structure's
crash performance has led to investigating structural materials other than steel, such
as, aluminum, composite, magnesium, etc. Among others, aluminum appears to be
the most attractive material due to its low specific weight, recycling potential and
excellent corrosion resistance. Aluminum space frame and extruded aluminum
com-ponents have been used in the automotive industry (for example, Audi A8 and Audi
A12). It was proved that excellent crash performance as well as other performance
parameters can be achieved by aluminum structures while satisfying weight saving targets.
In order to achieve the weight reduction without compromising the vehicle crashwor-thiness, structural stiffening methods have also been investigated. Thornton et al. [2, 3] proposed a method to reinforce thin-walled components by filling the empty space with polyurethane foam. They found that the filling may be of benefit on a weight effectiveness basis only for thin-walled sections made from high density, low strength material, e.g. mild steel. However, when the wall thickness of a section is reduced below a certain limit, the range of useful wall thickness for which foam reinforcement is weight effective tends to be of no practical use. These conclusions were substantially verified by a later study by Lampinen and Jeryan [4] who devel-oped regression models to predict the load capacity and axial collapse of polyurethane foam-filled sections.
Recent advances in cost-effective process for the production of utralight ( < 20%
of solid aluminum) cellular materials, such as aluminum foams and aluminum hon-eycombs, has cleared the way for using these materials as reinforcement to exist-ing thin-walled structural members. The motivation for usexist-ing the ultralight metal core is to increase the rigidity of the thin-walled members and therefore increase the energy absorption while minimizing additional weight penalty. Santosa and Wierzbicki [5, 6, 7, 8,
9,
10, 11] carried out extensive numerical studies on the crash behavior of thin-walled prismatic structural members with ultralight filler subjected to axial compression, bending and torsional loadings. It was found in their studies that superior weight efficiency can be achieved for thin-walled members filled with the ultralight metal core. Seizberger et al. [12, 13] conducted experimental study on the axial crushing of steel columns filled with aluminum foam. They reported that considerable weight efficiency improvements with respect to energy absorption were obtained by foam filling. Comprehensive experimental studies on the effect of filling thin-walled square and circular aluminum extrusions with aluminum foam were car-ried out by Hanssen et al. [14, 15, 16]. They concluded that foam-filled extrusions are advantageous over empty ones in terms of least weight where high levels of energy absorption are required.In the present research, extensive theoretical, numerical and experimental studies
are carried out on the axial crushing, bending collapse and torsional deformation of thin-walled structures filled with ultralight metal core material (aluminum foam or honeycomb). A clear physical understanding of the crush mechanics of such ul-tralight structures is achieved. The strengthening effects of the filling are revealed and quantitatively assessed. With this fundamental work, the optimization problem of ultralight structures for minimum weight is formulated and a methodology is de-veloped, which combines the above results with numerical optimization techniques, to determine among all feasible options an optimum design of structural geometry and material properties for the minimum weight while satisfying the requirements of structural integrity and crashworthiness.
1.2
Research Objective
The objective of the present research is to study the crushing behavior of two new types of structural components, i.e., aluminum foam-filled thin-walled members and aluminum honeycomb-filled members, and then to optimize such components with crashworthiness constraints.
A number of new contributions are generated from this research
* An analytical solution for mean crushing force of multi-cell sections is developed, based on the Superfolding Element theory. Closed-form solutions are derived to predict the mean crushing forces of foam-filled multi-cell sections.
* Technologies of manufacturing foam-filled closed-hat profiles and joint tech-niques are investigated.
* Axial crushing tests are conducted on foam-filled hat profiles to study their collapse behavior, energy absorption and weight efficiency.
* Experiments of bending up to 1500 on filled beams are performed. Numerical simulations of bending collapse are also carried out. The strengthening effects of filling are quantitatively assessed based on the results of numerical and physical experiments.
* Theoretical models of torsional crushing of empty and filled thin-walled pris-matic tubes are developed. Solutions are validated by numerical simulations and physical testing. The strengthening effects of foam filling are quantified.
* A new methodology of design optimization of ultralight structures for minimum weight with crashworthiness constraints is developed.
1.3
Overview of the Thesis
The present thesis is organized into seven chapters and a bibliography of cited refer-ences.
In Chapter 9, two types of ultralight cellular solid materials (aluminum foam and hon-eycomb) used as core materials in ultralight structures are discussed. The production process and the mechanical behavior of these two materials are addressed. The yield criteria of the materials present in literature are reviewed, and the simple maximum principal stress yield model employed in the numerical simulations in the present re-search is discussed. Finally, the ultralight structural components studied in this thesis are briefly introduced, and they are aluminum foam or honeycomb filled extrusions, aluminum foam-filled hat profiles, and double-walled sandwich components.
Chapter 3 investigates the axial crushing behavior of empty and foam-filled
double-cell and triple-double-cell extrusions and foam-filled hat profiles. Based on the Superfolding
Element theory, an analytical solution for the mean crushing force of multi-cell
sec-tions is derived, and the solution is compared with numerical predicsec-tions. Numerical studies are then carried out in the second part of this chapter on the axial crushing of foam-filled multi-cell columns. With the numerical results of filled columns and analytical solutions for non-filled columns, closed-form solutions are derived to pre-dict the mean crushing strength of the foam-filled double-cell and triple-cell sections. The relative merits in energy absorption of multi-cell and foam-filled sections are discussed.
In the third part of Chapter 3, experimental study is conducted on the axial crushing behavior of aluminum foam-filled hat profiles. A total of 34 specimens are tested,
which are of three different section types, i.e., single-hat, double-hat, double-hat with a center flange. Various processes of fitting foam into hat sections and joint techniques are investigated. The experiments revealed important features of axial crushing behavior of empty and foam-filled hat profiles. Joint techniques should be the point of concern. The spot-welding and weld-bond schemes, which appear sufficiently strong for empty members, are not strong enough for foam-filled members. Finally, the relative merit of foam-filled members compared to non-filled ones are quantified
by performance tests.
The first part of Chapter
4
presents the experimental results of aluminum foam-filled hat profiles undergoing bending collapse. Quasi-static bending tests are carried out on empty and foam-filled single and double-hat beams. A new experimental approachis applied so that the specimens can undergo large bending angles up to 1500. Salient features of the deep bending behavior of empty and filled hat members are revealed in the experiments.
The strengthening effects of the foam and honeycomb fillings on the plastic resis-tance of thin-walled beams in bending collapse mode are then studied numerically in
Chapter
4.
The increase in bending resistance resulting from filling is quantified, and closed-form expressions are derived based on the analytical solutions, experimental data and numerical results. The densities of the cellular solid fillers considered in the study are up to 20% relative density, which is of practical interest.Torsional crushing behavior of empty and foam-filled thin-walled tubes are discussed in Chapter 5. An analysis by applying the principle of virtual velocities to kinemat-ically admissible displacement fields is conducted to predict the torsional behavior of thin-walled tubes with large plastic deformations. Three successive deformation phases, namely pre-buckling, cross-section buckling, and collapse-spreading phase, are identified. The analytical model is then extended to the cases of thin-walled rect-angular and hexagonal tubes. Numerical simulations are carried out and the results are compared with the analytical solutions.
Of particular interest in crashworthiness application is the effect of the lightweight
metal filler on the resistance and energy absorption of a structural member. The torsional collapse behavior and plastic resistance of thin-walled tubes filled with alu-minum foam are investigated theoretically and numerically in the second part of
Chapter 5. It is found that the presence of the filler acting as elastic-plastic
foun-dation to the skin changes the sectional buckling mode into higher ones, and hence
increases the torsional resistance. The upper and lower bounds on the torsional
resis-tance of filled tubes are established approximately. Numerical simulations are carried
out. The torsional resistance elevation due to filling is quantitatively assessed, and
closed-form expressions are derived based on the analytical solutions and numerical
results. Finally, results of torsional experiments on empty and foam-filled square tubes
are presented. Results are used to validate the theoretical and numerical solutions.
The fundamental work discussed in previous chapters is of great importance in
achiev-ing a clear physical understandachiev-ing of the crush mechanics of ultralight structures. The
strengthening effects of the core material under various loading conditions are
investi-gated and quantified. In particular, closed-form solutions are developed based on
nu-merical simulations, physical experiments and theoretical considerations. This forms
the basis of an optimization methodology proposed in Chapter 6. The methodology
combines the numerical optimization techniques with the above results in the crush
mechanics of ultralight structures. The optimization formulations are constructed
on a component level for the minimum weight with the constraints of
crashworthi-ness and elastic bending stiffcrashworthi-ness. Design optimization of various sections are carried
out using the proposed methodology to decide the most weight-efficient design for
crash energy management in axial crushing, bending collapse and torsional crushing
loadings. It is shown that the proposed methodology is suitable for the early-stage
component design with very little computational effort.
Finally, a summary of the results is presented in Chapter 7. Recommendations for
future research are suggested.
Chapter 2
Ultralight Core Materials and
Ultralight Structures
2.1
Introduction
Highly porous metallic materials with a cellular structure have many attractive
char-acteristics, including low density, good acoustic and thermal resistance, and high
compressive strength-to-weight ratios. Therefore they have great potentials for use in
structural applications, such as reinforcement to hollow thin-walled structures, cores
for sandwich panels, and devices for absorbing impact energy. Reviews of the research
on the mechanical and physical properties of cellular materials are given by Gibson
and Ashby [17], Santosa [5], and Doyoyo and Wierzbicki [18].
Two typical cellular solid materials are aluminum foams and aluminum honeycombs.
Aluminum foams are made of a network of three-dimensional cells, while honeycombs
are composed of an array of parallel, prismatic cells. When subjected to a
compres-sive load greater than their maximum strength, deformation occurs by progrescompres-sive
crushing of individual cells through the thickness of the foams and honeycombs. This
deformation characteristics gives the materials the capacity to undergo very large
compressive strains. Typically, the compressive stress-strain curve of aluminum foam
shows an elastic regime, followed by a long plastic collapse plateau regime, truncated
by a regime of densification where the stress rises steeply. The elastic regime in foam
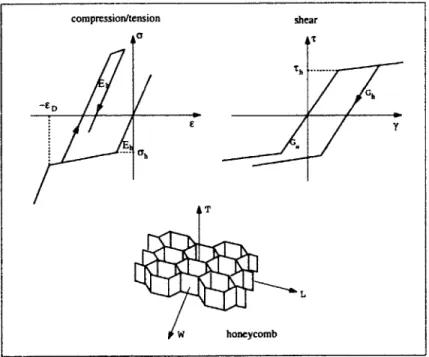
materials is a function of bending stiffness of cell walls and edges (Christensen [19]). The collapse regime is associated with the development of plastic hinges formed in these members, until cell walls begin to touch and the foam densifies (Thornton and Magee [20, 21]). Likewise, the compressive stress-strain curve of aluminum honey-comb shows three regimes: elastic, plastic and densification regimes. The elastic stage is associated with axial compression of cell walls in out-of-plane loading and bending of cell walls in in-plane-loading. Beyond a critical strain, the cells collapse by plas-tic buckling (McFarland [22] and Wierzbicki [23]), and plasplas-tic deformation continues until cell walls begin to touch. As the cells close up, the honeycomb densifies and the slope of the stress-strain curve increases rapidly.
The manufacturing process, the mechanical properties and plasticity models of alu-minum foams and honeycombs are summarized in the following.
2.2
Aluminum Foam
Metallic foams have been around since the 1950s. However, because of the high cost and unsatisfactory quality, no industrial applications were found for those early foams. Recent advances in cost-effective process for the production of high quality aluminum foam has cleared the way for using this material in many applications, such as reinforcement to thin-walled structures, cores for sandwich panels, and other energy absorption applications.
2.2.1
Production Process of Aluminum Foam
The techniques of manufacturing aluminum foam fall into three main categories, namely, melt route process, powder route process, and deposition techniques (Markaki [24] and Santosa [5]).
Melt Route Process
While the techniques in this category vary, they basically involve melting the metal
and introducing the gas either by direct injection or by foaming agent decomposing.
The Cymat, Hydro, and Mepura foams are produced by injecting and mixing gas into
a vat of molten aluminum alloy and ceramic particles (typically SiC or Al 03). The volume fraction of ceramic particles in the mix is between 0.05 and 0.15; the size of the particles is between 1pm to 20 pm (Prakash et al. [25]). The injected air causes bubbles to rise to the surface of the melt, form a liquid foam which is stabilized by the presence of the ceramic particles on the gas-liquid interface of the cell walls. The average size of the bubbles is between 3mm and 30mm and can be controlled by the gas injection rate. The stabilized liquid foam is mechanically conveyed off the surface of the melt and allowed to cool below the solidus temperature of the alloy. This method allows for the semi-continuous production of foam panels.The Alporas foam, on the other hand, is produced by adding 0.2 to 8 weight percent-age calcium and 1 to 3 weight percentpercent-age titanium hydride powder to molten alu-minum, which is then mixed with an impeller in a special casting chamber (Akiyama et al. [26]). The calcium acts to increase the viscosity of the melt, while the titanium hydride powder dissociates into titanium metal and gaseous hydrogen. The bubbles formed by the gaseous hydrogen cause the melt to expand into a liquid foam. During the expansion, the casting chamber maintains a constant chamber pressure, resulting in a homogeneous cell structure in the liquid foam. Once the foam expands to the desired volume, it is then cooled below the solidus temperature of the melt to form a solid foam casting. Foams with average cell size between 2mm and 10mm can be produced by this method.
Figure 2.1 shows the aluminum foam (Hydro) produced by the melt route process.
The advantage of the melt route techniques is that the manufacturing cost is relatively
low, while the disadvantage is that the size and distribution of the pores can only be
controlled to a limited extent.
Powder Route Process
Powder route techniques avoid the handling of molten metals by using a powdered mixture of a metal or alloy and a foaming agent. IFAM foam is produced by this technique. The foam agent is usually 0.4 to 0.8 weight percentage depending on the desired foam density. The powder blend is then compacted by extrusion to
be-come foamable semi-finished product in which the foaming agent is homogeneously
distributed within a dense, virtually non-porous metallic matrix. The semi-finished
product is then processed into pieces of the desired size and shape by rolling and
cutting. Upon heating the foamable material to temperature within the range of the
melting point, the foam agent releases gas in a controlled way, so that the metal
trans-forms into semi-solid, foamy mass which expands slowly into a highly porous cellular
solid with a closed-pore structure. The density of the metal foam is controlled by
adjusting the content of the foaming agent and varying the heating condition.
Figure 2.1 shows the aluminum foam (IFAM) produced by the powder route process.
Powder metallurgy allows greater control over foam macrostructure and can be used
to produce foams with complex shapes and inside hollow thin-walled structures.
How-ever, powder route techniques are inevitably more expensive than the melt route.
Deposition Techniques
Deposition techniques are based on the deposition of a metal onto a polymeric
sub-strate which is then removed by thermal decomposition. The foam produced by this
technique are with uniform cell structures, but the high cost limits their application.
(a) Hydro
(b) If am
Figure 2.1: Aluminum foam (a) Hydro (b) IFAM
2.2.2
Mechanical Behavior of Aluminum Foam
The mechanical properties of aluminum foam depend on both the cell structure of the foam and the properties of the base material. A typical compressive stress-strain curve of aluminum foam may be approximated by three regimes: linear elasticity at small strains, a long plateau stress region, and a final densification region where stress rises steeply, see Fig.2.2
densification plateau Of Et f elasticity EDE
Figure 2.2: Compressive stress-strain curve of aluminum foam
The mechanical properties of aluminum foam for various relative densities can be given as follows
Ef
=
ESQL),
2(2.1)
PS)Et = 0.02E
1(2.2)
Gf = Ef
(2.3)
Olf = 00f(5 ) 3/2(2.4)
1r7= 0.5of(&)
(2.5)
ED = 1 - l.4I (2.6) PSwhere E,, aol, p, are the Young's modulus, plastic flow stress, and mass density of the skeleton material of the foam, respectively. The plastic collapse stress 0f in Eq. (2.4)
was given among others by Santosa and Wierzbicki [27], while the expressions for Young's modulus Ef, shear modulus G1 and densification strain EDwere developed by Gibson and Ashby [17]. Based on experimental data, the plastic shear strength r1
is usually a fraction of the plastic collapse stress, r = (0.5 - 0.8)aj. The coefficient
was assumed to be 0.5 in Eq.(2.5) for simplicity. The expression for the tangent modulus Et describing the strain hardening of the foam at the plastic stress plateau was proposed by Santosa and Wierzbicki [27] and Hanssen [28].
The tensile stress-strain response of aluminum foam differs from a compressive one.
A typical tensile stress-strain curve is illustrated schematically in Fig.2.3. Unlike in
compressive loading where the material can undergo large macroscopic strains ( >
60%), the aluminum foam in tension tends to fail in a brittle fashion at a relatively
small strain (around 10%), and cracks start propagating after stress reaches a peak and until it ruptures.
E
Figure 2.3: Tensile stress-strain curve of aluminum foam
Harte et al. [29] found that the uniaxial tensile yield strength is approximately equal to the uniaxial compressive yield strength for some commercial foams. However, a recent experimental study carried out by Doyoyo and Wierzbicki [30] showed that for anisotropic foams the tensile strength is about one-third of the compressive strength for the aluminum foam they tested. Sugimura et al. [31] reported that certain metal foams exhibit a higher yield point in tension than in compression. The wide scattering results suggest that more studies are needed to achieve a clear picture.
Many investigators have focused on the development of physical models of failure of
cellular solids under multi-axial stresses. A few of such models are described below.
Gibson et al. [32J used an analysis of an idealized cubic unit cell to develop a yield
surface of the form
L
+
0.
81(g)(1m)2
=
1
(2.7)
Orf P.9af
where a, is the magnitude of the uniaxial compressive collapse stress; p1/p, is the
relative density of the foam compared to the solid aluminum; a, and cm are the Von Mises effective stress and mean stress defined in terms of the stress tensor asI
am
=-1(2.8)
3
C = rses =
(2.9)
Sjj = Oij - Om ij (2.10)
In the principal stress space
(O1, 02, 03),the above yield surface is an ellipsoid sitting
on the hydrostatic axis, see Fig.2.4(c). In biaxial loading, the yield surface is a skewed ellipse, see Fig.2.5(dotted line). This model, however, does not account for the difference in tensile and compressive strengths of foams which is a characteristic of compressible materials.
The well-known Drucker-Prager yield criterion [33] has also been used for porous materials such as soils
f
= a,+
vam - d (2.11)where v and d are constants which can be determined by uniaxial tensile and com-pressive tests. The Drucker-Prager yield surface is a cone sitting on the hydrostatic axis in the principal stress space, see Fig.2.4(b).
Miller [34] improved the Gibson's model by incorporating the Drucker-Prager model to account for the unequal tensile and compressive strengths in metal foams. Three adjustable parameters were introduced in his model to fit the yield surface to the experimental data. The yield surface takes the form
f = Oe + vam + a2
- d
(2.12)
where v, a and d are material parameters to be determined from experimental data of uniaxial tensile and compressive yield strength, and the plastic Poisson's ratio.
Deshpande and Fleck [35] suggested a self-similar yield model based on axisymmetric loading tests on isotropic foams. The yielding would occur when the equivalent stress & attains the yield value Y (uniaxial yield strength in tension and compression)
4P
- Y < 0
(2.13)
where the stress function & is defined by
(2
1
2 + #202)(2.14)
1+ (1-)2
This criterion produces a yield surface of elliptical shape in (om, ce) space, with an aspect ratio determined by the parameter #. The value of 0 can be established by measuring the plastic Poisson's ratio vP
05-v=13(.-
v)
2(2.15)1
+
pPIn the principal stress space, this yield surface is of ellipsoid shape similar to those described above (Fig.2.4(c). With '32 = 4.5, i.e., the plastic Poisson's ratio VP = 0 (which is close to the case of aluminum foam), the yield surface in the biaxial loading condition is a circle with radius being the value of a,, see Fig.2.5(dashed line).
0Y3 (c) (b) 0Y2 03 (d)
Figure 2.4: Yield surfaces.
Drucker-Prager model (d)
(a)Von Mises model (b)Drucker-Prager model (c)Modified
Maximum principal stress criterion
a
C2