Any correspondence concerning this service should be sent to the repository administrator: [email protected]
This is an author-deposited version published in: http://oatao.univ-toulouse.fr/ Eprints ID: 11032
To cite this version:
Dueñas Velasco, Mauricio and Duru, Paul and Marcoux, Manuel and Prat, Marc
Efflorescence fairy ring and salt centripetal colonization at the surface of a
drying porous medium containing a salt solution. Impact on drying curve.
(2013) In: 4th European Drying Conference (EuroDrying'2013), 02 October
2013 - 04 October 2013 (Paris, France).
O
pen
A
rchive
T
oulouse
A
rchive
O
uverte (
OATAO
)
OATAO is an open access repository that collects the work of Toulouse researchers and makes it freely available over the web where possible.
Eurodrying'2013, Paris, 2-4 October
medium containing a salt solution. Impact on
drying curve.
M. Dueñas Velasco
*,1, P. Duru
1, M. Marcoux
1and M. Prat
1,2 1INPT, UPS, IMFT (Institut de Mécanique des Fluides de Toulouse), Université de Toulouse, Allée Camille Soula, F-31400 TOULOUSE, France
2
CNRS, IMFT, F-31400 TOULOUSE, France
* Author to whom all correspondence should be addressed: electronic mail:
ABSTRACT. We study experimentally the drying of sintered glass porous pellets initially saturated with a sodium chloride solution. The objective is to develop a better understanding of the interplay between evaporation, ions transport and crystallization. The focus is on the characterization of the drying kinetic and its dependence on the development of salt crystals at the porous media surface. Together with analysis of the drying curves in relation with direct visualizations of the sample surface, quantitative pieces of information on the efflorescence growth and structure are obtained from X-ray computed tomography imaging. The study shows that markedly different results are obtained depending on the mean pore size of pellet. This is explained by the completely different efflorescence structure resulting from the drying process. A very thin salt crust is obtained for sufficiently small pores whereas cauliflower like efflorescence structures are obtained for sufficiently large pores. The salt crust tends to severely reduce the evaporation rate whereas the cauliflower like efflorescence does not affect the evaporation rate compared to pure water drying as long as the efflorescence is wet. In the case of the cauliflower type, the X-ray computed tomography images indicate a greater efflorescence growth at the periphery of the porous medium surface. The analysis of the data also suggests that the mean pore size in the efflorescence is significantly smaller than in the underlying porous medium.
2 AFSIA / EFCE WP Drying
1
Introduction
Evaporation of a salt solution in porous media is of interest in relation with important applications such as the injection of CO2 in saline aquifer or the preservation of our cultural heritage because of the possible structural damages that can be induced by the salt crystallization process, e.g. (Eloukabi et al. 2013) or (Hidri et al. 2013) and references therein. Despite the importance of applications, the interplay between evaporation, salt transport and crystallization is still not well understood. A very short review of current state of the art can be proposed as follows focusing on sodium chloride aqueous solution only. The salt crystals can form inside the porous medium and / or at the evaporative surface of porous medium. The salt structures forming at the surface are referred to as efflorescence. In this paper, we study a situation characterized by efflorescence formation without subflorescence (subflorescence refers to salt crystal structures forming inside a porous medium). The ion transport in a drying porous medium is governed by a transient convection diffusion equation, e.g. (Huinink et al. 2002), (Sghaier et al. 2007). The evaporation induces a flow in the liquid phase directed toward the evaporative surface (top surface of sample in the experiment described in the present paper) during the CRP (constant rate period). As the result of this flow, the ions accumulate at the surface due to advection effect. Because of the advection effect, the ion concentration distribution is characterized by a concentration peak at the surface where crystals start forming when this concentration is sufficiently high. This explains why efflorescence is observed in a typical laboratory drying experiment. As reported in (Eloukabi et al. 2013), the efflorescence can either form a crust blocking or severely limiting the evaporation or salt towers (also called cauliflowers) not affecting or even increasing the evaporation rate (compared to pure water). The factors controlling the type of efflorescence, i.e. blocking or non-blocking, are under study. As reported in (Eloukabi et al. 2013), small pores favor the formation of blocking crust whereas large pores are likely to lead to non-blocking salt towers. Similarly, crust formation is expected with sufficiently high initial evaporation rates, i.e. at the beginning of drying, whereas non-blocking salt towers are expected for sufficiently low evaporation rates. As reported in (Sghaier et al. 2009), efflorescence is a porous medium. As a result the efflorescence can pump the solution up to its external surface owing to capillary effects. This aspect is important to understand the growth of efflorescence, e.g. (Veran-Tissoires et al. 2012a, 2012b). An important issue in the field is to better understand the transition from non-blocking to blocking efflorescence. A tempting possibility is to rely on X-ray tomography so as to characterize the efflorescence distribution at the surface in more depth as well as perhaps its internal microstructure. In this context, the present paper confirms the results regarding the influence of porous medium pore size on efflorescence type, i.e. blocking or non-blocking, and presents first results obtained using X-ray tomography technique.
2
Materials and Methods
2.1 Model porous media used in the present study
The porous media used for the experiments are pellets of sintered glass manufactured by
ROBU®, made of borosilicate and quartz glass. Each pellet is 10,0 mm +/- 0,2 mm long
and has a diameter of 10,0 mm +/- 0,25 mm (see Fig. 1 for dimensions). Two different kinds of pellets were used, the characteristics of which are shown in Table 1. The porosity of each sample was measured and found to be 29 % for the ROBU class 0 pellet and 59
% for the ROBU class 5 pellet, a bit different from the mean values given by the manufacturer (see Table 1).
Table 1. Porosity classifications for the Vitra POR® Filter used. Source: http://www.robuglas.com/.
Class Poresize (µm) Pore Volume Permeability (mDarcy)
0 160 – 250 33% 124711,00
5 1,0 – 1,6 48% 152,60
Before each drying experiment, ORAPI® dry graphite lubricant was sprayed on the pellet
surface, allowing to get a better color contrast between the porous medium and the salt efflorescence that forms at its surface. It was checked that such a surface treatment does not modify the properties of the porous pellets.
Fig. 1. ROBU® pellet dimensions with dry graphite lubricant deposit at the surface.
2.2 Experimental protocol and setup
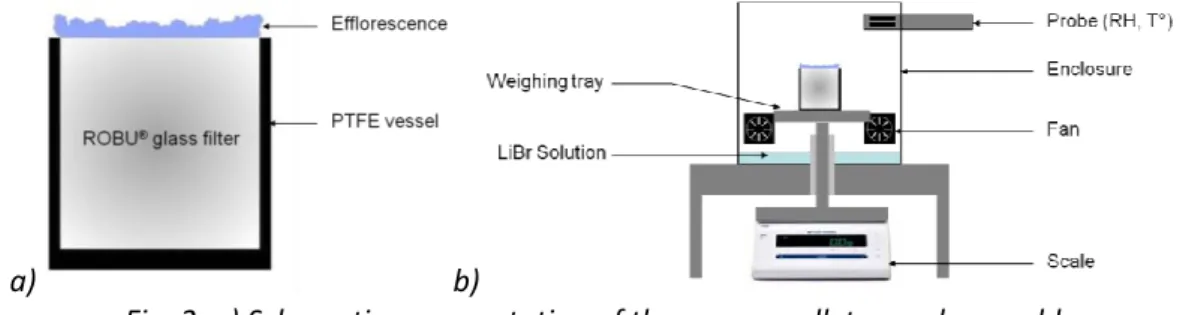
To perform a drying experiment, the ROBU pellet is first saturated with pure, filtered water or with a salt solution. The salt solution used is obtained by dissolving 25g of NaCl in 75 g of water (the saturation concentration in water for NaCl is about 26,4g per 100g of solution). The saturated sample is then placed in a cylindrical PTFE vessel, so that evaporation can occur only at the pellet top surface (see Fig. 2a). The vessel is finally put inside an enclosure (Fig. 2b) where a lithium bromide solution ensures a constant relative humidity (about 6%). Because of the high initial salt concentration, crystallization occurs relatively “fast”, i.e. within a few hours after the start of the drying experiment.
a) b)
Fig. 2. a) Schematic representation of the porous pellet-vessel assembly. b) Experimental setup (adapted from (Veran-Tissoires 2011)).
2.3 Experimental measurements
The sample is weighted by a MS603S Mettler-Toledo® precision scale during the
experiment, which provides a measurement of the evaporation rate. The temperature and
Dry graphite lubricant
d = 10,0 +/- 0,25 mm L = 10,0 +/-
4 AFSIA / EFCE WP Drying
humidity are monitored by a probe held in the enclosure and are typically found to be
constant during a given experiment. A D100 Nikon® camera takes photos of the sample
top each 5 minutes. All the aforementioned devices are controlled via a portable computer. In order to get pieces of information about the salt efflorescence forming at the pellet surface, X-ray tomography 3D images were acquired with a SkyScan1174 compact micro-CT, with a 50kV and 800µA X-ray source. The scan is performed at the end of the drying experiment, with a 10µm voxel size.
3
Results and discussion
3.1 Influence of efflorescence on evaporation rate
Figures 3a to 3d (4a to 4d respectively), display four successive top views of the ROBU pellets class 0 (class 5 respectively) obtained with the digital camera. For each of the two kinds of ROBU pellets, reference drying kinetics were obtained using pure water. The pure water kinetics correspond to the solid curves in Figures 3e and 4e. As can be seen these drying kinetics are characterized by a long CRP (constant rate period) during which most of water initially present in the sample evaporates. The FRP (falling rate period) and RFP (receding front period) are short.
e)
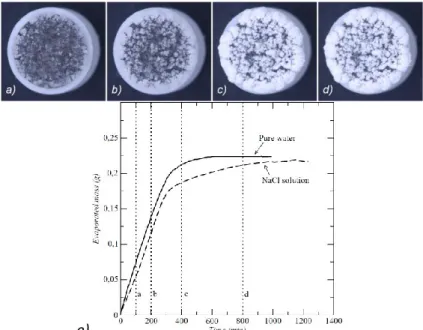
Fig. 3. a) to d) Top photographs of a ROBU class 0 pellet initially saturated with the NaCl solution, at increasing evaporation times: 100, 200, 400 and 800 min; e) Evaporated mass as a function of time for a ROBU class 0 pellet initially saturated with water (solid
line)) or a NaCl solution (dashed line), the times corresponding to images a) to d) are indicated by the vertical dotted lines.
When the sample is initially saturated with the NaCl solution, the drying curve is either very close to the curve for pure water (Fig.3e for the coarser pellet) or completely different (Fig. 4e for the fine pores pellet). For the coarser porous pellet (ROBU class 0, see Fig. 3), the drying rate is similar to the one found for pure water over a long period, about as long as the CRP for pure water. A clear evaporation rate decline starts after 300 min. The evaporation rate then further decreases, and ultimately vanishes at about t
=1000 min. At that stage, all the water initially present in the sample has evaporated. As can be seen the RFP is longer with the salt solution compared to drying with pure water. A careful examination of the recorded images reveals that the beginning of decline in the evaporation rate is correlated with a change in brightness of the top of the efflorescence (this can be seen comparing Figures 3b and 3c). This change is interpreted as the drying of the efflorescence. In fact a wet efflorescence appears as grey whereas a dry efflorescence is much whiter. The change from wet to dry efflorescence can be captured on the images by image processing. After binarization with a carefully chosen threshold, wet efflorescence can be set to black and dry one to white. Figure 5 shows the evolution versus time of the sample surface area covered by dry efflorescence, which is clearly correlated with the evaporation rate evolution (dashed line in Figure 3e). The efflorescence drying takes place between t = 200 and t = 400 min, which corresponds to the time interval during which the evaporative rate decreases (see Figure 3e). The situation depicted in Fig.3e thus corresponds to a non-blocking efflorescence since the drying curve is similar to the one for pure water and all the water initially present eventually evaporates.
e)
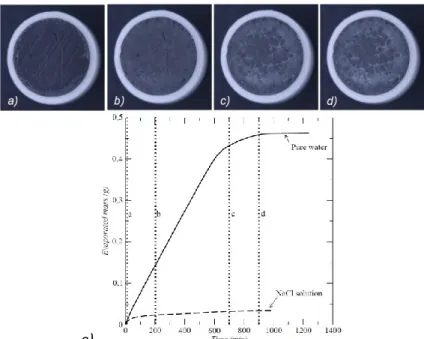
Fig. 4. a) to d) Top photographs of a ROBU class 5 pellet initially saturated with a NaCl solution, at increasing evaporation times: 10, 200, 700 and 900 min. e) Evaporated mass
as a function of time for a ROBU class 5 pellet initially saturated with pure water (solid line)) or a NaCl solution (dashed line), the times corresponding to the images a) to d) are
indicated by the vertical dotted lines
The longer receding front period (RFP) observed with the sodium chloride solution in Fig.3e is attributed to the additional barrier to diffusion due to the dry efflorescence. It is certainly possible to estimate the apparent effective diffusion coefficient of the dry efflorescence from the data reported in Fig.3e. This is left, however, for a future more detailed exploitation of the experimental results.
As mentioned before and depicted in Fig.4, the situation is completely different for the ROBU class 5 pellet. A very short (< 30min) CRP is detected. Then, the evaporation rate decreases but contrarily to the case of ROBU class 0 pellet, never strictly falls to zero,
6 AFSIA / EFCE WP Drying
even after a very long time (see Figure 4e). At t = 1000min, only 7%, of the water mass initially present in the sample has evaporated. The recorded images reveal that a kind of “veil” quickly covers the whole sample surface (compare Figure 4a and 4b), and we believe that this is causing the flux decline. Then, some tiny salt patterns appear on top of the veil, starting from the periphery of the sample, proving that salt ion keeps on accumulating at the surface and thus can be transported through the veil. The veil can be seen as a very thin crust. The drying kinetics strongly resembles the drying kinetics reported in (Eloukabi et al. 2013) for the blocking efflorescence, i.e. when efflorescence forms a crust.
Fig. 5. Ratio between the number of pixels on the sample surface image corresponding to a dry efflorescence and the total number of pixel as a function of time. The times at which the images 3a to 3d (Fig.3) are taken are indicated by the vertical green lines (100,
200, 400 and 800 min)
3.2 Evaporation from crust
The ratio between the evaporation rate during the very short CRP at the beginning of the experiment and the very low evaporation rate observed for t > 200 min in Fig.4e for the sodium chloride solution is about 36. One option to explain this very significant and intriguing reduction is to assume that only 1/36 ≈ 3% of the porous medium is free of efflorescence when t > 200 min. However, the observation of the top images of sample suggests that the crystal veil covers the entirety of the surface. Thus the most likely option is that evaporation takes place from the external surface of the veil. Simple computation using Kelvin’s relationship and the classical approximation that a porous surface behaves as a fictitious continuum surface, e.g. (Suzuki and Maeda 1968), leads to the conclusion that the pore at the surface of the veil should be less than one nanometer! A more plausible assumption is that the pores at the veil surface are larger but sufficiently far apart from each other for the evaporation rate to be reduced by the factor 36. Computation (not detailed here) shows that this is possible for example with pores about 100 nanometers in diameter and a mean distance between pores on the order of 1 mm. This suggests that the veil can be regarded as a set of impervious surfaces (tiles) with only a few open pores at the boundaries between the tiles (= the mortar between the tiles). This picture is supported by the “tiny salt patterns” evoked in section 3.1 and will be explored in more depth in a future work.
3.3 Peripheral effect on pellets of sintered glass
A striking feature of the drying process is that the efflorescence first forms at the periphery of the evaporative surface and then colonizes the surface from the periphery to
the center. This aspect is discussed in some details in (Veran-Tissoires et al., 2012a) and (Hidri et al., 2013). The main reason is due to the fact that the evaporation flux is not uniform over the surface but greater at the periphery, somewhat similarly as in the classical coffee ring problem (evaporation from a droplet lying on a surface). The greater flux at the periphery induces a greater velocity in the liquid inside the porous medium at the periphery. The greater velocity induces in turn a faster accumulation of ions at the periphery.
3.4 X-ray tomography of efflorescence
a)
b)
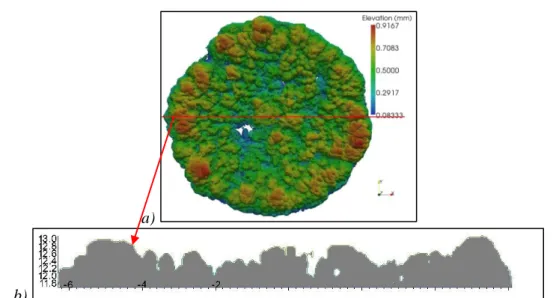
Fig. 6. a) Efflorescence surface topography, for the ROBU class 0 pellet at the end of experiment. b). Topography along a slice of the sample (red line in a); the figures along
the z axis are in millimeters
A striking feature of the efflorescence shown in Fig.3 on top of the ROBU class 0 pellet is that the preferential accumulation of salt at the periphery continues much longer after the occurrence of first crystals (only the onset of crystallization was considered in (Veran-Tissoires et al., 2012a) and (Hidri et al., 2013)). This is visible in Fig.3b-d. The efflorescence is characterized by a ring of “cauliflowers” whereas the rest of the surface is covered by smaller salt structures. This is confirmed by the X-ray tomography image of the efflorescence obtained at the end of the drying experiment. As reported in Fig.6, efflorescence larger thicknesses are measured on the periphery of the porous pellet. It worth noticing that the efflorescence internal structure appears as a homogeneous medium on tomographic transversal slices (i.e. with roughly constant voxel grey levels), revealing that a 10µm voxel size is not enough to spatially resolve the porous microstructure of efflorescence. Thus the pores in efflorescence should be smaller than 10µm, thus at least 20 times smaller than in the porous pellet (class 0). Fig.6a also indicates that the efflorescence thickness is on the order of 1mm and that a fraction of the surface is probably not covered by the salt structures (surfaces in blue in Fig.6a). This is consistent with other experiments, e.g. (Eloukabi at al .2013), showing that the non-blocking efflorescence do not cover entirely the porous medium surface. This is in contrast with the (blocking) crust type of efflorescence, which entirely covers the surface as discussed in §3.2 and 3.3.
8 AFSIA / EFCE WP Drying
4
Conclusions
In this paper, we presented results on drying of porous pellets initially saturated with a sodium chloride solution. It was found that efflorescence progressively grows on the sample surface, first appearing at the sample surface periphery and then colonizing the full surface. The drying kinetic is modified by the efflorescence development, compared to the situation with pure water. As shown in this paper, the mean pore size of the porous medium has a great impact on the efflorescence structure. A sort of very thin salt crust / veil is obtained with the tiniest pores tested (pores on the order of 1.3 μm) whereas a cauliflower like efflorescence is obtained at the surface of the medium with larger pores (pores on the order of 200 μm). The efflorescence of the crust type rapidly leads to a severe decrease of the evaporation rate compared to drying with pure water. The efflorescence of the cauliflower type leads to an evaporation rate comparable to the one for pure water over a long constant rate period, followed by a receding front period longer than for pure water drying owing to the additional resistance to water vapour diffusion due to the efflorescence. There is now no doubt that the efflorescence is an evolving porous medium. Consequently, a better understanding of the interplay between evaporation, ions transport and crystallization requires the characterization of efflorescence as a porous structure. Our plan is now to study the porous nature of the efflorescence forming in the experiments using high spatial resolution X-ray tomography (voxel size ≈ 1 µm). The present study suggests that such a resolution could be sufficient to study the pore network in the cauliflower efflorescence but perhaps not in the crusty efflorescence, which would require still better resolution.
5
References
Eloukabi, H., Sghaier, N., Ben Nasrallah, S., Prat, M., 2013 – Experimental study of the effect of sodium chloride on drying of porous media: the crusty-patchy efflorescence transition, Int. J. of Heat and Mass Tr. 56, 80–93.
Hidri F., Sghaier N., Eloukabi H., Prat M., Ben Nasrallah S. 2013 – Porous medium coffee ring effect and other factors affecting the first crystallization time of sodium chloride at the surface of a drying porous medium, to appear in Phys. of Fluids
Huinink, H.P., Pel, L., Michels, M.A.J., 2002 – How ions distribute in a drying porous medium: A simple model. Physics of fluids 14 (4), 1389-1395.
Sghaier, N.,Prat, M., Ben Nasrallah, S., 2007 – On ions transport during drying in a porous medium. Transport in Porous Media, 62, 243-274.
Sghaier, N.,Prat, M., 2009 – Effect of efflorescence formation on drying kinetics of porous media. Transport in Porous Media 80 (3), 441-454.
Suzuki M. Maeda S., 1968 – On the mechanism of drying of granular beds, J. of Chem. Eng. of Japan, 1 (1),26-31
Veran-Tissoires S., 2011– Sur le phénomène de cristallisation discrète à la surface ou à l'intérieur d'un milieu, PhD Thesis at Université de Toulouse.
Veran-Tissoires S., Marcoux M., Prat M., 2012a – Discrete salt crystallization at the surface of a porous medium, Phys. Rev. Letters 108:054502
Veran-Tissoires, S., Marcoux, M., Prat, M., 2012b – Salt crystallization at the surface of a heterogeneous porous medium, Europhysics. Letters 98, 34005.