HAL Id: hal-02455958
https://hal.uca.fr/hal-02455958
Submitted on 16 Nov 2020
HAL is a multi-disciplinary open access archive for the deposit and dissemination of sci-entific research documents, whether they are pub-lished or not. The documents may come from teaching and research institutions in France or abroad, or from public or private research centers.
L’archive ouverte pluridisciplinaire HAL, est destinée au dépôt et à la diffusion de documents scientifiques de niveau recherche, publiés ou non, émanant des établissements d’enseignement et de recherche français ou étrangers, des laboratoires publics ou privés.
Electrical conductivity of hydrous silicate melts:
Implications for the bottom-up hydration of Earth’s
upper mantle
D. Freitas, Geeth Manthilake
To cite this version:
D. Freitas, Geeth Manthilake. Electrical conductivity of hydrous silicate melts: Implications for the bottom-up hydration of Earth’s upper mantle. Earth and Planetary Science Letters, Elsevier, 2019, 523, pp.115712. �10.1016/j.epsl.2019.115712�. �hal-02455958�
Electrical conductivity of hydrous silicate melts: Implications for the bottom-up hydration of 1
Earth’s upper mantle 2
D.Freitas1*, G. Manthilake1 3
1Université Clermont Auvergne, CNRS, IRD, OPGC, Laboratoire Magmas et Volcans,
4
F-63000 Clermont-Ferrand, France 5
(*corresponding author:damien.freitas@uca.fr) 6
7
Abstract: 8
The upwelling of the hydrous mantle transition zone triggers dehydration-induced 9
partial melting atop the 410-km discontinuity. Here we investigate the electrical conductivity 10
of hydrous silicate melts in the 200-400 km depth range and explore whether melting at the 11
410-km depths is responsible for the hydration of the upper mantle. Our experimental 12
electrical conductivity data demonstrate that the mantle at 180-350 km depths is mostly melt 13
free, confirming the H2O under-saturated conditions. However, the residual mantle from
14
partial melting atop the 410km discontinuity may contain various possible amounts of water 15
according to the initial mantle transition zone and melt concentrations. This residual H2O
16
could contribute to the hydration of the upper mantle either through diffusion or material 17
replacement by upwelling. Our calculations suggest that the diffusion may not be responsible 18
for the hydration of the upper mantle to present H2O concentration of 50–200 ppm wt.
19
Melting of the upwelling mantle transition zone with less than 1500 ppm wt. H2O produces
20
residual peridotites with ~ 200 ppm H2O at the 410-km discontinuity. Continuous upwelling
21
of such hydrous residues would gradually replace the dry upper mantle with depleted residual 22
hydrous peridotites in less than 260 Ma. In this study, we propose a bottom-up hydration 23
mechanism for the Earth’s upper mantle driven by dehydration-melting at the 410-km 24
discontinuity. The hydrous partial melting at the top of the asthenosphere appears to be a 25
consequence of H2O saturation in the upwelling residual peridotites.
26
27
Keywords: electrical conductivity, water storage capacity, hydrous melt, upper mantle, 28
mantle upwelling, mantle transition zone 29
30
1. Introduction: 31
The average H2O content of the Earth’s upper mantle is determined to be about
50-32
200 ppm wt. (Hirschmann, 2006; Michael, 1988; Saal et al., 2002; Simons et al., 2002). 33
These estimates are significantly lower than the H2O storage capacity of peridotite mineral
34
assemblages (Ardia et al., 2012; Demouchy and Casanova, 2016; Férot and Bolfan-35
Casanova, 2012), indicating water undersaturated conditions for the Earth’s upper mantle. 36
The origin of H2O in the upper mantle is still a subject of debate. However, two possible
37
scenarios have been proposed. In the first hypothesis, the H2O in the upper mantle has been
38
attributed to hydrous residues left behind following partial melting in the upper mantle. In the 39
second scenario, H2O in the upper mantle can be derived from the mixing of dry upper
40
mantle with a hydrous primitive source (Hirschmann, 2006). 41
At present, three distinct partial melting regimes, that could explain the origin of H2O
42
in the upper mantle have been proposed; dehydration melting at the 410-km discontinuity 43
(Bercovici and Karato, 2003), melting in mantle wedges (Hirth and Kohlstedt, 1995) and 44
partial melting of mantle plumes (Morgan and Morgan, 1999), all arguing that the residues 45
left behind by the melting events could be responsible for H2O contents in the upper mantle.
46
While the depleted signature of mid oceanic ridge basalt (MORB)-source upper mantle 47
strongly favors the partial melting hypotheses, the exact nature of the melting regime that led 48
to the hydration of the upper mantle, consistent with geochemical, geophysical and 49
geodynamic observations, remains poorly constrained (Hirschmann, 2006). 50
A recent study based on in situ sound velocity measurements confirmed the 51
dehydration induced melting in the upwelling mantle across the 410-km discontinuity 52
(Freitas et al., 2017). Geophysical observations of high electrical conductivity (up to 1 S/m) 53
(Toffelmier and Tyburczy, 2007) and reduced seismic wave velocities (δVs 4-9%) 54
(Revenaugh and Sipkin, 1994; Tauzin et al., 2010) suggest a 50-60 km thick melt layer above 55
the Mantle Transition Zone (MTZ) (Revenaugh and Sipkin, 1994; Song et al., 2004; Tauzin 56
et al., 2013, 2010; Vinnik and Farra, 2007). The upwelling of hydrous MTZ with ~ 0.1-0.2 57
wt.% of H2O (Freitas et al., 2017; Huang et al., 2005; Karato, 2011) and the significant
58
differences in H2O storage capacities between the MTZ (Bolfan-Casanova et al., 2000;
59
Hirschmann et al., 2005; Kohlstedt et al., 1996) and the overlying mantle (Demouchy and 60
Bolfan-Casanova, 2016; Férot and Bolfan-Casanova, 2012) is the governing factor that 61
triggers melting in the upwelling mantle across the MTZ (Bercovici and Karato, 2003; Freitas 62
et al., 2017). The reported 3.6-9.4 % shear wave velocity drop is compatible with a 0.5-2.5 % 63
melt fraction (Freitas et al., 2017) in the partial melt layer. 64
The melt produced at the 410-km discontinuity is found to have high H2O contents
65
(Freitas et al., 2017; Matsukage et al., 2005). The mineral-melt equilibrium following melting 66
at the top of the MTZ causes H2O to diffuse from the hydrous melt into solid mineral phases
67
both above and below the melt layer. The H2O diffusion may occur between melt and
68
wadsleyite, transferring H2O back into the underlying MTZ and between
melt-69
olivine/pyroxene/garnet, hydrating the overlying mantle. In addition to the diffusion process, 70
the mantle upwells passively away from subduction zones in response to intrusion of slab 71
material into Earth’s interior (Bercovici and Karato, 2003; Karato et al., 2006). The mantle 72
upwelling is significantly faster than H2O diffusion into mantle minerals (Bercovici and
Karato, 2003), replacing the dry upper mantle with residual peridotites. The dehydration 74
melting in the upwelling mantle and subsequent H2O transport mechanisms therefore play a
75
crucial role in water transfer between the upper mantle and the mantle transition zone 76
(Bercovici and Karato, 2003). 77
Laboratory measurements of electrical conductivity have been extremely useful in 78
characterizing the material circulation in the Earth’s mantle (Dai and Karato, 2009, Yoshino, 79
2010). The laboratory measurements suggest electrical conductivity is a powerful tool for 80
detecting melt or fluid and their occurrence within the solid mineral matrix at deep mantle 81
conditions (Freitas et al., 2019; Grotenhuis et al., 2005; Manthilake et al., 2016, 2015; 82
Maumus et al., 2005). It is also sensitive to the chemical composition of melt, particularly to 83
volatiles (Gaillard et al., 2008; Karato, 1990; Manthilake et al., 2009; Yoshino, 2010) and 84
alkalis (Ni et al., 2011). In this study, we measure the electrical conductivity of hydrous 85
peridotite at various pressures up to 12 GPa above their melting temperatures. The results 86
were compared with magnetotelluric profiles to gain insight into the extent of melting and 87
melt percolation if hydrous conditions are assumed for the Earth’s upper mantle. Based on 88
our results, we discuss different scenarios that could be responsible for the H2O circulation in
89
the upper mantle. 90
91
2. Materials and Methods 92
2.1 Starting materials
93
Starting materials with a composition similar to KLB-1 peridotite (Wang and 94
Takahashi, 2000) were prepared using reagent grade oxides, initially mixed in the absence of 95
the required amount of Al(OH)3 to yield the correct mineral composition (ranging from 1.63
96
to 4.86 mg to obtain 500 mg of peridotite powder with 400 to 1500 ppm H2O, respectively).
97
These powders were dried at 300 °C overnight to remove any adsorbed moisture. Na and K 98
were added as NaCO3 and K2CO3 and then de-carbonated. The decarbonation of the oxide
99
mixtures was carried out by slowly increasing the temperature to 1000°C (1.6°C/min) and 100
keeping it at 1000°C for about 10 hours to ensure complete decarbonation. The decarbonated 101
powder mixture was then cooled to 200°C and stored in a high vacuum furnace at 120°C 102
prior to the hot pressing runs. The required amount of Al(OH)3 was then mixed with the
103
decarbonated powder mixture to obtain the desired amount of H2O in peridotite samples.
104
Samples with ~0, 500, 700 and 1200 ppm wt. H2O as initial content in powders were
105
prepared in order to have hydrous under saturated conditions at the different targeted 106
pressures. As water solubility increases with pressure in nominally hydrous phases (Ardia et 107
al., 2012; Férot and Bolfan-Casanova, 2012), we always used initial water content under 108
solubility limit at each pressure. However, due to the absorbed moisture in the high pressure 109
synthesis assembly, the water content may be subjected to some possible water (H) diffusion 110
into the samples even with sealed capsules. The X-Rays powder diffraction analyses using a 111
Philips PW 1830 (Cobalt wave-length) and micro-Raman analyses were carried out prior to 112
the electrical conductivity measurements to ensure the absence of additional hydrous phases 113
such as super hydrous Phase-B and partial melts in pre-sintered samples. 114
115
2.2 Experimental
116
The resulting powder mixtures were hot pressed to obtain solid sintered samples for 117
electrical conductivity measurements. Hydrous and dry samples were synthesized at different 118
pressures and temperature conditions in a first high pressure run with multi-anvil apparatus, 119
these samples were recovered for in situ measurements that were performed in a second 120
multi-anvil run. The details on samples conditions (pressure, temperature and time at 121
temperature) are given in the table S1. Dry samples were synthesized at target or lower 122
pressures to ensure low water solubility of the material (Ferot and Bolfan 2012, Kohlstedt et 123
al. 1996). Hydrous samples were synthesized at target pressure (for 6 and 9 GPa) and 14 GPa. 124
The synthesis of hydrous samples at 14 GPa performing in situ experiments at 12 GPa allows 125
us to simulate the dehydration induced melting at the 410-km discontinuity (Freitas et al. 126
2017). 127
Dry samples and hydrous samples were synthetized for ~2 hours in Gold-Palladium 128
(Au-Pd) capsules and temperatures between 1373 and 1573 K (table S1). These under 129
saturated conditions are required during the synthesis process, in order to avoid hydrous 130
silicate melts along grain boundaries, which could otherwise interfere with the electrical 131
conductivity. Cylindrical core samples ~1.0 mm in length and ~1.2 mm in diameter were 132
prepared from these pre-synthesized sample specimens. 133
The high-pressure and high-temperature experiments were performed using a 1500-134
ton Kawai-type multi-anvil apparatus at the Laboratoire Magmas et Volcans, Clermont-135
Ferrand, France. Both sample synthesis and the in situ measurements were performed in 136
multi-anvil apparatus using an octahedral pressure medium composed of MgO and Cr2O3 in a
137
14/8 multi-anvil configuration (octahedron edge length / anvil truncation edge length) for 138
experiments at 12 GPa and 18/11 for experiments at 6 and 9 GPa (Supplementary Figure S1). 139
The pre-synthesized cylindrical sample was inserted into a MgO sleeve. The sleeve also helps 140
insulate the sample electrically from the furnace. This furnace, composed of a 25 μm thick 141
cylindrical Re foil, has apertures for the electrode and the thermocouple wires. A zirconia 142
sleeve around the furnace was used as a thermal insulator. Thermal gradient was also taken in 143
to account for the design of these experiments (Hernlund et al., 2006), and were estimated to 144
be negligible <5° with our sample dimensions (Supplementary Figure S2). We placed two 145
electrodes, made of Mo discs, at the top and bottom of the cylindrical sample. A tungsten-146
rhenium (W95Re5-W74Re26) thermocouple junction was placed at one end of the sample to
147
monitor the temperature. The opposite end was connected to a single W95Re5 wire. We
collected impedance spectra between the two W95Re5 wires. All ceramic parts of the cell
149
assembly, including the pressure medium, were fired at 1373 K prior to their assemblage in 150
order to remove any adsorbed moisture, and kept in vacuum furnaces (10-2 Torr and 150°C) 151
before assembling the experiment. Oxygen fugacity of the sample was not controlled during 152
in situ measurements, but was expected to remain below the Mo-Mo2 buffer.
153
EC measurements were performed using the ModuLab MTS Impedance/Gain-phase 154
analyzer in the frequency range of 101-106 Hz. Polyphasic samples are characterized by a 155
combination of resistor-capacitor/constant phase element (R-C/CPE) circuits and the 156
resistance can be obtained by fitting the impedance spectra to appropriate equivalent circuits 157
(Supplementary Figure S3). Once the sample resistance has been determined, conductivity 158
can be calculated using the sample diameter and length. The experimental procedure for 159
electrical conductivity measurements is discussed elsewhere (Manthilake et al., 2016, 2015). 160
Importance of a moisture removal procedure is crucial in these experiments and is detailed in 161
Supplementary Figure S3. 162
163
2.3 Chemical and micro-textural analyses
164
The chemical composition and micro-textures of pre-sintered samples and 165
experimental run products after electrical conductivity measurements were investigated using 166
a Cameca SX100 electron probe micro analyzer and a Scanning Electron Microscope (SEM) 167
JEOL Jeol JSM-5910 LV, respectively, at the Laboratoire Magmas et Volcans of Clermont-168
Ferrand. Energy-dispersive X-ray spectroscopy (EDS) chemical mapping was used to 169
determine the mineral proportions and chemical compositions by selecting a large area of 170
each phase. The fine melt micro-textures were observed using a ZEISS supra 55VP field 171
emission gun (FEG) SEM at 2MATech, Aubière, France. Major element compositions of 172
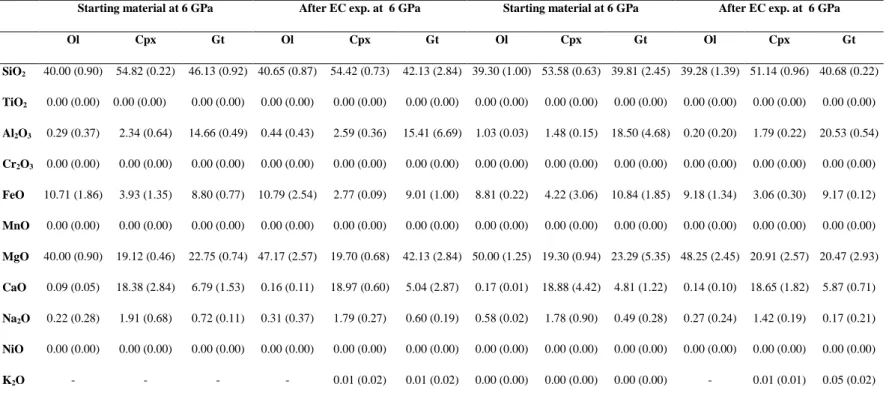
solid phases are given in Supplementary Tables S2 and S3. 173
The presence of water (OH) in the crystalline phases of our peridotite samples was 174
qualitatively analyzed both before and after electrical conductivity measurements. These 175
analyzes were performed with micro-Raman spectroscopy (Freitas et al., 2017) 176
(Supplementary Figures S4-S6). Raman spectra were collected using an InVia confocal 177
Raman micro spectrometer, equipped with a 532 nm diode laser (output power of ~140 mW), 178
a Peltier-cooled CCD detector, a motorized XY stage and a Leica DM 2500 M optical 179
microscope, at the Laboratoire Magmas et Volcans, Clermont-Ferrand. The Raman 180
spectroscopy technique was preferred over FTIR analysis mainly due to its capacity to 181
analyze both OH and Si bonds in a non-destructive manner and its high spatial resolution 182
allowing the analysis of small objects (~1 μm). However, due to the unavailability of H2O
183
calibration curves for pyroxene and garnet, we were not able to perform a complete estimate 184
of the bulk H2O contents of our samples (qualitative analysis only).
185
186
3. Results 187
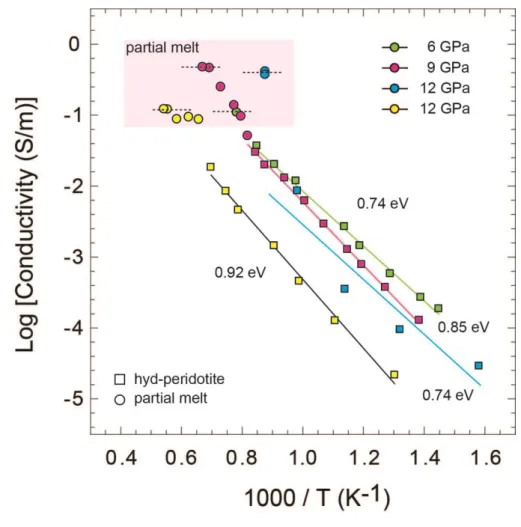
The melting of hydrous peridotite can be detected by a sudden or discontinuous 188
increase in electrical conductivity at high temperature (Fig. 1). The electrical conductivity of 189
partially molten peridotites varies from 0.1-1 S/m. The activation enthalpies of hydrous 190
peridotites before melting indicate the conduction mechanism is characteristic of electron 191
hopping (small polaron conduction) (Katsura et al., 2009). 192
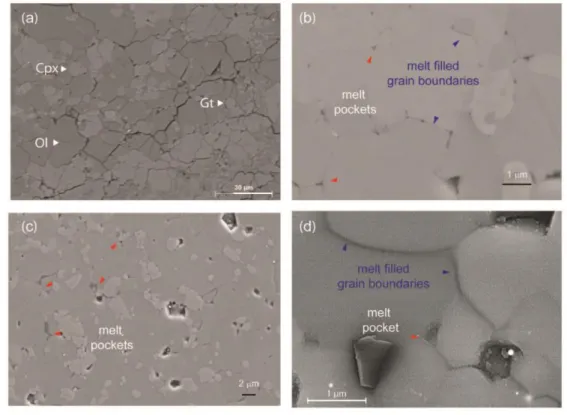
The high resolution image analyses of samples after electrical conductivity 193
measurements indicate the presence of melt in hydrous samples (Fig. 2). The experimental 194
run products indicate well developed polygonal textures with average grain size of <30 µm. 195
The melt distribution appears to be homogeneous throughout the samples and occurs as thin 196
films along grains boundaries and as small pockets of a few hundred nanometers in size at 197
triple junctions (Fig. 2 b, c, d). The melt forms an interconnected network showing a very low 198
dihedral angle with complete wetting of the grain boundaries (Freitas et al., 2017) (Fig 3). 199
Due to the extremely small size of the melt pockets (<1 µm), we were not able to 200
measure the chemical composition of the resulting hydrous silicate melt at 6 and 9 GPa. The 201
melt fraction appears to be low (up to a few %). The chemical analyses of melt at 12 GPa 202
indicate significant enrichment in incompatibles elements (Ca, Al, Na, K, Fe, Ti) (Freitas et 203
al., 2017). 204
Samples synthesized prior to electrical conductivity measurements were melt-free 205
(confirmed by X-ray powder diffraction/micro-Raman) and their mineralogy was mainly 206
composed of olivine, clinopyroxene and garnet (Fig. 2a). No evidence of hydrous phases such 207
as super-hydrous B were found in the starting materials. The proportions of the different 208
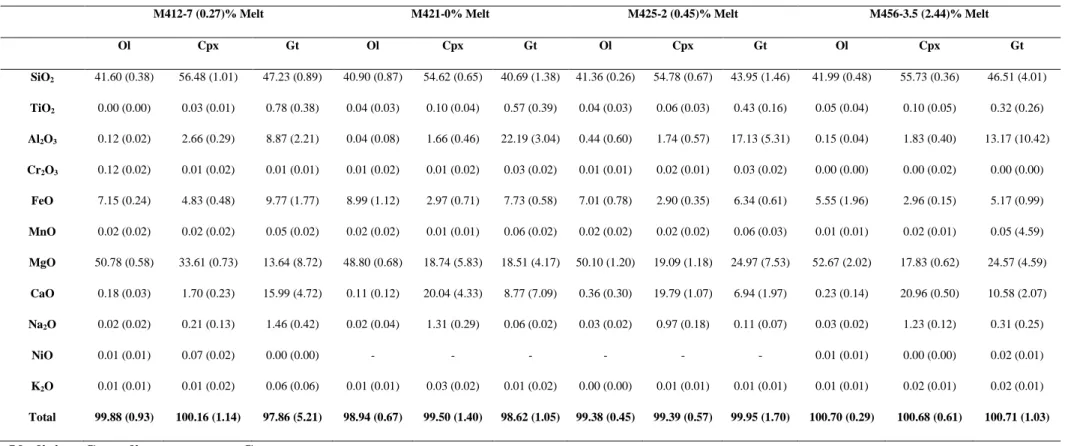
crystalline phases vary between the samples depending on the degree of melting. The starting 209
samples recovered after synthesis at 12 GPa have mineral proportions of about 60±2% 210
olivine, 20±2% garnet and 20±2% clinopyroxene. Upon partial melting at 12 GPa, the 211
proportion of olivine remained almost constant, while the proportion of Cpx decreased with 212
increasing melt fractions. The proportion of garnet slightly increased with melting, as would 213
be expected with mantle mineralogy (Kaminsky, 2012). For all experiments, the Mg number 214
of olivine is between 90 and 93. Nominally anhydrous sample have lower Mg numbers of 88-215
89, which is consistent with melt-absent conditions. Chemistry of solid phases for synthesis 216
and experimental runs are given in Supplementary Tables S2 and S3. 217
218
4. Discussion 219
4.1 Melting in the upper mantle
220
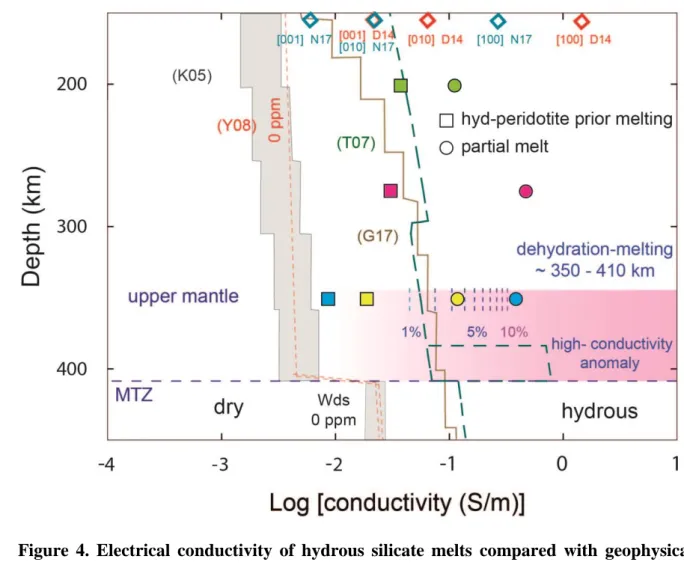
The magnetotelluric and geomagnetic depth sounding profiles of the upper mantle 221
indicate significant regional variation in electrical conductivity (Grayver et al., 2017; 222
Kuvshinov et al., 2005; Toffelmier and Tyburczy, 2007). The majority of geophysical 223
profiles are compatible with electrical conductivity resulting from hydrous upper mantle 224
minerals (Novella et al., 2017b). The comparison of these electrical conductivities of hydrous 225
silicate melts with global electromagnetic and magnetotelluric profiles of the upper mantle 226
implies that the upper mantle in the depth range 180-350 km is mainly melt free (Fig. 4). 227
However, the estimated high electrical conductivity anomaly above the 410-km discontinuity 228
(Toffelmier and Tyburczy, 2007) appears to be compatible with the presence of melt in this 229
zone (Fig. 4). Thanks to our measurements, the melt fraction required to explain this 230
observed anomaly is estimated to be <10 vol. % (Fig. 4). This estimation is significantly 231
higher than the melt fraction of 0.5-2.5 % obtained by sound velocity measurements (Freitas 232
et al., 2017) to explain the shear velocity reduction (δVs) of 3.6-9.4 %. The possible over-233
estimation of melt fraction by laboratory electrical conductivity methods has been discussed 234
in a recent study (Freitas et al., 2019) in addition to assumptions made on forward and 235
inversion models of electromagnetic data (Toffelmier and Tyburczy, 2007). In our discussion, 236
we use our electrical conductivity data to qualitatively determine the vertical extents of 237
melting in the upper mantle. 238
The absence of melt in the depth range 180-350 km confirms that the water content of 239
the upper mantle is below the saturation limits of peridotite (Ardia et al., 2012; Férot and 240
Bolfan-Casanova, 2012). This water undersaturated mid-upper mantle is sandwiched between 241
two partial melt layers. Melting at the top of the asthenosphere (above 180 km) has been 242
discussed in terms of the reduced water solubility of aluminous orthopyroxene (Mierdel et al., 243
2007), and melting below 350 km has been linked to the reduced water solubility in 244
peridotites, in both cases melting is caused by the presence of excess H2O. Here we
245
investigate whether the dehydration-induced water saturation and subsequent melting at the 246
top of the mantle transition zone has an influence on water circulation in the Earth’s upper 247
mantle. 248
249
4.2 H2O circulation in the upper mantle
250
The strong evidences supporting the presence of a melt layer atop the mantle 251
transition zone and the strict requirement of H2O for deep mantle melting underline the
252
importance of understanding the mechanism that is responsible for H2O circulation in the
253
upper mantle. Assuming that the mantle was initially dry and well mixed after the 254
establishment of the vigorously convecting global magma ocean, initiation of subduction in a 255
plate tectonic context can be considered as having been the major process responsible for 256
mantle hydration. With average downward slab velocities of between 5 and 10 cm per year 257
(Gordon, 1995a) and assuming plates thicknesses of 7 km and a total ridge length of 70000 258
km, the annual amount of subducted material is estimated to be 24-49 km (Smyth and 259
Jacobsen, 2006). With a mean age of 80 Ma, the average subducted material is estimated to 260
have between 0.1 and 1.5% of H2O (Dixon et al., 2002) leading to an H2O flux of 0.1 to 1
261
km3 into the mantle per year. However, studies of ophiolites indicate that most hydrous 262
minerals break down at shallow mantle conditions and subducted rocks in eclogite facies 263
were shown to be significantly impoverished in volatiles, with values of up to 0.25% H2O
264
(Katayama and Nakashima, 2003). Even in the case of extreme slab dehydration of up to 97% 265
(Dixon et al., 2002), H2O contents of up to 1000 ppm wt. can be preserved in subducting
266
slabs and transported down to the transition zone (Dixon et al., 2002). 267
Using slab downward speed of 5 cm per year and the MTZ thickness of 250 km, the 268
time required for a portion of slab to cross the MTZ is estimated to be 5 Ma. While this time 269
is relatively short on a planetary timescale, the slab deflection and stagnation in the MTZ 270
observed in seismic tomography studies (Zhao, 2004) suggests that residence time of 271
subducted material would be much greater than the values assumed in our calculations. With 272
a diffusion coefficient of 10-8-10-10 m²/s (Hae et al., 2006; Richard et al., 2006), a significant 273
transfer of H2O from the slab to the MTZ could be expected during that time.
274
The appearance of the melt layer above the MTZ can be inferred given the estimation 275
of H2O slab fluxes in the mantle transition zone. If we assume 24.5 km3 slab material reaches
276
the MTZ per year (volume produced at the ridges for 5 cm/year spreading velocity along 277
70000 km of ridges with an average thickness of 7 km (Gordon, 1995b)), and that these rocks 278
contain 1000 ppm wt. H2O, a mass of 9.4×10¹⁰ kg of H2O is transferred to the MTZ every
279
year. Assuming the volume of the MTZ to be 6.5×10⁷ km3, with a mass of 2.6×10²⁰ kg (mean
280
density of 4000 kg/m3), and assuming complete slab dehydration into the MTZ, only 2.2-3.3 281
Ma after the beginning of modern subduction is required to reach 800-1200 ppm wt. in the 282
MTZ, which is roughly equal to the maximum H2O solubility in nominally anhydrous
283
minerals (NAM’s) forming the upper mantle (Ardia et al., 2012; Demouchy and Bolfan-284
Casanova, 2016; Férot and Bolfan-Casanova, 2012). Using the upper limit of the inferred 285
H2O content of the mantle transition zone from geophysical methods of about 0.1-0.2 wt.%
286
H2O (Freitas et al., 2017; Huang et al., 2005), the time required to transport H2O from surface
287
to the MTZ is estimated to be 6 ± 0.6 Ma. This very simple estimation highlights the 288
efficiency of the hydration of the MTZ. It indicates clearly that melting at the 410-km 289
discontinuity would have been initiated early in the Earth’s history. However, H2O diffusion
290
into wadsleyite is a slow process (Hae et al., 2006). For example, the time required to diffuse 291
2000 ppm wt. H2O to reach 500 ppm wt. at 500 km laterally along the MTZ is estimated to be
292
175 Ga. Given that the surface area of the MTZ is significantly large and the number of 293
active subduction zones is extremely limited, it is possible that the H2O distribution in the
294
MTZ remains heterogeneous, with regions of the MTZ maintaining dry conditions (Yoshino 295
et al., 2008). The absence of seismic anomalies in some regions (Tauzin et al., 2010) 296
indicates that melting is not pervasive above the MTZ. The upwelling of H2O deprived
297
regions (< 800-1200 ppm wt.) of the MTZ may not undergo partial melting upon entering the 298
upper mantle. 299
The H2O under-saturated MTZ, as demonstrated by recent experimental studies
300
(Freitas et al., 2017; Huang et al., 2005; Karato, 2011), can be a result of continuous removal 301
of H2O from the MTZ (upward and/or downward) or partial dehydration of slabs at the MTZ.
302
The first scenario implies the presence of a global H2O circulation cycle extracting H2O from
303
the MTZ from an early stage. However, the quantity of H2O stored in the melt layer above
304
the MTZ together with the moderately hydrous olivine present in equilibrium with melt over 305
the 60 km thick layer, only represents a small portion of the total amount of H2O in the MTZ
306
(<1%). This amount is a few orders of magnitude lower than the total amount transported by 307
subducted slabs per year. Similarly, the known deep volcanic sources of OIB show that 308
source material may be only moderately hydrous with H2O content estimated between 300
309
and 1000 ppm wt. (Rüpke et al., 2006; Simons et al., 2002). These calculations demonstrate 310
the possibility of large scale melting events occurring periodically in the Earth’s history. 311
Large scale deep mantle melting has occurred in the past, as demonstrated by the presence of 312
komatiites, kimberlites and numerous large igneous provinces (Vinnik and Farra, 2007). 313
However, at present, such large scale volcanism does not exist anymore and hot spot 314
volcanism and mantle plumes are alternative candidates for removing H2O from the deep
315
Earth. 316
On the other hand, it also appears possible that slabs that are not fully dehydrated at 317
the MTZ, and instead carry a substantial amount of H2O on down to the lower mantle (Dixon
318
et al., 2002). The high H2O contents of up to 2 wt. % observed in some enriched mantle
319
sources of oceanic island basalts (OIB) indicate that some H2O may be incorporated into
320
dense hydrous silicate phases (Nishi et al., 2014; Pamato et al., 2014) that penetrates down 321
into the lower mantle via subduction processes (Rüpke et al., 2006). These would imply a 322
slower hydration rate of the MTZ and more tardive apparition of the LVL. 323
324
4.3 Bottom-up hydration of the upper mantle
325
In this section, different possible mechanisms of bottom–up hydration of Earth’s 326
upper mantle and their consequences are explored. 327
Due to the H2O under-saturated conditions of the upper mantle, the water contained in
328
hydrous melts produced at the 410-km discontinuity may diffuse in to the overlying mantle. 329
Based on the one dimensional diffusion equation (Crank, 1975), we calculate the diffusion 330
time required to hydrate the upper mantle assuming that the upper mantle is initially dry 331 (Supplementary Figure S7), 332 𝑪(𝒙, 𝒕) = 𝑪𝟎+ (𝑪𝟏− 𝑪𝟎) ∗ 𝒆𝒓𝒇𝒄 ( 𝒙 𝟐√𝑫 ∗ 𝒕) 333
where C0 is theinitial concentration, C1 is constant local concentration, x is the distance to the
334
border of concentration C1, t is the diffusion time and D the diffusion coefficient of hydrogen
335
in olivine. The value for D was estimated to be 7.82×10⁻⁹±6.1×10⁻⁸ m²/s at 1723 K for a 336
randomly oriented polycrystalline material (average of the three crystallographic direction) 337
(Novella et al., 2017b). Using average H2O solubility for mantle (Demouchy and
Bolfan-338
Casanova, 2016; Férot and Bolfan-Casanova, 2012), increasing from 300 ppm wt. at 200 km 339
up to 1000 ppm wt. at 410 km, we calculate the time required for peridotite in equilibrium 340
with the hydrous melt layer to reach H2O saturation. Our results indicate that the time
341
required to reach the H2O saturation in the uppermost mantle is unrealistically high based on
342
diffusion alone, and cannot be achieved during the planetary life time (Supplementary Figure 343
S7, Fig. 5a). 344
On the other hand, the mantle away from subducting slabs is rising passively in 345
response to the material injection by subduction. Estimated values using slab flux yield to 346
upwelling velocities of 1 mm per year (Bercovici and Karato, 2003). The estimation based on 347
convection models indicates convection rate as high as 1.5 cm/year (Becker et al., 1999). The 348
upwelling rates from subduction fluxes indicates that only 260 Ma is sufficient to bring rocks 349
from the top of the transition zone to the uppermost mantle (150 km depth) and even faster 350
considering the highest convection rates. This estimation indicates that residual hydrous 351
peridotite should be rising from the LVL to the uppermost mantle and saturates the upper 352
mantle at various depths depending on the initial H2O contents in peridotite (Fig. 5b).
353
Here we investigate the possible H2O contents of peridotites in contact with the melt
354
layer. The shear wave velocity reduction (δVs) at the melt layer is estimated to vary between 355
3.6-9.4 % (Revenaugh and Sipkin, 1994; Tauzin et al., 2010). Based on our previous study 356
(Freitas et al., 2017), the resulting melt fraction corresponding to the δVs at the low velocity 357
layer is estimated to be 0.5-2.5 vol.% 358
The average water content of the MTZ has been constrained by different methods 359
with variable results. Despite potential high water solubilities of MTZ minerals (Bolfan-360
Casaonova et al., 2018b), the actual content of the MTZ is believed to be lower than 361
saturation limit. Water contents inferred from inclusions in diamonds (Pearson et al., 2014) 362
with up to 2 % would suggest potentially high water content which also supported by 363
viscosity measurements (Fei et al. 2017). Particularly, the near-water saturated conditions 364
implied by hydrous ringwoodite inclusions found in natural diamond (Pearson et al., 2014) 365
may represent an episode of subduction-zone-related melting. However, most of geophysical 366
techniques such as elasticity, sound velocities (Inoue et al., 1998, Chang et al., 2015, Freitas 367
et al., 2017) and electrical conductivities (Huang et al., 2005, Yoshino et al., 2008, Yoshino 368
and Katsura 2012) indicating major part of MTZ contains < 0.2 wt. % H2O.
369
Assuming a batch melting scenario and H2O partitioning between peridotite and melt
370
(Novella et al., 2014), readjusted to the mineral proportions expected at 12 GPa 371
(Supplementary Text S1), we could estimate the H2O contents of peridotite in equilibrium
372
with hydrous melt for variable water contents in the mantle source for different melt fractions 373
(Fig. 6). Different scenarios could occur given the potential range of water content of the 374
residual peridotites (Fig. 6). Thus, if residual peridotite in the upwelling mantle contains 375
about 200 ppm wt. of H2O, mantle saturation can be expected at range of depths in the upper
376
mantle (Fig. 6). If we assume the H2O saturation curves of Férot and Bolfan-Casanova (Férot
377
and Bolfan-Casanova, 2012), Hirschmann et al. (Hirschmann et al., 2009), Tenner et al. 378
(Tenner et al., 2012, 2009) and Ardia et al. (Ardia et al., 2012) (for garnet/olivine partitioning 379
of H2O of 9.0), peridotite in the upper mantle reaches H2O saturation limits above 200 km. In
380
contrast, by using the extreme H2O saturation scenario proposed by Ardia et al. (Ardia et al.,
381
2012) with water partitioning between olivine and garnet of 0.9, the mantle saturation above 382
200 km depths can be expected for the water contents of 450 ppm. However, this value is 383
inconstant with the upper mantle water contents of 50-200 ppm. 384
The ascent of residual hydrous peridotites would initiate melting upon reaching their 385
storage capacities and could be responsible for the hydrous melting at the top of the 386
asthenosphere. Melting above a depth of 180 km can only be explained by moderate water 387
content in the MTZ (< 1500 ppm wt) for geologically relevant melt fractions at the 410-km 388
discontinuity (Fig. 6). The upwelling of the MTZ with water contents of less than 800 ppm 389
wt. may not undergo melting upon entering the upper mantle and may continue to hydrate the 390
upper mantle. However, such fertile peridotites are not able to explain the depleted signature 391
of the upper mantle. Melting at the 410- km discontinuity is therefore a primary requirement 392
for a compatible hydration of the upper mantle with geochemical constrains. 393
The lithosphere-asthenosphere boundary (LAB) is defined as intersection of the 394
conductive geotherm of mechanically strong crust with the fluid-saturated peridotite solidus 395
in mechanically weak upper most part of the mantle (McKenzie and Bickle, 1988). The 396
location of the LAB is therefore corresponding to the depth at which the fluid saturation 397
occurs in upwelling peridotites. The geochemical constraints suggest that the LAB is not a 398
stable feature, which appear to move up or down over geological time scale (O’Reilly and 399
Griffin, 2010). If other parameters remain constant, the lateral variation of the depth of the 400
LAB may indicate the variable water contents in residual peridotites, which corresponds to 401
the lateral variations of water contents in the MTZ. Further, the movement of the depth of the 402
LAB at the same location may suggest episodic variation of water contents in the MTZ over 403
geological time scale. The upwelling of MTZ with a water content greater than 2000 ppm wt. 404
ppm could produce residual peridotites reaching the maximum water storage capacity (Fig. 405
6). The upwelling of such peridotites could continue to melt and form a gravitationally 406
unstable melt column in the upper mantle. The upwelling of the MTZ with high water 407
contents would trigger large-scale melting (Vinnik and Farra, 2007) and could be responsible 408
for the formation of upper mantle plumes. 409
410
5. Conclusions 411
Based on our data, we propose a hydration mechanism for the Earth’s upper mantle 412
that is consistent with geophysical observations (magnetotelluric and seismic profiles) and 413
geochemical constraints. In this bottom-up water transportation mechanism, the residual 414
hydrous peridotites, formed as a result of melting at the 410-km discontinuity, upwell across 415
the upper mantle, replacing initially dry mantle peridotites. The resulting water content in the 416
residues is directly related to the water content of the mantle transition zone and the degree of 417
melting. The upper limit of 200 ppm observed for the upper mantle can be maintained in 418
residual peridotites if the water content of the MTZ is less than 1500 ppm . The slow H2O
419
diffusion rates in wadsleyite may enforce large gradient in H2O distribution within the MTZ,
420
and as a result, regional variations of H2O contents in the upper mantle would be expected.
The ascent of residual hydrous peridotites could be responsible for the hydrous melting at the 422
top of the asthenosphere. 423
424
Acknowledgements 425
We thank F. Schiavi for the assistance with Raman analyses, A. Mathieu for technical 426
assistance, J.M Hénot, J.L Devidal and 2MAtech staff for their help in SEM and EMP and 427
FEG-SEM analyses, respectively. We appreciate the discussion with J, Chantel, D, Andrault, 428
N. Bolfan-Casanova and M.A Bouhifd. G.M. acknowledges funding from the French PNP 429
program (INSU-CNRS). This research was financed by the French Government Laboratory 430
of Excellence initiative n°ANR-10-LABX-0006, the Région Auvergne and the European 431
Regional Development Fund. This is ClerVolc contribution number xx. 432
433
References 434
Ardia, P., Hirschmann, M.M., Withers, A.C., Tenner, T.J., 2012. H2O storage capacity of 435
olivine at 5-8GPa and consequences for dehydration partial melting of the upper mantle. 436
Earth Planet. Sci. Lett. 345–348, 104–116. doi:10.1016/j.epsl.2012.05.038 437
Becker, T.W., Kellogg, J.B., O’ Connell, R.J., 1999. Thermal constraints on the survival of 438
primitive blobs in the lower mantle. Earth Planet. Sci. Lett. 171, 351–365. 439
doi:10.1016/S0012-821X(99)00160-0 440
Bercovici, D., Karato, S.-I., 2003. Whole-mantle convection and the transition-zone water 441
filter. Nature 425, 39–44. doi:10.1038/nature01918 442
Bolfan-Casanova, N., Keppler, H., Rubie, D.C., 2000. Water partitioning between nominally 443
anhydrous minerals in the MgO-SiO2-H2O system up to 24 GPa: Implications for the 444
distribution of water in the Earth’s mantle. Earth Planet. Sci. Lett. 182, 209–221. 445
doi:10.1016/S0012-821X(00)00244-2 446
Bolfan-casanova, N., Schiavi, F., Novella, D., Bureau, H., Raepsaet, C., Khodja, H., 447
Demouchy, S., Bolfan-casanova, N., Schiavi, F., Novella, D., Bureau, H., Raepsaet, C., 448
2018. Examination of Water Quantification and Incorporation in Transition Zone 449
Minerals : Wadsleyite , Ringwoodite and Phase D Using ERDA ( Elastic Recoil 450
Detection Analysis ) To cite this version : HAL Id : cea-01818386 Examination of Water 451
Quantification and Incorporation in Transition Zone Minerals : Wadsleyite , 452
Ringwoodite and Phase D Using ERDA ( Elastic Recoil Detection Analysis ). 453
doi:10.3389/feart.2018.00075 454
Chang, Y.-Y., Jacobsen, S. D., Bina, C. R., Thomas, S. M., Smyth, J. R., Frost, D. J., et al. 455
(2015). Comparative compressibility of hydrous wadsleyite and ringwoodite: effect of 456
H2O and implications for detecting water in the transition zone. J. Geophys. Res. Solid 457
Earth 120, 259–8280. 458
Crank, J., 1975. The mathematics of diffusion. Clarendon Press, Oxford. 459
Dai, L., Karato, S., 2014. High and highly anisotropic electrical conductivity of the 460
asthenosphere due to hydrogen diffusion in olivine. Earth Planet. Sci. Lett. 408, 79–86. 461
doi:10.1016/j.epsl.2014.10.003 462
Dai, L., Karato, S., 2009. Electrical conductivity of wadsleyite at high temperatures and high 463
pressures. Earth Planet. Sci. Lett. 287, 277–283. doi:10.2138/am.2011.3796 464
Demouchy, S., Bolfan-Casanova, N., 2016. Distribution and transport of hydrogen in the 465
lithospheric mantle: A review. Lithos 240–243, 402–425. 466
doi:10.1016/j.lithos.2015.11.012 467
Dixon, J.E., Leist, L., Langmuir, C., Schilling, J., 2002. Recycled dehydrated lithosphere 468
observed in plume-influenced mid-ocean-ridge basalt. Nature 420, 385–389. 469
Fei, H., Yamazaki, D., Sakurai, M., Miyajima, N., Ohfuji, H., 2017. A nearly water-saturated 470
mantle transition zone inferred from mineral viscosity. doi:10.1126/sciadv.1603024 471
Férot, A., Bolfan-Casanova, N., 2012. Water storage capacity in olivine and pyroxene to 472
14GPa: Implications for the water content of the Earth’s upper mantle and nature of 473
seismic discontinuities. Earth Planet. Sci. Lett. 349–350, 218–230. 474
doi:10.1016/j.epsl.2012.06.022 475
Freitas, D., Manthilake, G., Chantel, J., Bouhfid, M.., Andrault, D., 2019. Simultaneous 476
measurements of electrical conductivity and seismic velocity of partially molten 477
geological materials: Implications for melt fraction in the upper mantle. Phys. Chem. 478
Miner. 0, 0. doi:10.1007/s00269-019-01021-5 479
Freitas, D., Manthilake, G., Schiavi, F., Chantel, J., Bolfan-Casanova, N., Bouhifd, M.A., 480
Andrault, D., 2017. Experimental evidence supporting a global melt layer at the base of 481
the Earth’s upper mantle. Nat. Commun. 8, 2186. doi:10.1038/s41467-017-02275-9 482
Gaillard, F., Malki, M., Iacono-Marziano, G., Pichavant, M., Scaillet, B., 2008. Carbonatite 483
melts and electrical conductivity in the asthenosphere. Science (80-. ). 322, 1363–1365. 484
doi:10.1126/science.1164446 485
Gordon, G., 1995a. Plate motions , crustal and lithospheric mobility , and paleomagnetism : 486
Prospective viewpoint. J. Geophys. Res. 100, 24367–24392. 487
Gordon, G., 1995b. Global Earth Physics: A Handbook of Physical Constants, AGU Washin. 488
ed. 489
Grayver, A. V., Munch, F.D., Kuvshinov, A. V., Khan, A., Sabaka, T.J., Tøffner-Clausen, L., 490
2017. Joint inversion of satellite-detected tidal and magnetospheric signals constrains 491
electrical conductivity and water content of the upper mantle and transition zone. 492
Geophys. Res. Lett. 44, 6074–6081. doi:10.1002/2017GL073446 493
Grotenhuis, S.M., Drury, M.R., Spiers, C.J., Peach, C.J., 2005. Melt distribution in olivine 494
rocks based on electrical conductivity measurements 110, 1–11. 495
doi:10.1029/2004JB003462 496
Hae, R., Ohtani, E., Kubo, T., Koyama, T., Utada, H., 2006. Hydrogen diffusivity in 497
wadsleyite and water distribution in the mantle transition zone. Earth Planet. Sci. Lett. 498
243, 141–148. doi:10.1016/j.epsl.2005.12.035 499
Hernlund, J., Einenweber, K., Locke, D., Tyburczy, J., 2006. A numerical model for steady-500
state temperature distributions in solid-medium high-pressure cell assemblies 91, 295– 501
305. doi:10.2138/am.2006.1938 502
Hirschmann, M.M., 2006. Water, melting, and the deep Earth H2O cycle. Annu. Rev. Earth 503
Planet. Sci. 34, 629–653. doi:10.1146/annurev.earth.34.031405.125211 504
Hirschmann, M.M., Aubaud, C., Withers, A.C., 2005. Storage capacity of H2O in nominally 505
anhydrous minerals in the upper mantle. Earth Planet. Sci. Lett. 236, 167–181. 506
doi:10.1016/j.epsl.2005.04.022 507
Hirschmann, M.M., Tenner, T., Aubaud, C., Withers, A.C., 2009. Dehydration melting of 508
nominally anhydrous mantle: The primacy of partitioning. Phys. Earth Planet. Inter. 176, 509
54–68. doi:10.1016/j.pepi.2009.04.001 510
Hirth, G., Kohlstedt, D.L., 1995. Experimental constraints on the dynamics of the partially 511
molten upper mantle: Deformation in the diffusion creep regime. J. Geophys. Res. Solid 512
Earth 100, 1981–2001. doi:10.1029/94JB02128 513
Huang, X., Xu, Y., Karato, S., 2005. Water content in the transition zone from electrical 514
conductivity of wadsleyite and ringwoodite. Nature 434, 746–749. 515
doi:10.1038/nature03426 516
Inoue, T.,Weidner, D. J., Northrup, P. A., and Parise, J. B. (1998). Elastic properties of 517
hydrous ringwoodite (?-phase) in Mg2SiO4. Earth Planet. Sci. Lett. 160, 107–113. doi: 518
10.1016/S0012-821X(98)00077-6 519
Kaminsky, F., 2012. Earth-Science Reviews Mineralogy of the lower mantle : A review of ‘ 520
super-deep ’ mineral inclusions in diamond. Earth Sci. Rev. 110, 127–147. 521
doi:10.1016/j.earscirev.2011.10.005 522
Karato, S., 1990. The role of hydrogen in the electrical conductivity of the upper mantle. 523
Nature 347, 183–187. doi:10.1038/346183a0 524
Karato, S., Bercovici, D., Leahy, G., Richard, G., Jing, Z., 2006. The Transition-Zone Water 525
Filter Model for Global Material Circulation : Where Do We Stand ? Earth’s Deep 526
Water Cycle 289–313. doi:10.1029/168GM22 527
Karato, S.I., 2011. Water distribution across the mantle transition zone and its implications 528
for global material circulation. Earth Planet. Sci. Lett. 301, 413–423. 529
doi:10.1016/j.epsl.2010.11.038 530
Katayama, I., Nakashima, S., 2003. Hydroxyl in clinopyroxene from the deep subducted 531
crust : Evidence for H2O transport into the mantle. Am. Mineral. 88, 229–234. 532
Katsura, T., Yoshino, T., Manthilake, G., Matsuzaki, T., 2009. Electrical conductivity of the 533
major upper mantle minerals: a review. Russ. Geol. Geophys. 50, 1139–1145. 534
doi:10.1016/j.rgg.2009.11.012 535
Kohlstedt, D.L., Keppler, H., Rubie, D.C., 1996. Solubility of water in the α, β and γ phases 536
of (Mg,Fe)2SiO4. Contrib. to Mineral. Petrol. 123, 345–357. 537
doi:10.1007/s004100050161 538
Kuvshinov, A., Utada, H., Avdeev, D., Koyama, T., 2005. 3-D modelling and analysis of Dst 539
C-responses in the North Pacific Ocean region, revisited. Geophys. J. Int. 160, 505–526. 540
doi:10.1111/j.1365-246X.2005.02477.x 541
Manthilake, G., Bolfan-Casanova, N., Novella, D., Mookherjee, M., Andrault, D., 2016. 542
Dehydration of chlorite explains anomalously high electrical conductivity in the mantle 543
wedges. Sci. Adv. 2. 544
Manthilake, G., Mookherjee, M., Bolfan-Casanova, N., Andrault, D., 2015. Electrical 545
conductivity of lawsonite and dehydrating fluids at high pressures and temperatures. 546
Geophys. Res. Lett. 42, 7398–7405. 547
Manthilake, M. a G.M., Matsuzaki, T., Yoshino, T., Yamashita, S., Ito, E., Katsura, T., 2009. 548
Electrical conductivity of wadsleyite as a function of temperature and water content. 549
Phys. Earth Planet. Inter. 174, 10–18. doi:10.1016/j.pepi.2008.06.001 550
Matsukage, K.N., Jing, Z., Karato, S., 2005. Density of hydrous silicate melt at the conditions 551
of Earth’s deep upper mantle. Nature 438, 488–91. doi:10.1038/nature04241 552
Maumus, J., Bagdassarov, N., Schmeling, H., 2005. Electrical conductivity and partial 553
melting of mafic rocks under pressure. Geochim. Cosmochim. Acta 69, 4703–4718. 554
doi:10.1016/j.gca.2005.05.010 555
McKenzie D., Bickle M. J., 1988. The Volume and Composition of Melt Generated by 556
Extension of the Lithosphere. J. Petrol. 29, 625–679. 557
Mibe, K., Fujii, T., Yasuda, A., 1999. Control of the location of the volcanic front in island 558
arcs by aqueous fluid connectivity in the mantle wedge. Nature 401, 259–262. 559
doi:10.1038/45762 560
Mibe, K., Fujii, T., Yasuda, A., 1998. Connectivity of aqueous fluid in the Earth’s upper 561
mantle 25, 1233–1236. 562
Michael, P.J., 1988. The concentration, behavior and storage of H20 in the suboceanic upper 563
mantle: Implications for mantle metasomatism. Geochim. Cosmochim. Acta 52, 555– 564
566. 565
Mierdel, K., Keppler, H., Smyth, J.R., Langenhorst, F., 2007. Water Solubility in Aluminous 566
Orthopyroxene and the Origin of Earth’s Asthenosphere. Science (80-. ). 315, 364–368. 567
doi:10.1126/science.1135422 568
Morgan, J.P., Morgan, W.J., 1999. Two-stage melting and the geochemical evolution of the 569
mantle : a recipe for mantle plum-pudding. Earth Planet. Sci. Lett. 170, 215–239. 570
Ni, H., Keppler, H., Manthilake, M.A.G.M., Katsura, T., 2011. Electrical conductivity of dry 571
and hydrous NaAlSi3O8 glasses and liquids at high pressures. Contrib. to Mineral. 572
Petrol. 162, 501–513. doi:10.1007/s00410-011-0608-5 573
Nishi, M., Irifune, T., Tsuchiya, J., Tange, Y., Nishihara, Y., Fujino, K., Higo, Y., 2014. 574
Stability of hydrous silicate at high pressures and water transport to the deep lower 575
mantle 7. doi:10.1038/NGEO2074 576
Novella, D., Dolejš, D., Myhill, R., Pamato, M.G., Manthilake, G., Frost, D.J., 2017a. 577
Melting phase relations in the systems Mg2SiO4–H2O and MgSiO3–H2O and the 578
formation of hydrous melts in the upper mantle. Geochim. Cosmochim. Acta 204, 68– 579
82. doi:10.1016/j.gca.2016.12.042 580
Novella, D., Frost, D.J., Hauri, E.H., Bureau, H., Raepsaet, C., Roberge, M., 2014. The 581
distribution of H2O between silicate melt and nominally anhydrous peridotite and the 582
onset of hydrous melting in the deep upper mantle. Earth Planet. Sci. Lett. 400, 1–13. 583
doi:10.1016/j.epsl.2014.05.006 584
Novella, D., Jacobsen, B., Weber, P.K., Tyburczy, J.A., Ryerson, F.J., Du Frane, W.L., 585
2017b. Hydrogen self-diffusion in single crystal olivine and electrical conductivity of 586
the Earth’s mantle. Sci. Rep. 7, 1–10. doi:10.1038/s41598-017-05113-6 587
O’Reilly, S.Y., Griffin, W.L., 2010. The continental lithosphere-asthenosphere boundary: 588
Can we sample it? Lithos 120, 1–13. doi:10.1016/j.lithos.2010.03.016 589
Pamato, M.G., Myhill, R., Boffa Ballaran, T., Frost, D.J., Heidelbach, F., Miyajima, N., 590
2014. Lower-mantle water reservoir implied by the extreme stability of a hydrous 591
aluminosilicate. Nat. Geosci. 8, 75–79. doi:10.1038/NGEO2306 592
Pearson, D.G., Brenker, F.E., Nestola, F., McNeill, J., Nasdala, L., Hutchison, M.T., 593
Matveev, S., Mather, K., Silversmit, G., Schmitz, S., Vekemans, B., Vincze, L., 2014. 594
Hydrous mantle transition zone indicated by ringwoodite included within diamond. 595
Nature 507, 221–224. 596
Revenaugh, J., Sipkin, S., 1994. Seismic evidance for silicate melt atop the 410-km mantle 597
discontinuity. Nature 369, 474–476. 598
Richard, G., Bercovici, D., Karato, S., 2006. Slab dehydration in the Earth ’ s mantle 599
transition zone 251, 156–167. doi:10.1016/j.epsl.2006.09.006 600
Rüpke, L., Morgan, J.P., Dixon, J.E., 2006. Implications of Subduction Rehydration for Earth 601
’ s Deep Water Cycle, in: Jacobsen, S.D., Van Der Lee, S. (Eds.), Earth’s Deep Water 602
Cycle. American Geophysical Union, pp. 263–276. 603
Saal, A.E., Hauri, E.H., Langmuir, C.H., Perfit, M.R., 2002. Vapour undersaturation in 604
primitive mid-ocean-ridge basalt and the volatile content of Earth’s upper mantle. 605
Nature 419, 451–455. doi:10.1038/nature01073 606
Simons, K., Dixon, J., Schilling, J.-G., Kingsley, R., Poreda, R., 2002. Volatiles in basaltic 607
glasses from the Easter-Salas y Gomez Seamount Chain and Easter Microplate: 608
Implications for geochemical cycling of volatile elements. Geochemistry, Geophys. 609
Geosystems 3, 1–29. doi:10.1029/2001GC000173 610
Smyth, J.R., Jacobsen, S.D., 2006. Nominally Anhydrous Minerals and Earth’s Deep Water 611
Cycle, in: Jacobsen, S.D., Van Der Lee, S. (Eds.), Earth’s Deep Water Cycle, 612
Geophysical Monograph Series. American Geophysical Union. 613
doi:doi:10.1029/168GM02 614
Song, T.-R.A., Helmberger, D. V, Grand, S.P., 2004. Low-velocity zone atop the 410-km 615
seismic discontinuity in the northwestern United States. Nature 427, 530–533. 616
doi:10.1038/nature02231 617
Tauzin, B., Debayle, E., Wittlinger, G., 2010. Seismic evidence for a global low-velocity 618
layer within the Earth’s upper mantle. Nat. Geosci. 3, 718–721. doi:10.1038/ngeo969 619
Tauzin, B., van der Hilst, R.D., Wittlinger, G., Ricard, Y., 2013. Multiple transition zone 620
seismic discontinuities and low velocity layers below western United States. J. Geophys. 621
Res. Solid Earth 118, 2307–2322. doi:10.1002/jgrb.50182 622
Tenner, T.J., Hirschmann, M.M., Withers, A.C., Ardia, P., 2012. H2O storage capacity of 623
olivine and low-Ca pyroxene from 10 to 13 GPa: Consequences for dehydration melting 624
above the transition zone. Contrib. to Mineral. Petrol. 163, 297–316. 625
doi:10.1007/s00410-011-0675-7 626
Tenner, T.J., Hirschmann, M.M., Withers, A.C., Hervig, R.L., 2009. Hydrogen partitioning 627
between nominally anhydrous upper mantle minerals and melt between 3 and 5 GPa and 628
applications to hydrous peridotite partial melting. Chem. Geol. 262, 42–56. 629
doi:10.1016/j.chemgeo.2008.12.006 630
Toffelmier, D.A., Tyburczy, J.A., 2007. Electromagnetic detection of a 410-km-deep melt 631
layer in the southwestern United States. Nature 447, 991–994. doi:10.1038/nature05922 632
Vinnik, L., Farra, V., 2007. Low S velocity atop the 410-km discontinuity and mantle 633
plumes. Earth Planet. Sci. Lett. 262, 398–412. doi:10.1016/j.epsl.2007.07.051 634
Wang, W., Takahashi, E., 2000. Subsolidus and melting experiments of K-doped peridotite 635
KLB-1 to 27 GPa: Its geophysical and geochemical implications. J. Geophys. Res. 105, 636
2855–2868. 637
Watson, E.B., Brenan, J.M., Baker, D.R., 1991. Continental Mantle. Oxford Univeristy Press. 638
Yoshino, T., and Katsura, T. (2012). Re-evaluation of electrical conductivity of anhydrous 639
and hydrous wadsleyite. Earth Planet. Sci. Lett. 337, 56–67. doi: 640
10.1016/j.epsl.2012.05.023 641
Yoshino, T., 2010. Laboratory Electrical Conductivity Measurement of Mantle Minerals. 642
Surv. Geophys. 31, 163–206. doi:10.1007/s10712-009-9084-0 643
Yoshino, T., Manthilake, G., Matsuzaki, T., Katsura, T., 2008. Dry mantle transition zone 644
inferred from the conductivity of wadsleyite and ringwoodite 451, 1–4. 645
doi:10.1038/nature06427 646
Yoshino, T., Nishihara, Y., Karato, S. ichiro, 2007. Complete wetting of olivine grain 647
boundaries by a hydrous melt near the mantle transition zone. Earth Planet. Sci. Lett. 648
256, 466–472. doi:10.1016/j.epsl.2007.02.002 649
Zhao, D., 2004. Global tomographic images of mantle plumes and subducting slabs : insight 650
into deep Earth dynamics 146, 3–34. doi:10.1016/j.pepi.2003.07.032 651
652 653
Figure captions 654
655
Figure 1. Electrical conductivity of hydrous peridotites at 6, 9 and 12 GPa. The 656
peridotites before melting are indicated in squares and after partial melting are in circles. The 657
melt conductivities used for the discussion are shown with horizontal lines. Activation 658
enthalpies are given in eV, next to the individual fits. The error bars associated with the 659
electrical conductivity data measurements are less than the symbol size at high temperatures. 660
The uncertainties in the estimation of the electrical conductivity result from the estimations of 661
temperature, pressure, and sample dimensions as well as data fitting errors and are less than 662
5%. 663
664
Figure 2. High resolution microphotographs of the recovered samples before and after 665
the electrical conductivity measurements. (a) Hydrous peridotite sample showing mineral 666
distribution before melting at 12 GPa (M421). (b) The mineral and melt distribution of 667
partially molten sample after the electrical conductivity measurements at 6 GPa (M667), (c) 668
at 9 GPa (M668), (d) and at 12 GPa (M425). 669
670
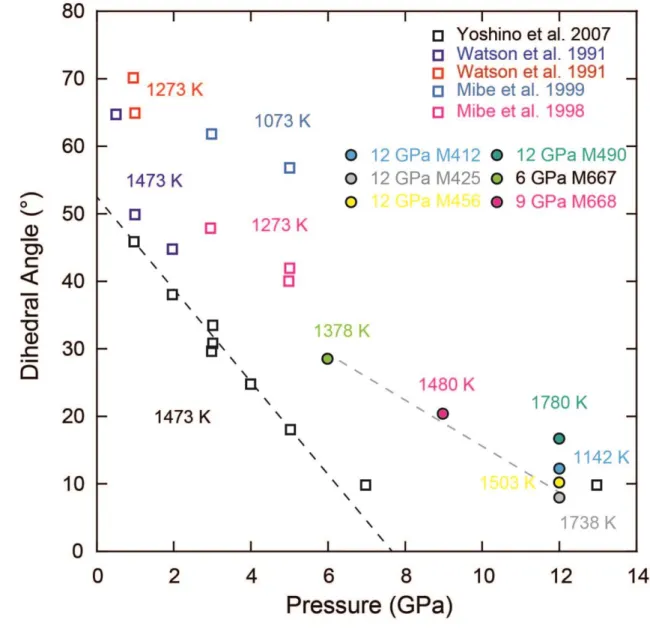
Figure 3. Dihedral angles estimated in our partially molten samples as a function of 671
pressure. The maximum temperature of each experiment is indicated next to its symbol. 672
Dihedral angles were estimated using FEG SEM and SEM image analysis with Matlab code 673
to measure the angles by the tangent method. Analytical error is estimated to be 5° (1σ). 674
Relevant literature values for similar or analogue systems at lower pressures have been 675
represented for comparison (Mibe et al., 1999, 1998; Watson et al., 1991; Yoshino et al., 676
2007). 677
679
Figure 4. Electrical conductivity of hydrous silicate melts compared with geophysical 680
profiles. Electrical conductivities of peridotite prior to melting (squares) and partially molten 681
peridotites (circles) at 6, 9 and 12 GPa are displayed as a function of depth. Hashin Shtrikman 682
upper bound (HS+) conductivities for different melt fraction are displayed for 12 GPa 683
samples with dashed lines. The conductivity profiles are for oceanic mantle (pacific, KO5) 684
(Kuvshinov et al., 2005), continental (Tuscan SW USA, T07) (Toffelmier and Tyburczy, 685
2007) and global electrical conductivity model of Earth’s mantle based on inverting satellite 686
magnetic field measurements (G17) (Grayver et al., 2017). Pink shaded area indicates the 687
possible distribution of hydrous melt at the top of the mantle transition zone. In this area the 688
high conductivity anomaly modeled from EM data has been represented (Toffelmier and 689
Tyburczy, 2007). Dry upper mantle electrical conductivity vs depth profile based on high 690
pressure electrical conductivity measurements are also displayed (Yoshino et al., 2008). 691
Electrical conductivities of oriented single crystal olivine from measurements (Dai and 692
Karato 2014) (4 GPa and extrapolated to mantle temperatures) and diffusion experiments 693
(Novella et al., 2017b) (2 GPa, extrapolated to mantle temperatures and with 80 ppm of 694
water) have been reported. Electrical conductivity anomaly of 350’ cannot be reproduced by 695
moderately anisotropic solid rock but rather require presence of melts. Our solid hydrous 696
peridotites conductivities agree well with randomly oriented olivine values. 697
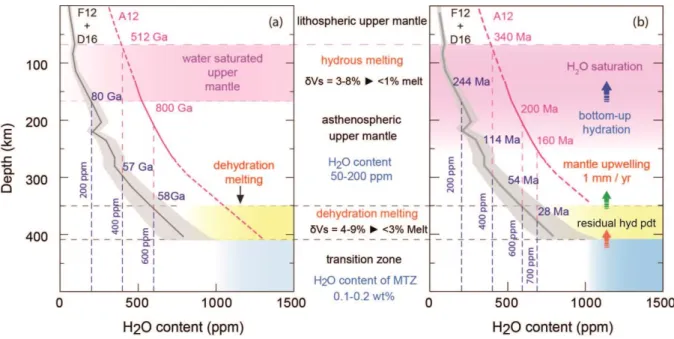
699
Figure 5. Comparison of water transport mechanisms of the Earth’s upper mantle. (a) 700
Hydration of the Earth’s upper mantle by diffusion. The estimations are based on the 701
diffusion coefficient of 7.89×10⁻⁹ m2/s (Novella et al., 2017a) at 1723K with initial H2O
702
concentration of 800 ppm wt. and variable diffusion lengths (from 410-km to the saturation 703
depth at a given water content) (see also Supplementary Fig. S7). The water saturation curves 704
are for peridotite without considering garnet (F12) (Férot and Bolfan-Casanova, 2012) and 705
considering water partition between olivine and garnet (0.9) (A12) (Ardia et al., 2012). The 706
broken lines indicate the time required to saturate the upper mantle by diffusion at given 707
depths for a given bulk water content. The shaded in yellow indicates regions where 708
dehydration-melting is expected. The shaded in pink indicate depth range for mantle H2O
709
saturation which can’t be explained by diffusion process. (b) Hydration by upwelling. The 710
dehydration melting at the 410-km discontinuity (Freitas et al., 2017) produces residual 711
peridotites with different H2O concentration according melt fractions and compositions. The
712
continuous upwelling of hydrous peridotite replaces the initially dry peridotite in the upper 713
mantle, forming hydrous upper mantle. The ascending peridotite reaches water saturation 714
levels at different depths (Ardia et al., 2012; Férot and Bolfan-Casanova, 2012), and should 715
initiate hydrous melting. The broken lines indicate the time required to saturate the upper 716
mantle at given depths for a given bulk water content. The water saturation curves are for 717
peridotite without considering garnet (F12) (Férot and Bolfan-Casanova, 2012) and with 718
considering water partition between olivine and garnet (A12) (Ardia et al., 2012). The shaded 719
in yellow indicates regions where dehydration-melting is expected. The shaded in pink 720
indicate depth range for mantle H2O saturation.
721
722
Figure 6. Bottom-up hydration of the upper mantle. The H2O contents are calculated
723
assuming batch melting scenario at the 410-km discontinuity. The H2O contents in the source
724
(MTZ) are marked next to individual lines. The Gray shaded area indicates the melt fraction 725
expected at the partially molten layer above the MTZ. The area shaded in Yellow indicates 726
H2O content of the upper mantle. Vertical lines (F12/D16) (Demouchy and Bolfan-727
Casanova, 2016; Férot and Bolfan-Casanova, 2012) and (A12) (Ardia et al., 2012) indicate 728
water saturation limits at different depths based on water solubilities of peridotites. 729
Supplementary materials for:
Electrical conductivity of hydrous silicate melts: Implications for the bottom-up hydration of Earth’s upper mantle
D.Freitas1*, G. Manthilake1
1Université Clermont Auvergne, CNRS, IRD, OPGC, Laboratoire Magmas et Volcans,
F-63000 Clermont-Ferrand, France (*corresponding author: damien.freitas@uca.fr)
Supplementary materials
Here we give supplementary information concerning:
The estimation of the H2O partition coefficient for peridotite/melt at 12 GPa
(Text S1)
Experimental conditions and parameters of syntheses and in situ measurements (table S1)
Average chemical composition of solid mineral phases at 6 and 9 GPa both before and after EC measurements (Table S2)
Average chemical composition of solid mineral phases at 12 GPa. (Table S3) Schematic cross section of the high pressure assemblies (Figure S1)
Modeling of thermal gradient in our assembly (Figure S2)
Impedance spectra of the sample at different stages of heating (Figure S3)
Representative Raman spectra from starting materials and recovered experimental runs at 6 GPa (Figure S4)
Representative Raman spectra from starting materials and recovered experimental runs at 9 GPa (Figure S5)
Representative Raman spectra from recovered experimental runs at 12 GPa. (Figure S6)
Water diffusion calculations for the hydration of Earth’s upper mantle. (Figure S7)
Supplementary Text S1: The estimation of the H2O partition coefficient for
peridotite/melt at 12 GPa.
The H2O partition coefficient between peridotite and melt is available at 6 GPa
(Novella et al., 2014). Due to the significant variation of mineral proportions at 12 GPa, we have estimate the H2O partition coefficient between peridotite and melt based on mantle
mineralogy at 12 GPa. The bulk partition coefficient can be calculated by:
𝐷𝐻2𝑂𝑝𝑑𝑡/𝑚𝑒𝑙𝑡 = ∑ 𝑋𝑖𝐾𝑑𝑖
Where X is the fraction of each mineral (i) and Kd its partition coefficient for water with melt. The Kd values are taken from Novella et al. 2014 (Novella et al., 2014) and mineral proportions where estimated using the mineral proportions estimated at 12 GPa in our study. Mineral proportion at 12 GPa are observed to be 60 % of olivine, 28 % of garnet (Gt) and 12 % of clinopyroxene (Cpx). Kd (Novella et al., 2014) STD Melt/olivine 0.004 0.0006 Melt/Opx 0.0064 0.0004 Melt/Cpx 0.0115 0.0016 Melt/garnet 0.0032 0.0008 DMelt/pdt 6 GPa 0.006288 0.000343 DMelt/pdt 12 GPa 0.004676 0.000424