HAL Id: hal-02493410
https://hal.archives-ouvertes.fr/hal-02493410
Preprint submitted on 27 Feb 2020
HAL is a multi-disciplinary open access archive for the deposit and dissemination of sci-entific research documents, whether they are pub-lished or not. The documents may come from teaching and research institutions in France or abroad, or from public or private research centers.
L’archive ouverte pluridisciplinaire HAL, est destinée au dépôt et à la diffusion de documents scientifiques de niveau recherche, publiés ou non, émanant des établissements d’enseignement et de recherche français ou étrangers, des laboratoires publics ou privés.
Supply chain trade in East Africa: Prospects and
challenges*
Jaime de Melo, Anna Twum
To cite this version:
Jaime de Melo, Anna Twum. Supply chain trade in East Africa: Prospects and challenges*. 2020. �hal-02493410�
fondation pour les études et recherches sur le développement international
ATION REC ONNUE D ’UTILITÉ PUBLIQUE . T EN ŒUVRE A VEC L ’IDDRI L ’INITIA TIVE POUR LE DÉ VEL OPPEMENT ET LA GOUVERNANCE MONDIALE (IDGM).
OORDONNE LE LABEX IDGM+ QUI L
’ASSOCIE A U CERDI E T À L ’IDDRI. ATION A BÉNÉFICIÉ D ’UNE AIDE DE L ’É TA T FR ANC AIS GÉRÉE P AR L ’ANR A U TITRE DU PR OGR A MME «INVESTISSEMENT S D ’A VENIR» -14-01».
Supply chain trade in
East Africa: Prospects and
challenges*
Jaime de Melo
Anna Twum
Jaime de Melo, Scientific Director at FERDI and Emeritus Professor at the University of Geneva.
Anna Twum, Country Economist at the IGC in Rwanda.
Abstract
Deeper regional integration is the main objective of the recently launched Africa Continental Free Trade Area (AfCFTA). Supply chain trade both at the level of the Regional Economic Communities (RECs) and across RECs are to spearhead the AfCFTA. Indicators of Global Value Chains (GVC) participation show that even though the EAC and other African RECs have increased their participation in GVCs over the period 1990-2015 surpassing MERCOSUR they still lag behind the ASEAN region. There has also been little improvement in the participation of African RECs in Regional Value Chains (RVCs). This outcome is not due to a lack of ambition. Indeed, African Regional Economic Communities (RECs) have prioritized strengthening deeper RVC integration as a stepping stone to their development. The EAC has gone as far as targeting specific value chains: cotton, wood and paper, food and beverages among others, but with very little to show for it so far; only 1.7% of total gross exports of the EAC are related to RVCs. This is in contrast to ASEAN (17.2%), MERCOSUR (4.6%) and SADC (3%); within the EAC, Rwanda has made impressive progress while Uganda has underperformed.
… /…
* We thank Ana Fernandes and Melise Jaud for sharing their classification of GVC participation and Alessandro Borin and
Dev
elopment Po
lic
ie
s
W
ork
ing Paper
263
February 2020“Sur quoi la fondera-t-il l’économie du monde qu’il veut
gouverner? Sera-ce sur le caprice de chaque particulier? Quelle
confusion! Sera-ce sur la justice? Il l’ignore.”
… /… Overall, over the period 1990-2015, the EAC and other African RECs have participated mostly in non-regional value chains along forward rather than backward participation (i.e. their value-added exports are mostly on intermediates that enter exports of other trade partners while the share of foreign exports in their exports is low) activities. This paper singles out for discussion three obstacles hampering greater inclusion in global value chains: (i) high tariffs on imports of intermediates; (ii) restrictive rules of origin, an obstacle to intra-regional trade; (iii) high ad-valorem equivalents of barriers to connectivity and more generally to trade in services. Lastly, controlling for per capita income, correlations for the sample of 149 countries over the period 1995-2015 confirms that overall GVC participation is negatively associated with increases on the tariffs on imports and exports of intermediates as well as on trade costs. However, forward GVC participation (i.e. the share of intermediates of foreign origin) is positively associated with the number of mobile phone subscribers a proxy for digital connectivity.
Contents
1. Introduction ... 4
2. Measures and Data ... 5
3. Trends in Global Value Chains: Comparisons by Geographic regions ... 7
3.2 Supply Chains: Regional (RVC) vs non-regional (GVC) and by type (backward vs. forward) ... 9
4.0 Supply chains by region and by strategic sectors. ... 11
4.1 A REC perspective of GVC-related Trade ... 11
4.2. GVC participation patterns in sectors of strategic interest ... 15
4.3 EAC GVC participation by member state ... 15
5. A Taxonomy of GVC participation ... 16
6. Obstacles to the development of GVCs: both global and regional ... 20
6.1 Obstacle 1: High tariffs on intermediates... 20
6. 2 Obstacle 2: restrictive rules of origin (RoO) ... 21
6.3 Obstacle 3: Services for greater Connectivity ... 23
7. Correlates of GVC participation rates ... 25
8. Conclusions and policy recommendations ... 29
Annexes ... 31
Annex A1: Measures of supply chain participation ... 31
Annex A2: Sample and definition of regional categories and RTA memberships ... 33
Table A1: Membership across Regional categories ... 35
Table A2: Membership across Regional Economic Communities and comparators ... 36
Annex A3: Extra Figures ... 37
Figure A2: GVC participation and FDI ... 37
Figure A3: GVC participation by major economic sectors ... 37
Figure A4: Breakdown of Intra- EAC trade for sectors of strategic interest ... 38
Figure A5: Evolution of GVC participation for the EAC ... 41
Figure A6: Female labor participation for firms that participate in GVCs vs non-GVC participating firms 42 Figure A7: Intermediate exports as percent of output (% ... 42
Annex A3: Correlates of GVC participation ... 43
Table A3: Variables and databases ... 43
Table A4: Regression estimates for Fixed effects specification ... 45
Figures
Figure 1: Evolution of complex vs simple GVC participation for African RECs ... 6
Figure 2: Global GVC participation from 1970 to 2015 ... 8
Figure 3: GVC participation by major geographic regions ... 9
Figure 4: Decomposition of GVC participation by major geographic regions (4a) and by type (4b) ... 10
Figure 5: GVC related trade volumes for African RECs and comparators, 2015, billions USD ... 12
Figure 6: GVC participation for African RECs and comparators, billions USD ... 13
Figure 7: Regional vs non-regional participation African RECS and comparators ... 14
Figure 8: GVC Participation in sectors of strategic interest: African RECs and comparators ... 15
Figure 9: Decomposition of GVC participation for EAC member states ... 16
Figure 10: EAC member GVC performance for strategic industries ... 19
Figure 11: Tariffs on intermediate goods by region ... 20
Tables Table 1 : Trends in backward and forward integration rates: African RECs and comparators ... 13
Table 2: Main Characteristics of rules of Origin: EAC and comparators ... 22
Table 3: Trade Restrictiveness index for Services ... 23
Boxes Box 1: One Network Area: East Africa ... 24
1.
Introduction
Deeper regional integration under the newly created Africa Continental Free Trade Area (AfCFTA) is the main theme of this year’s Africa Economic Outlook (AEO) of the Africa Development Bank and other reports by multilateral development banks. A key objective of the AfCFTA is to develop Regional Value Chains (RVCs) to help grow and diversify the manufacturing sector. The East African Community (EAC), arguably Africa’s most integrated Regional Economic Community (REC) is currently negotiating a revision of its Common External Tariff (CET)- the tariff structure of the EAC. There has been progress on finding consensus; negotiators have agreed to deepen the current tariff structure by moving from its current 3-band structure (0% for raw materials-15% for semi-finished products-25% for finished products) to a 4-band structure that uses the United Nations Broad Economic Classifications (BEC)-a more accurate description of differentiated products. A suppression of the Sensitive Item (SI) List (66 products exempt from the three-band tariff schedule with tariffs up to 70 per cent) and of the Duty Remissions Scheme is also on the table1.
One of the objective of revising the CET is to reduce trade costs among members and encourage supply chain trade at the REC level. Shepherd et al. (2018) evaluate the performance of the EAC by comparing its trade costs with those of other customs unions in other regions of the developing world. Taking into account pre-existing trends, they were unable to detect a structural change in broad measures of trade costs following the implementation and expansion of the customs union in 2005 or 2009 respectively. Although they show that the CET has helped harmonize trade policies among EAC members, there is little to suggest that it has supported a process of progressive liberalization and uniformization of incentives across sectors.
Their conclusion resonates in view of the current EAC negotiations where member states are contemplating the introduction a fourth tariff band to protect promising sectors and in part boost the EAC’s participation in RVCs; a move that will lead to greater distortion of the CET. Under the current CET negotiations, the following sectors have been singled out as promising for the development of RVCs through the adoption of longer tariff bands to “facilitate production processes with strong forward and backward linkages, in particular products of ‘strategic’ regional interest” [EAC 2018, p.xii]. The list of strategic sectors - cotton, textiles and apparel;
leather and footwear; ago-processing: food and beverages; wood and wood products; iron & steel; automobiles- is an ambitious list of candidate sectors to develop supply chain trade, and it raises the question
of the prospects for a sustained development of RVCs in the EAC and other African RECs.
Against this backdrop, this paper evaluates the state of the EAC’s integration into regional and global value chains and looks at the challenges the EAC faces in deepening integration into supply chain trade. Section 2 covers measures of supply chain trade and data sources used in the paper. The sections following detail three complementary approaches used to assess prospects for growth in supply chain trade.
First, we start by comparing measures of integration in supply chain trade for the EAC with those of other Regional Trade Agreements (RTAs): comparator groups in Africa are the Economic Community of West African States (ECOWAS); the Southern African Development Community (SADC); the Common Market for Eastern and Southern Africa (COMESA). Beyond Africa the two comparators are the Association for Southeast Asian Nations (ASEAN), and the Southern Common Market (MERCOSUR). The comparisons are carried out using an
1 Criteria for goods on the Sensitive (SI) list include: revenue protection; protection from unfair competition from subsidized and
counterfeit import goods; goods that fall under the imported second hand goods category; protection of agriculture production and value addition where the EAC has a comparative advantage. Duty Remissions Scheme (DRS) allows individual companies within EAC member states to apply for an exemption on a tariff if the imported good is an industrial input used for production.
updated dataset by Borin and Mancini (2019) that builds on the UNCTAD Eora database of trade in value-added over the period 1990-2015.2 Methodology and measures are presented in section 2.
These estimates, reported in sections 3-5, show that the EAC has followed worldwide trends of a rising share of trade in value-added (relative to gross trade), an indication of growing participation in GVCs. Similarly, the EAC has moved away from participation in simple global value chain trade ( trade in intermediates crossing only one border) towards more participation in complex global value chain trade (defined as trade in intermediates crossing at least two borders).3 However, compared with other RTAs, the EAC has participated
more in forward GVC than backward GVC. Moreover, the EAC has the lowest RVC participation of around 1.7% among comparator groups (the highest in ASEAN stands at 17.2%). This indicates that less than 2% of total exports from the EAC region are related to regional (EAC) value chains.
In the second approach, detailed in section 6, we focus on three obstacles to the development of RVCs: (i) relatively high tariffs on imports of intermediate goods; (ii) the need to harmonize RoO as part of implementing the AfCFTA; (iii) the high restrictions to Services trade and the high costs of connectivity. The comparisons suggest handicaps for the EAC (and other RECs) for indicators of these policy-related costs.
The third and last approach reports on panel regressions for the three GVC measures (overall, backward and forward shares of GVC-related trade) for a sample of 146 countries over the period 1995-2015. The objective is to see if there are distinct correlation patterns for policy-related (trade costs, tariffs, connectivity) and non-directly policy-related (market size, FDI, manufacturing share) indicators. Results are detailed in section 7. Section 8 concludes. An appendix with four annexes complements the main text.
2. Measures and Data
The paragraphs that follow provide an introduction to the terminology used in the literature on supply chain trade as well as the quantitative measures used in this paper; measures that carefully follow methodology developed by Borin and Mancini (2019) using the UNCTAD EORA database. Annexes A1 and A2 respectively provide more details on formulas and country composition regional groups used in the paper. Extra figures and tables are reported in annex A3.
Global value chains (GVCs): GVCs is the terminology used to describe the fragmentation of production stages across different countries where typically parts and components are produced in different countries and are then assembled sequentially along the chain or in a final location. Borin and Mancini (2019), and others, define GVC trade as “trade flowing across at least two borders”4. The literature uses four measures, of which we use
three in the paper, to characterize participation by country s in supply chain trade. Annex A1 gives the corresponding formulas for the measures below.
2 . The comparisons largely follow the presentation in the recently published World Development Report 2020: Global Value Chains:
Trading for Development with an emphasis on RVCs among RTA members.
3 This paper analyses trends in complex global value chains. After a discussion on simple vs complex global value chain participation,
the paper characterizes “complex global value chain participation” as “global value chain participation” in line with existing literature.
4 Wang et al. (2017b) distinguish between simple GVC where value-added only crosses the border once during the production
process with no indirect exports via third countries or re-exports and re-imports and complex GVCs where value-added crosses borders at least twice. The evolution of both indexes is very similar over the period 1995-2015. See World Bank (2017, figure 1). This
• Backward GVC participation (GVCbs): measures the share of country s’ exports that include value-added
previously imported from abroad. For example, if Rwanda imports maize from Uganda for the production of fortified foods for export then Rwanda is said to be engaging in backward GVC participation.
• Forward GVC participation (GVCfs): measures the share of a country’s exports that are used by an
importing country to produce for export. In the example of fortified foods exports, Uganda is engaging in forward or downward GVC participation because its exports are used as intermediates by Rwanda for the production of its fortified food exports.
• GVC participation rate (GVCs): This measure is the share of country s’ exports that either makes use of
value-added imported from another country (backward GVC participation) or is exported to another country (forward GVC participation) for further processing expressed as a share of gross exports. The participation rate is the sum of the backward (GVCbs) and the forward (GVCfs) participation rates:
𝐺𝐺𝐺𝐺𝐺𝐺𝑠𝑠= 𝐺𝐺𝐺𝐺𝐺𝐺𝑏𝑏𝑠𝑠+ 𝐺𝐺𝐺𝐺𝐺𝐺𝑓𝑓𝑠𝑠 (1)
• Length of the production chain. Changes in technologies or in consumption markets allows for finer divisions of labor measured by the average number of production stages in a production process in a region (or world) i.e. the average propagation length.5 For our purposes, what matters is the length of the
international part of supply chains captured by the number of border crossings, a measure of the importance of tariffs and transport costs. Here we only distinguish between simple GVCs where value-added crosses borders at least once and complex GVCs where value-added crosses borders at least twice but we use the more encompassing complex definition throughout our paper. Except for figure 1, all measures are for complex value chains. Also, at times we characterize the type of value chain by using measures of regional value chains to measure the extent to which the fragmentation of production is taking place at the regional level.
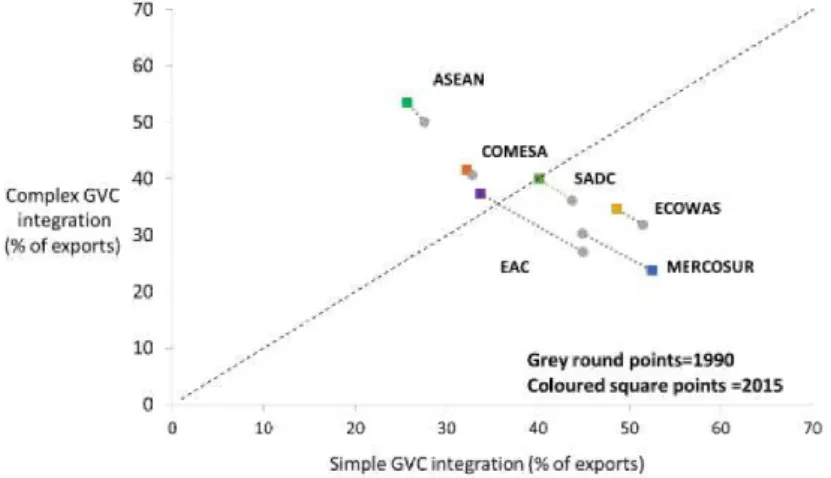
Figure 1: Evolution of complex vs simple GVC participation for African RECs
Source: Authors calculations using GVC database from Borin and Mancini (2015, 2019).
Note: GVC participation is the average of GVCs across REC members, i.e. the sum of backward and forward linkages. Simple GVCs
trade is where value-added only crosses the border once during the production process with no indirect exports via third countries or re-exports and re-imports and complex GVCs are where value-added crosses borders at least twice. Dots is the 450 line.
5 Wang et al. (2017a) define a GVC position index that measures the distance from any production stage between the final demand
and the initial factor inputs in a production line. Using measures of the length of a production chain, one can measure how a country’s position in a production network evolves. For example, for the production networks in East Asia over the period 1995-2009, China stayed in the most downstream segment of the lengthening networks (Inomata (2017) see figure 1.10). Measures in this paper do not report on the lengthening of networks over the 1990-2015 period.
In this paper, we do not measure the lengthening (shortening) of supply chains over the period. However using data from Borin and Mancini (2019) we find the changes in the measures of the average complexity of supply chains at the regional level (figure 1).6 For all RECs, except MERCOSUR, the average number of
border crossings between 1990 and 2015, an indication of more complex supply chains. The reduction in border crossings for MERCOSUR could reflect stronger agglomeration forces (information technology like robots and 3D printing) than dispersion forces (communication technology like broadband). Increases in productivity would then have dominated the fall in trade costs.
• Regional Value Chains (RVCs). For RVCs, exports are defined as exports that cross at least two borders within the same defined region. (e.g. EAC, SADC, ASEAN). In this setting, backward participation measures the regional import content of exports from a member of region A and forward participation measures the value-added in A directly exported to a member then re-exported.
To measure supply chain participation, we use GVC measures from Borin and Mancini (2019) which builds on the EORA Multi Region Input Output (MRIO) national and global input-output tables. The database covers the period 1990-2015 for 189 countries and 26 sectors. This source has the largest country coverage available and produces estimates that are globally comparable with those derived from more reliable input-output databases for a smaller sample of countries.7/8 Many papers in the GVC literature use the EORA database to
estimate the value-added embedded in a country’s exports because of a larger country and sector coverage.9
3. Trends in Global Value Chains: Comparisons by Geographic regions
Before diving into a study of the EAC, we start our analysis by taking a look at the GVC participation of Sub- Saharan Africa in relation to other major geographic regions. We then turn to comparisons across regional blocs, EAC included, as well as across sectors (sections 5 and 6).
Over the past decades, reductions in transport and communication costs along with reductions in barriers at the border (tariffs and non-tariff barriers) and behind-the-border measures (regulations, registration procedures, and other cost-raising measures) have contributed to the unbundling of production across countries at different levels of development. These developments are closely linked to the growth of Global Value Chains (GVCs).
Under GVCs, production stages are fragmented: parts and components are produced in different countries and are then assembled sequentially along the chain or in a final location. This is in contrast to the horizontal industrialization strategy followed under the inward-looking industrialization strategies of the 1960s; in all developing countries outside of East Asia the stages of production progressively took place in a single country and no intermediates were exported.
6 Annex A2 gives the definition of regional membership used in the paper.
7 Aslam et al. (2017) compare estimates from the Eora data base with those obtained from the OECD-WTO TiVA data base covering
OECD countries. Their comparisons reported in tables 7-13 at 5 year intervals over the period 1995-2010 show a reasonably close fit between estimates from the two databases.
8 Despite its coverage the EORA database can be unreliable for some countries. Annex A2 discusses criteria used to exclude
countries from the analysis because of data quality issues in EORA.
Figure 2: Global GVC participation from 1970 to 2015
Source: WDR 2020 report (p. 2) which uses data from Eora26 database and Johnson and Noguera (2017).
Figure 2 shows a steady increase in global GVC participation from 1970 to 2015. However, between 2009 and 2015, following the financial crisis of 2008, growth in overall trade was weak and GVC trade actually contracted. At the time of the crisis, world trade fell more sharply than GDP and investments needed to fuel GVCs dried up (WDR 2020). A tally of trade measures applied by countries shows that discriminatory trade measures have been growing more rapidly than liberalizing measures since the crisis and that these measures have impacted trade.10
Trade uncertainty, as measured by perceptions in the press, also increased during the period 2009-15.11 In
addition to these factors, the growth of robotics combined with the continued growth of economies like China and India where the stages of supply chain are increasingly carried in the domestic economy, has contributed to a slowdown in GVC activity12.
Figure 3 plots the GVC participation rate by major geographic regions, including SSA, in 1990 and 2015. In spite of the recent decline in GVC participation, all regions have increased GVC participation over the period 1990-2015 (all points are above the 450 line). Europe and Central Asia leads has about close to double the GVC
participation rate of Latin America and the Caribbean. Along with NAFTA, Europe and Central Asia is the region that registered the largest increase in participation. SSA has a relatively high participation rate, nearly as high as the MENA region in spite of being geographically further away from Europe, a large market for both regions.
10 See https://www.globaltradealert.org/ for the count of trade measures reported to the WTO and Evenett and Fritz (2015) on how
these measures discriminated most against LDCs.
11 See Ahir, Bloom, and Furceri (2019) “The Global Economy hit by Higher Uncertainty”, VOXEU
https://voxeu.org/article/global-economy-hit-higher-uncertainty
12 The 2008 crisis was followed by a sharp fall in the prices of primary products since 2011. Since GVC measures are calculated at
current prices, with backward linkages falling because of the price effect, overall GVC measures like those displayed in figure 2 will fall. The fall of the Euro relative to the dollar reduces the weight of the EU in the supply chains could be another factor at play in the fall shown after 2010 in figure 2.
Figure 3: GVC participation by major geographic regions
Source: Authors calculation using GVC database from Borin and Mancini (2015, 2019).
Note: GVC participation measures the share of country’s exports that either makes use of value-added imported from another country or is exported to another country for further processing. It is the share of GVC related trade for a country over its total gross exports. See Box 1 for details on GVC measures used in this paper. See Annex 1 for full countries in regional groups. Mexico is included in North America grouping. Points above the 450 indicate an increase in GVC participation.
3.2 Supply Chains: Regional (RVC) vs non-regional (GVC) and by type (backward vs. forward)
Because of transaction costs associated with border crossings, GVCs usually develop along geographically proximate production chains- regional value chains where production linkages are concentrated within a geographic region. Indeed, this geographic concentration at the REC and continental levels is the objective of the AfCFTA. East Asia and Europe are two examples of regions with strong regional value chains whereas North America tends to rely on value chain linkages outside of its region with strong connections to China and East Asia productions chains (figure 4a). Figure 3 above showed that Sub-Saharan Africa (SSA) has increased its integration into GVCs since the 1990s, but integration into African RVCs has seen little change over the period (horizontal movement in figure 4a).
Figure 4a displays three distinct patterns of supply chain trade. First is the very low growth of regional supply chain trade for SSA and MENA. Second, is the divergent experience between MENA and SSA compared to other RECs: most supply chain trade is non-regional, i.e. it takes place outside of the defined regional blocs. These patterns may reflect a weak governance and regulatory environment that hamper the development of RVCs.13 20 25 30 35 40 45 50 55 60 20 25 30 35 40 45 50 55 60 GVC Participation 2015 GVC Participation 1990 Europe & Central Asia
East Asia & Pacific NAFTA
Latin America &
Caribbean Sub -Saharan Africa
Middle East & North Africa
Figure 4: Decomposition of GVC participation by major geographic regions (4a) and by type (4b)
a. Regional vs non-regional GVC participation b. Backward vs forward GVC participation
Source: Authors calculations using GVC database from Borin and Mancini (2015, 2019). Breakdown of regional and non-regional value chain participation provided by Borin and Mancini using a novel extension of dataset available on request.
Note: GVC participation measures the share of country’s exports that either makes use of value-add imported from another country or is exported to another country for further processing. It is the share of GVC related trade for a country over its total gross exports. See Box 1 for details on GVC measures used in this paper: backward, forward, regional and non-regional value chains participation. Points above the 450 indicate an increase in GVC participation.
Third is the pattern for East Asia and Pacific and Europe and Central Asia, both already emerging hubs in 1990s with growth over 1990-2015 mostly focused on RVCs. This pattern--dubbed the ‘Asia factory’ by Baldwin (2006) --reflects several forces at work. First is strong agglomeration economies (external economies and the development of specific skills in the work force). Second is the widespread trade facilitation policies, characterized by Vezina (2014) as-a ‘race-to-the bottom’- tariff cutting in the region to attract Japanese FDI. Other trade facilitation measures include simple and transparent rules of origin to facilitate cross-border trade in the region (Cadot et al. (2010)). Third, is the importance of institutions that have high indicator values for the Asia and Pacific region. Dollar and Kidder (2017) show in a cross-section that much of the uneven participation in GVCs across countries and regions within countries is related to indicators of the quality of institutions at the national level.14
Figure 4b measures whether participation in supply chains is mostly backward (concentrated in importing foreign intermediates) or forward (mostly selling intermediates for further processing). Two stylized patterns emerge. East-Asia and Pacific and Europe and Central Asia moved towards greater intra-regional trade in parts and components where, in the language of Balwin and Forslid (2013), the ‘factory economies’ were both makers and buyers of components and parts. For this to be possible, intra-regional trade must not be interrupted along the production chain. The downstream pattern, is one in which exports of intermediates are
14 Dollar and Kidder (2017) and the WDR 2020 also report evidence from firm-level data. Patterns of revealed
comparative in manufacturing for contract-intensive activities have also been shown to be closely related to the quality of domestic institutions. Melo and Olarreaga (2020) survey the role of institutions in international trade.
1990 2015 1990 2015 1990 2000 2005 2015 1990 2015 1990 2015 1990 2015 0 10 20 30 40 50 0 10 20 30 40 50 Non-regional value chain integration (% of exports)
Regional value chain integration (% of exports)
Europe & Central Asia East Asia &
Pacific NAFTA Latin America &
Caribbean Sub-Saharan
Africa Middle East & North
destined outside the region, thereby obviating having to rely on a smooth coordination across regional partners.
We also find that in 2015, only 3.5% of total SSA exports were connected to supply chain trade within the SSA region (figure 4a.). This stands in contrast to the 25.5% RVC integration for East Asia and the Pacific-almost 8 times the integration of SSA. On the other hand, SSA is more integrated into non-regional GVCs (35.6% of exports in 2015) than all regions except the Middle East and North Africa. Europe and Central Asia is the most integrated into RVCs followed by East Asia and the Pacific.
Looking at GVC trade overall (figure 4b), SSA has the highest forward GVC participation rate- around 25% of total exports-, a share that has grown by about 4 percentage points since 1990. SSA’s forward GVC participation rate is higher than the one for East Asia and the Pacific (18.8%) and Europe and Central Asia (20.5%) (figure 4b). In contrast, the backward GVC participation rate for SSA has grown by less than 1 percentage point since 1990 and stands at around half the share of its forward GVC participation (figure 4b). Correlations in this pattern are also evident from the evolution of GVC participation in figure 11 below. These findings simply mean that a large share of SSA’s GVC integration consists of forward GVC integration: most of SSA’s GVC exports are used by the importing countries to produce final goods for export. This is to be expected since SSA countries are heavily reliant on the export of raw materials -40% of exports in 2018 (AEO, 2018). These raw material are exported to other countries for the production of higher value-added final goods; a lower share of GVC related exports involves SSA countries importing intermediates for production of final goods for exports.
4.0 Supply chains by region and by strategic sectors.
Until the launch of the AfCFTA in May 2019, much of past regional integration in Africa took place around the eight RECs recognized by the Africa Union. These RECs have been important engines of trade for the continent and will continue to be important even as African countries move towards even more continental integration. Thus, it would be useful to understand how GVC participation has evolved across these different RECs against the backdrop of differences in economic and policy contexts. We are unaware of any studies that attempt to present systematic comparisons of GVC participation across the different African RECs. Neither are there studies focussing on GVC participation measures for the EAC and its member states. Similar to our initial analysis above, we start with descriptive measures of overall GVC participation across four main African RECs and the two comparator FTAs: ASEAN and MERCOSUR. We then compare participation across sectors of strategic interest for the EAC.
4.1 A REC perspective of GVC-related Trade
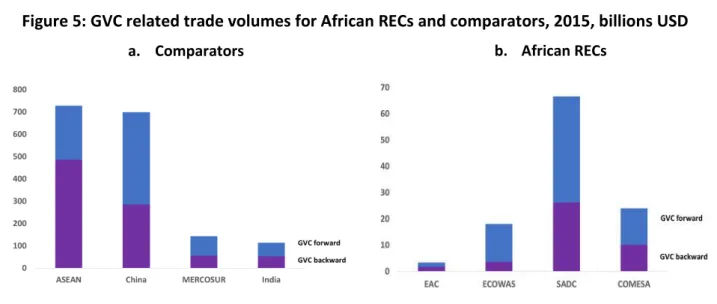
Figure 5 compares the importance of forward and backward GVC participation for the two largest developing countries relative to the largest RECs, then across African RECs. The two panels illustrate differences in orders of magnitude. In the left panel, ASEAN and MERCOSUR are compared to China and India. In the right panel, the GVC related trade volumes of the EAC is compared with three other African RECs. ASEAN and China have about ten times more GVC-related trade as the closest comparators, India and MERCOSUR with a much larger share of backward GVC participation in ASEAN than in China. MERCOSUR is comparable with SADC in terms of the volume of GVC related gross exports, probably reflecting the presence of a large economy in each trading bloc: Brazil in MERCOSUR and South Africa in SADC. Even when compared with the other African RECs, the EAC stands out as having a small volume of GVC related trade. For the four African RECs, SADC has the highest volume of GVC related exports with the EAC’s GVC trade amounting to about around 3.5 billion USD in 2015.
Figure 5: GVC related trade volumes for African RECs and comparators, 2015, billions USD
a. Comparators b. African RECs
Source: Authors calculations using GVC database from Borin and Mancini (2015, 2019).
Note: GVC participation measures the share of country’s exports that either makes use of value-add imported from another country or is exported to another country for further processing. It is the share of GVC related trade for a country over its total gross exports. See Box 1 for details on GVC measures used in this paper: backward, forward, regional and non-regional value chain participation.
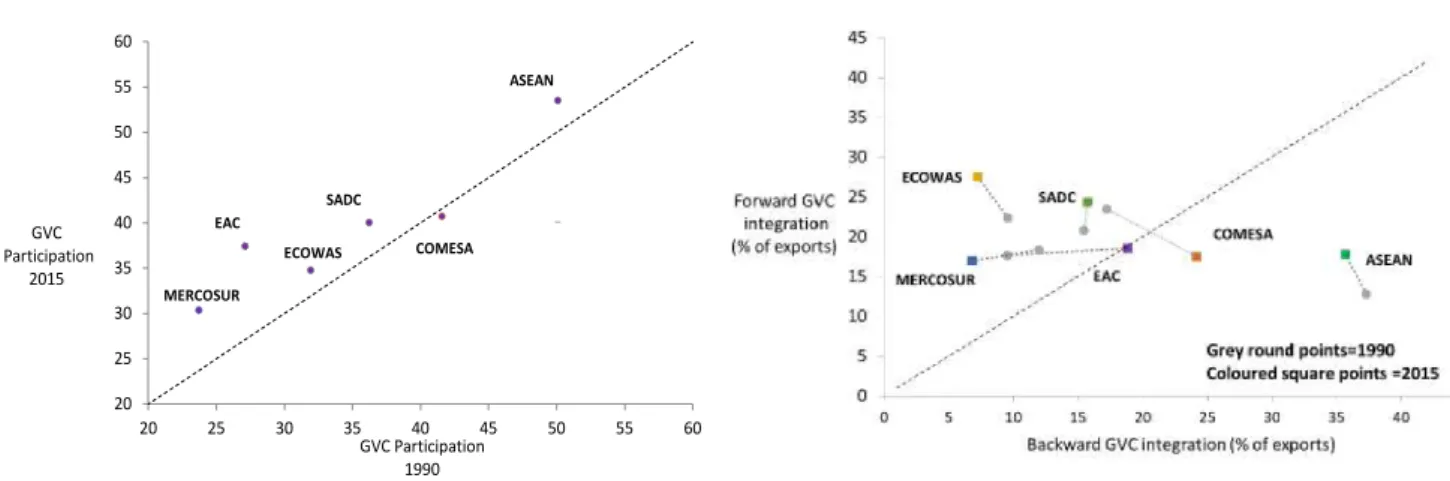
It should be noted that Figures 5a and 5b express volumes of GVC-related trade without taking the total trade volume into account. Indeed, a better way to compare across RECs is to look at GVC related trade as a share of each country’s gross exports (i.e. GVC participation measure) to detect whether, as expected, smaller economies participate more intensely in fragmentation of production (figure 6a). We see that contrary to the picture in Figure 5, EAC’s GVC participation has been rising over the period 1990-2015 even exceeding the GVC participation of ECOWAS and MERCOSUR. In fact, the EAC has experienced the largest increase in overall GVC participation over the 25-year period (figure 6a), now surpassing COMESA and closing in on SADC.15
Figure 6b shows the breakdown of GVC participation rate by forward and backward GVC participation for two periods: 1990 and 2015. We see that the EAC’s growth in GVC participation is moving towards greater “backwardness”. By 2015, the contribution of backward and forward participation was about the same. This shift towards greater backward GVC participation is compatible with the EAC’s relatively open trade regime and a simple 3-band tariff structure that does not protect activities producing intermediates as shown by the move towards greater “forwardeness” in the other African RECs. As expected, ASEAN’s backward GVC participation is much higher than that observed for all the other RECs, a reflection of ‘factory Asia’.
15 As noted earlier GVC is defined here as “complex” GVC participation i.e. trade crossing at least two borders. Figure 1 shows the
shift of most RECs towards more complex GVC participation. In this paper we analyse complex GVC participation in line with WDR 2020.
Figure 6: GVC participation for African RECs and comparators, billions USD
a. GVC participation rate, 1990 and 2015 b. Backward and forward GVC participation rate , 1990 and 2015
Source: Authors calculations using GVC database from Borin and Mancini (2015, 2019).
Note: GVC participation measures the share of country’s exports that either makes use of value-add imported from another country or is exported to another country for further processing. It is the share of GVC related trade for a country over its total gross exports. See Box 1 for details on GVC measures used in this paper: backward, forward, regional and non-regional value chain participation. Points above the 450 indicate an increase in GVC participation.
Table 1 expands on our analysis at the REC level and shows the worldwide trend on the intensity of backward and forward integration. At the world level, both measures of integration increased over the period 1990-2005 then stabilized from 1990-2005 until 2015. For the EAC (and other African RECs), trends in backward integration have followed world trends, but they have remained about a third below those for other regions and at half the rate for ASEAN, “factory Asia”. Section 4.3 shows that for the EAC, the low backward GVC related trade in the region’s exports is accounted for by Kenya, Burundi and Uganda’s low shares. On the hand, forward integration shares for the EAC follows closely world averages. This low level of backward GVC participation is compatible with the high tariff rates on intermediates observed in Africa (see figure 12) combined with high tariffs on final goods that blunt the competitiveness of final goods on world markets.
Table 1 : Trends in backward and forward integration rates: African RECs and comparators
Source: Authors calculations using GVC database from Borin and Mancini (2015, 2019).
Note: GVC participation measures the share of country’s exports that either makes use of value-add imported from another country or is exported to another country for further processing. It is the share of GVC related trade for a country over its total gross exports. See Box 1 for details on GVC measures used in this paper: backward, forward, regional and non-regional value chain participation
1990 2005 2015 Trend 1990 2005 2015 Trend World 0.24 0.29 0.28 World 0.18 0.20 0.20 China 0.05 0.18 0.14 China 0.17 0.18 0.21 India 0.08 0.15 0.16 India 0.17 0.20 0.19 ASEAN 0.37 0.40 0.36 ASEAN 0.13 0.17 0.18 EAC 0.09 0.16 0.19 EAC 0.18 0.20 0.19 ECOWAS 0.09 0.09 0.07 ECOWAS 0.22 0.25 0.28 MERCOSUR 0.07 0.12 0.12 MERCOSU 0.17 0.18 0.18 SADC 0.15 0.16 0.16 SADC 0.21 0.24 0.24 COMESA 0.24 0.20 0.17 COMESA 0.17 0.22 0.24
Backward integration Forward integration 20 25 30 35 40 45 50 55 60 20 25 30 35 40 45 50 55 60 GVC Participation 2015 GVC Participation 1990 COMESA SADC EAC MERCOSUR ECOWAS ASEAN
A comparison of backward and forward integration patterns in table 1 confirms that the EAC and other RECs have lagged in their participation in supply chain trade. Intermediate imports are destined for the production of goods sold on the domestic, rather than on foreign markets. On the export side, increased participation has followed world trends of increased trade in value-added. As mentioned above, this pattern is consistent with the high tariff rates on imports of intermediates across the region compared with global trends.
Finally, Figure 7 shows a decomposition of GVC integration by regional and non-regional GVC integration as defined by the geographic definition of the RECs (see annex A2). Three patterns stand out. First, non-regional GVC dominates RVC (all points are above the 450 line for all RECs). Second, the non-African trading blocs have
moved towards RVC supply chain trade. Third, there is a striking absence of RVC growth for all African RECs.
Figure 7: Regional vs non-regional participation African RECS and comparators
Source: Authors calculations using GVC database from Borin and Mancini (2015, 2019). Breakdown of regional and non-regional value chain participation provided by Borin and Mancini using a novel extension of dataset available on request.
Note: GVC participation measures the share of country’s exports that either makes use of value-add imported from another country or is exported to another country for further processing. It is the share of GVC related trade for a country over its total gross exports. See Box 1 for details on GVC measures used in this paper: backward, forward, regional and non-regional value chain participation. For each region and intervals of 5–6 years between 1990 and 2015, the figure plots the share of GVC trade involving only production partners in the same region in total GVC trade (regional GVC integration) against the share of GVC trade involving only partner countries outside the region in total GVC trade (non-regional GVC integration). Regional and non-regional GVC participation measures are computed as weighted averages over the countries in each group. The weights are the share of each country in the corresponding region total trade. Points above the 450 indicate an increase in GVC participation. Points above the 450 indicate an increase in GVC
participation.
Within the group of African RECs, COMESA has the highest integration into non-regional GVC participation (excluding regional value chain integration) followed by SADC and then the EAC which has been catching up with SADC. ECOWAS trails the group but individually African RECS, in 2015, exhibited a higher level of non-RVC (i.e. of non- regional GVC) integration relative to MERCOSUR and ASEAN. However, both MERCOSUR and ASEAN have higher RVC integration rates than African RECs. In fact, ASEAN’s RVC participation rate is about close to 6 times that of SADC, the African REC with the most RVC integration.
1990 2015 1990 2015 1990 2015 1990 2015 1990 2015 1990 2015 0 10 20 30 40 50 0 5 10 15 20 Non-regional Value Chain integration (% of exports)
Regional Value Chain integration (% of exports) ASEAN MERCOSUR SADC EAC COMESA ECOWAS
4.2. GVC participation patterns in sectors of strategic interest
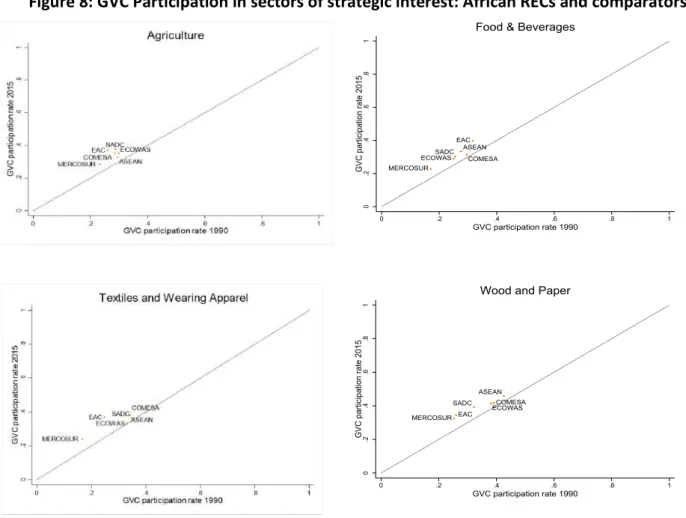
The introduction listed six strategic sectors of regional interest discussion during the ongoing CET negotiations in the EAC. Among the six identified, four correspond quite closely to the 26-sector aggregation in available in Borin and Mancini (2019). The sectors are: textiles and wearing apparel; agro-processing –food and beverages; wood and paper products and agriculture. Figure 8 shows the evolution of participation rates for the 4 African RECs and the two other comparators. On average, the African RECs are more integrated into GVCs for the agriculture and textile sector than they are for the food and beverage industry and the wood and wood products industry.
Figure 8: GVC Participation in sectors of strategic interest: African RECs and comparators
Source: Authors calculations using GVC database from Borin and Mancini (2015, 2019). Breakdown of regional and non-regional value chain participation provided by Borin and Mancini using a novel extension of dataset available on request. Points above the 450
indicate an increase in GVC participation
4.3 EAC GVC participation by member state
Figure 9 shows GVC-related trade volumes and shares in gross exports for each EAC member. Figure 9a shows that Kenya has, by far the highest volume of GVC related trade followed by Tanzania and Uganda. However, when expressed as a share of gross exports, in Figure 9b, Kenya and Uganda have the lowest shares with Rwanda showing the largest increase over the period. As to the breakdown between forward and backward shares, the least developed members- Burundi and Rwanda-have a higher share of forward rates.
EAC ASEAN MERCOSUR SADC COMESA ECOWAS 0 .2 .4 .6 .8 1 GVC participation rate 2015 0 .2 .4 .6 .8 1 GVC participation rate 1990
Food & Beverages
EAC ASEAN MERCOSUR SADC COMESA ECOWAS 0 .2 .4 .6 .8 1 GVC participation rate 2015 0 .2 .4 .6 .8 1 GVC participation rate 1990
Figure 9: Decomposition of GVC participation for EAC member states
a. GVC related trade volume, billions USD, 2015 b. GVC participation(backward and forward) as share of gross exports
Source: Authors calculations using GVC database from Borin and Mancini (2019).
Note: GVC participation measures following equations (1) - (3) GVC trade expressed as a share of total gross exports. See Box 1 for details on GVC measures used in this paper: backward, forward, regional and non-regional value chain participation.
5. A Taxonomy of GVC participation
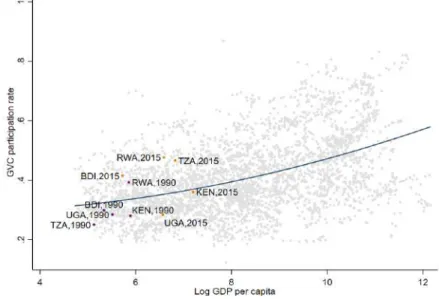
Next, we compare participation by EAC along two dimensions: per capita income and following a taxonomy of GVC participation. Starting with the comparison according to the level of development, figure 10 shows that EAC members perform quite well and tend to have relatively higher GVC participation rates at the end of period. This was not the case in 1990 when all of the EAC’s member states were participating in GVCs at rates lower than peer economies (as defined by per capita GDP in 2015). Even though the EAC as a whole has progressed since the 1990s, Uganda stands out. As of 2015, Uganda had not caught up with the GVC participation rate of its peers. In fact, both Rwanda (with a GDP per capita close to that of Uganda) and Burundi (with a substantially lower GDP per capita) have higher GVC participation than Uganda.
Figure 10: GVC participation of EAC member states compared to similar economies
0 0.5 1 1.5 2 2.5
Burundi Kenya Rwanda Tanzania Uganda GVC backward GVC forward 0 0.1 0.2 0.3 0.4 0.5 0.6 19 90 20 05 20 15 19 90 20 05 20 15 19 90 20 05 20 15 19 90 20 05 20 15 19 90 20 05 20 15
Burundi Kenya Rwanda Tanzania Uganda
GVC backward
GVC forward
Source: Authors calculations using GVC database from Borin and Mancini (2019). Breakdown of regional and non-regional value chain participation kindly provided by Borin and Mancini. Dataset available on request.
Note: GVC participation measures the share of country’s exports that either makes use of value-add imported from another country or is exported to another country for further processing. Points above the line of fit represent an increase in GVC participation.
Next, we consider the taxonomy of GVC participation proposed in the WDR 2020. The taxonomy classifies countries into three categories based on (1) the goods and services exported, (2) the extent of GVC participation, and (3); measures of innovation. 16 This classification leads to four distinct types of GVC
participation a) commodities; b) limited manufacturing; c) advanced manufacturing and services; and d) innovative activities. According to this classification, EAC countries fall in the limited commodities and limited manufacturing categories (See figure 11).
Two countries, Burundi and Uganda, remained in the same categories during the period 1990-2014. Since the 1990s, Uganda has stayed in the high commodities category and Burundi in the limited commodities classification meaning both countries have maintained a) a manufacturing share of total domestic value add of less than 60 percent and b) a backward manufacturing share of less than 20% (figure 11). However, Uganda is classified higher than Burundi because it has maintained a higher primary goods’ share of total domestic value (equal to or greater than 40%). Over the period, Kenya and Tanzania have made their way into the limited
manufacturing category, meaning both countries have higher shares of manufacturing in domestic value add
as well as higher shares of backward manufacturing. Rwanda has had more of a bumpy ride, ascending into the high commodities classification and descending back into the limited commodities category over the last decade.
Figure 11: Evolution of GVC participation for EAC members
Source: Authors presentation of GVC participation proposed in WDR 2020.
Note: The type of a country’s GVC linkages is based on the country’s extent of backward GVC participation, measured as the portion of imports embodied in manufacturing exports as a percentage of a country’s total exports, combined with the country’s sector
16 “Limited commodities: Primary goods’ share of total domestic value added in exports is equal to or greater than 20 percent but
less than 40 percent. High commodities: Primary goods’ share of total domestic value added in exports is equal to or greater than 40 percent. Limited manufacturing is the set of countries excluding low and high commodities countries and countries where the share
specialization of domestic value added in exports and measures of innovation. Countries in the commodities group have a small share of manufacturing exports and limited backward GVC integration. Their share of commodities exports can be low, medium, or high. Countries specialized in limited manufacturing GVCs engage in some manufacturing exports, often alongside commodities exports, and exhibit medium backward GVC integration. In reading the figure, there is no distinction where a country is within any one of the three categories in the figure. A dashed line (for Burundi and Uganda) indicates that the country has not changed category during the period.
Finally, Figure 12 highlights GVC participation rates for 1990 and 2015 by sector. Overall, GVC participation has increased from 1990 to 2015 for all sectors. Transport equipment is the sector with the largest increase, a reflection of increased intra-regional trade. ‘Other manufacturing’ is the second sector registering the largest increase. Metal products and Food & beverages also show a strong participation in supply chain trade.
Figure 12: Sectoral breakdown of GVC participation for EAC
Source: Authors calculations using GVC database from Borin and Mancini (2019).
Note: GVC participation measures the share of country’s exports that either makes use of value-add imported from another country or is exported to another country for further processing. See Box 1 for details on GVC measures used in this paper: backward, forward, regional and non-regional value chain participation
Next we highlight four sectors: Agriculture, Food and Beverages, Wood and Paper, and Textiles and Apparel. As mentioned in the earlier sections we picked these sectors because of their centrality in the ongoing EAC negotiations on the CET. The selection of these strategic sectors is in part based on the EAC’s Industrialization Strategy published in 2012 but also a product of evolving regional economic priorities. Figure 13 shows the performance of EAC member states in each sector alongside a few comparator countries. These comparator countries span all the comparator RECs examined in this paper including India and China.
Once again, we see Uganda underperform over the 1990-2015 period with a reduction in GVC participation for 3 out of the 4 strategic sectors; for Textiles and Wearing Apparel, Uganda’s GVC participation has not changed over the period. Tanzania clearly outperforms other EAC member states in all sectors except Agriculture. Kenya, Burundi and Rwanda have all increased their GVC participation rates over the period. However, these comparisons suggest that there is still room for increased GVC participation. Annex A7 is a supplement to figure 13 and provides a detailed breakdown of intra- EAC exports for sectors not directly covered in EORA and more in line with the EAC’s RVC strategy; sectors covered are cotton, leather, iron and
Agriculture Construction
Electrical and Machinery Financial intermediation
and Business activities Fishing
Food & Beverages
Hotels and Restraurants
Metal Products
Mining and Quarrying Other Manufacturing
Petroleum, Chemical and Non-Metallic Mineral
Products
Retail Trade Textiles and Wearing
Apparel
Transport
Transport Equipment
Wholesale Trade
Wood and Paper
0 10 20 30 40 50 60 0 10 20 30 40 50 60 GVC participation 2015 GVC participation, 1990
steel, wood and wood products17. The role of major exporter shifts depending on the sector. For leather,
Rwanda is the major supply of exports to the EAC region, in contrast, Uganda and Tanzania are major suppliers for cotton exports while Kenya, is a major exporter for iron and steel. There are also differences in which stage of processing is dominants intra-EAC exports for these sections. Annex A7 also contains a breakdown of exports by stage of processing. Trade in all four sectors is dominated by exports of raw materials and intermediate products.
Figure 10: EAC member GVC performance for strategic industries
Source: Authors calculations using GVC database from Borin and Mancini (2015, 2019).
Note: GVC participation measures the share of country’s exports that either makes use of value-add imported from another country or is exported to another country for further processing. It is the share of GVC related trade for a country over its total gross exports. See Box 1 for details on GVC measures used in this paper: backward, forward, regional and non-regional value chain participation. Points above the 450 indicate an increase in GVC participation.
17Exports value shown are from ITC and does not use the methodology by Borin and Macini (2015,2019) therefore it may not fully
capture the RVC of these sectors. However, it does represent the flow of exports and at a broad level provides insights into the
chn eth ind mus bdi ken rwa tza uga chn civ eth gha ind mus mys nga phl sen vnm 0 .2 .4 .6 .8 1 GVC participation rate 2015 0 .2 .4 .6 .8 GVC participation rate 1990 Agriculture chn eth ind mus zaf bdi ken rwa tza uga chn civ eth gha ind mus mys nga phl sen vnm zaf 0 .2 .4 .6 .8 1 GVC participation rate 2015 0 .2 .4 .6 .8 GVC participation rate 1990
Food & Beverages
chn eth ind mus zaf bdi ken rwa tza uga chn civ eth gha ind mus mys nga phl sen vnm zaf 0 .2 .4 .6 .8 1 GVC participation rate 2015 0 .2 .4 .6 .8 GVC participation rate 1990
Textiles and Wearing Apparel
chn ind mus zaf bdi ken rwa tza uga chn civ gha ind mus mys nga phl sen vnm zaf 0 .2 .4 .6 .8 1 GVC participation rate 2015 0 .2 .4 .6 .8 GVC participation rate 1990
6. Obstacles to the development of GVCs: both global and regional
Fragmentation of production within the EAC calls for seamless borders among member states. We focus on three obstacles to the development of RVCs in the EAC. All three are amenable to policy reform. First is the tariff structure—the subject of the ongoing negotiations of a new CET for the EAC. Second is the design of Rules of Origin (RoO) that govern trade intra-regional trade. These are under negotiation at the AfCFTA level. The third obstacle focuses on barriers to trade in services. This is to recognize that value-added trade requires logistics which depend on low barriers to trade in services because services are embodied in goods that are complementary to (and are embodied with) the products that are traded.
6.1 Obstacle 1: High tariffs on intermediates
Today’s relatively high tariffs on intermediates is a legacy of Africa’s (including North Africa and Sub-Saharan Africa) pursuit of an inward-looking industrialization strategy behind high trade barriers and a limited exchange of market access within the Regional Economic Communities (RECs). This strategy was ultimately abandoned, but Africa still lags in the reduction of tariff protection relative to other regions, notably for intermediate inputs (see figure 14 below). 18The average tariff on intermediates across African countries is still
around 10 percent and has fallen slowly over the last 15 years.19 This rate is still around twice the average rate
for other developing-country regions. Importantly, relative to the average rates in the other regions, the trade-weighted average is much closer to the simple average. This is prima facie indication of little substitutability towards domestic intermediates. In other words, with poor domestic substitutes, imported intermediates are “essential” so that tariffs on imported intermediates are passed down the production chain.
Figure 11: Tariffs on intermediate goods by region
Source: African Economic Outlook, Figure 3.11.
Notes: WITS. Intermediate goods defined according to BEC classification. Number of African countries: 46 for trade weighted average, 53 for simple average.
18 The shortcomings of this inward-looking industrialization strategy via vertical specialization have been amply documented since the
early 1970s and progressively accepted during the 1980s when the success of the export-led development strategies of East Asian became accepted across regions. South America started first during the 1980s ‘lost decade’ of implementation of structural adjustment reforms. By the early 1990s, South America had ‘caught up’ with East Asia (see WTO reports) with Africa following suit later on, though tariffs are still generally higher.
19 This is in sharp contrast with the experience of unilateral tariff reductions in East Asia, where a ‘race-to-the bottom’ in tariff
High tariffs are a brake on participation in GVCs. Tariffs (and other trade costs) have a higher impact on the cost of vertical specialization as compared with regular trade. Take the example in Rouzet and Miroudot (2013) where a 5% tariff is repeated across borders in a GVC with 5 stages and where an equal contribution to the value of the final good takes place at each stage. With 5 stages of production in different countries, this tariff leads to a 10.5% increase (and with 10 stages the price increase would be 25.8%). The cost of delivery to the final consumer increases exponentially with the number of stages. A second source of amplification comes from the fact that tariffs are levied on gross output and not on value-added so that even small tariffs can have a large effect on costs when FVA is high. 20 In conclusion, because intermediate goods produced along the
supply chain are, at least somewhat substitutable, the cumulative effect of cascading tariffs is bound. GVCs collapse when the gains from specialization in tasks and economies of scale become less than the tariffs collected along the supply chain. These two magnification effects of tariffs on the extent of fragmentation of production across countries also explains why the number of stages across borders is still limited.
6. 2 Obstacle 2: restrictive rules of origin (RoO)
RoO are necessary to prevent trade deflection in FTAs (arbitraging external tariff differences in FTAs) and to prevent superficial assembly. 21/22 Determining common RoO is a sticking point for the completion stage I of
the AfCFTA because of the current diversity of both regime-wide and product-specific Rules of Origin (PSRO) across the RECS. The disparity in rules across RECs described in table 3 and the protracted negotiations on the RoO for the Tripartite FTA COMESA-EAC-SADC attest to the difficulty in reaching agreement. Consider first the main origin criteria. Column 1 shows that all RECs have a value content requirement, in many cases a maximum of 35% non-originating materials. PSRO are also common, but details at the product level vary tremendously at the product level (the EU has over 500 PSRO) but the specifics are not available. For regime-wide rules, practically all RECs allow for cumulation, although the degree varies from bilateral to full which is less stringent. Tolerance and absorption rules (cols. 4 and 5) are also common, but again they are different across RECs. Likewise, the rules governing certification and verification (cols. 6-8) are very different across the RECs.
In practice, because of their complexity, RoOs have been a headache for producers and customs officials alike. For example, in the case of the EAC, in spite of revisions easing the rules to satisfy the ‘substantial transformation’ requirement for intra-EAC trade, the Common Market Scorecard (2016) reports that the number of cases of non-recognition of Certificates of Origin remained the same as in 2014.23
20 Yi (2003) was the first to note that a small decrease in tariffs can induce a tipping point at which trade in tasks takes place. Ferrantino
(2012) showed that when trade costs apply in proportion to the value of the good, the total cost of delivering it to the final consumer increases exponentially with the number of production stages.
21 Rules of Origin is a system of determining the origin of a product using an agreed set of criteria. Trade and tariff policy is implemented
based on the assigned origin of a product which has implications for the cost of a traded goods.
22 RoOs have two recognized main objectives. First, to prevent arbitraging of external tariff difference in FTAs since in the absence of
RoO, FTAs could lead to a ‘race-to-the-bottom’ as members would compete for tariff revenue by choosing to lower their MFN tariffs. Provided participants can agree on a formula to share tariff revenue among members, RoO are redundant in Customs Unions (CUs) since they share the same trade policy (CET and other border-related measures) with non-members. Second, RoOs are to prevent superficial assembly operations with little or no value-added (e.g. packaging) that would de facto extend the benefit of preferential access to non-eligible intermediate producers’ upstream assembly of those operations.
Table 2: Main Characteristics of rules of Origin: EAC and comparators
Notes: Southern African Development Community (SADC); The Economic Community of West African States (ECOWAS); East African
Community (EAC); Common Market for Eastern and Southern Africa (COMESA); Association of Southeast Asian Nations (ASEAN); Southern Common Market (MERCOSUR).
Col (1) Percentage calculations combined with change of tariff heading. Across the board (Yes, AB), not across the board (Yes, NAB). (No): criterion not applied
Col (2) Number of PSRO approximated by number of pages in appendices on legal text Col (3) Cumulation: Bilateral, diagonal, or full
Col (4) Tolerance/de minimis. Maximum percentage of non-originating materials that do not affect origin of final product (e.g. 15% in SADC)
Col (5) Absorption/roll-up. Part of non-originating materials that have acquired originating status by meeting specific manufacturing processes can maintain originating status.
Col (6): Certification by competent authorities of the exporter including designated private ones. No possibility of self-certification by any FTA here. In parenthesis: time limit in months for the importer/exporter to conclude the importation of goods under certificate followed by record keeping in years of good claiming preferential tariff treatment.
Col (7): Exemption provision on maximum amount not requiring origin certification. In parenthesis allowance for minor amendments to certificate if it contains errors
Col (8): Importing country directly controls the exporter/producer in the territory of the exporting country. [Exporting country undertakes verification upon request from the customs authority of the importing country]
Source: Cols. (1) -(5) and Tripartite from UNCTAD (2019a, chp, 2, table 2. Cols. (6) -(8). Authors’ compilation from OECD-WB database
During the AfCFTA negotiations so far, West and Central Africa have preferred general RoO. These would probably resemble those in East Asia and the Pacific (EAP). On the other side, Egypt, South Africa and Kenya pushed for Product Specific Rules of Origin with South Africa lobbying for the adoption of the SADC RoO where negotiations are at a sector or product-specific basis. Under this scenario, the political-economy mechanism would resemble that which has prevailed in the North-South agreements of the EU and the US that led to restrictive PSRO. Taking South Africa as the North, the result would be costly RoO that would “deny preferences” to the low-income partner (e.g. Ethiopia, Mozambique, Tanzania, Zambia). Moreover, when the Northern partner would have comparative advantage in the upstream capital-intensive sector like weaving in textiles and apparel or the making of engines in the automobile sector, RoOs create a captive market in the low-income partner where under bilateral cumulation assemblers have no choice but to source from the Northern partner. This denial of preferences combined with a captive market for the upstream activities of the Northern partner have been documented in the case of the EU and US FTAs.
The opacity of the current rules is evident from the description of the current rules in table 3. These rules impact the development of RVCs and also favor capture by special interest groups. The challenge facing the AfCFTA negotiations on RoO is to design rules that are simpler and easier to apply than the current ones described in table 3. These rules will satisfy no one partner, but they are necessary for the development of RVCs if this continues to be an overarching objective of the AfCFTA.
Agreement Authority certification
(validity) Average amount for exemptions Direct verification (Importer) [Indirect verification (Exporter)] Columns (1) (2) (3) (4) (5) (6) (7) (8) Ad valorem percentage Specific Manufacturing
Processes Cumulation Tolerance Absorption Verification
EAC YES(AB) N.A No explicit terms in text No No Yes(6,0) 0(No) No[Yes]
SADC No 24 Yes Yes Yes Yes(0,5) 1000(Yes) No[Yes]
ECOWAS YES(AB) N.A No explicit terms in text No No Yes(6,0) 0(No) No[Yes]
COMESA YES(NAB) 91 Yes No Yes Yes(12,5) 600(Yes) No[Yes]
TRIPARTITE No 28 Yes Yes Yes ? ? ?
ASEAN YES(AB) ? Yes Yes Yes(12,3) 200(No) No[Yes]
MERCOSUR ? Yes Yes(6,2) 0(No) No[Yes]
Main origin criteria Regime-wide rules
6.3 Obstacle 3: Services for greater Connectivity
Services are essential to the production process of goods and difficult to substitute within the production chain; high costs for services reduce a country’s competitiveness for trade in goods. So far, liberalization of trade in services in the multilateral arena has been slow with few commitments under the GATS during the Uruguay round. During 2000-15, 64 percent of the 194 preferential trade arrangements (PTAs) notified to the WTO included provisions for trade in services (Egger and Shingal (2017)). Producer services in finance, consulting, accounting and information and communications technologies have been largely covered in the RECs, but legal enforceability has been low (Melo et al. 2018). The Ad Valorem Equivalents (AVEs) of NTBs in professional services sectors are generally still high among the RECs, although compared to other RECs, they are lower for most categories of services in the EAC.
Table 3: Trade Restrictiveness index for Services
Source: Borchert, Gootiiz, and Mattoo (2014)
Notes: The database covers 103 countries that represent all regions and income groups of the world. For each country, five major services sectors are covered that encompass a total of 19 subsectors: 1) Financial services: retail banking (lending and deposit acceptance) and insurance (automobile, life and reinsurance) 2) Telecommunications: fixed-line and mobile. 3) Retail distribution 4) Transportation: air passenger (international and domestic), maritime shipping, maritime auxiliary, road trucking and railway freight 5) Professional services: accounting, auditing, and legal services (advice on foreign/international law, advice on domestic law, and court representation).
Over the past decade, EAC member states have made impressive improvements around digital connectivity as well as access. In Kenya, for example, the cost of sending remittances dropped by up to 90 percent after the introduction of M-Pesa, a digital payment system. Kenya, Uganda and Rwanda have operationalized the Electronic Cargo Tracking system (ECTS) to track cargo across internal EAC borders and in the process improve efficiency and reduce cases of corruption. Most recently, the EAC announced plans to set up an EAC Information Access Centre (IAC) to encourage digital entrepreneurship and promote business development. On e-commerce, Jumia has succeeded in operationalizing digital markets in East Africa but it has faced major challenges in ensuring quality stock of supplies as well as difficulty in keeping costs low.
Yet, according to the most recent data from the African Regional Integration index, roaming costs in the EAC are significantly higher than those for other major African RECS: ECOWAS, COMESA, and SADC where roaming costs are almost half the costs in the EAC (ARII, 2016). This problem is compounded by significant tariff differentials among EAC member states while roaming on different networks and landlocked countries pay higher fees for access to the Internet (World Bank (2018)).
SMEs are also at a disadvantage. Foster et al. (2017) report on the results of qualitative interviews with firms in three sectors (tea, tourism and business process outsourcing) in Kenya and Rwanda. They find that small
Financial Professional Retail Telecommunications Transportation EAC 26.5 46.9 15.0 30.0 25.7 COMESA 34.9 52.7 30.8 41.3 36.8 SADC 24.7 45.8 27.1 42.7 32.0 ECOWAS 19.5 52.3 5.0 30.0 20.0 ASEAN 34.9 65.8 33.3 37.5 47.9 EU 4.2 54.0 25.0 0.0 37.1 China 34.8 66 25 50 19.3 India 48.1 87.5 75 50 62.4
Financial Professional Retail Telecommunications Transportation Kenya 23.4 73.0 0.0 25.0 31.0
Tanzania 22.7 51.5 25.0 25.0 29.4
Uganda 27.7 38.0 50.0 25.0 21.1
Rwanda 19.5 32.0 0.0 75.0 36.7