READ THESE TERMS AND CONDITIONS CAREFULLY BEFORE USING THIS WEBSITE. https://nrc-publications.canada.ca/eng/copyright
Vous avez des questions? Nous pouvons vous aider. Pour communiquer directement avec un auteur, consultez la
première page de la revue dans laquelle son article a été publié afin de trouver ses coordonnées. Si vous n’arrivez pas à les repérer, communiquez avec nous à PublicationsArchive-ArchivesPublications@nrc-cnrc.gc.ca.
Questions? Contact the NRC Publications Archive team at
PublicationsArchive-ArchivesPublications@nrc-cnrc.gc.ca. If you wish to email the authors directly, please see the first page of the publication for their contact information.
NRC Publications Archive
Archives des publications du CNRC
This publication could be one of several versions: author’s original, accepted manuscript or the publisher’s version. / La version de cette publication peut être l’une des suivantes : la version prépublication de l’auteur, la version acceptée du manuscrit ou la version de l’éditeur.
Access and use of this website and the material on it are subject to the Terms and Conditions set forth at
Volume change, porosity and helium flow studies of hydrated portland
cement
Feldman, R. F.
https://publications-cnrc.canada.ca/fra/droits
L’accès à ce site Web et l’utilisation de son contenu sont assujettis aux conditions présentées dans le site LISEZ CES CONDITIONS ATTENTIVEMENT AVANT D’UTILISER CE SITE WEB.
NRC Publications Record / Notice d'Archives des publications de CNRC:
https://nrc-publications.canada.ca/eng/view/object/?id=f58d2afb-07fc-4d68-a737-003c28fd975e https://publications-cnrc.canada.ca/fra/voir/objet/?id=f58d2afb-07fc-4d68-a737-003c28fd975e
VOLUME
CHANGE,
POROSITY AND W E E I m
FLOW
S T U D I E S
OF
W m R A T m P O R T U N D
C m m T
Division of Building Re s e a r c h
National Research Council of Canada, Ottawa, Canada
A B S ITRACT
The mechanical properties of hydrated portland cement, a r e largely dependent on its pore structure. This paper describes these relationships and shows the difficulties in firmly establishing them because of (a) the instability of the m a t e r i a l under any f o r m of s t r e s s
and drying and (b) the existence of interlayer spaces which play an important p a r t in volume stability and elastic moduli of the material.
A new technique, the helium flow method, i s described, where relative changes to the dimensions of very small pores, due t o removal of sorbed water m a y be traced. This technique involves measuring the flow of helium a s a function of time into the vacated spaces of the m a t e r i a l a s water i s removed and returned. Simultaneously, volume
change, porosity and density of the m a t e r i a l ake measured a s a function of weight change.
Results obtained by this technique a r e presented showing the unique behaviour of t h i s "porosity" and how density of the sorbed water
can be computed. Results that show the effect of this "porosity" on Younggs modulus a r e a l s o presented.
Le s propri6t6 s mecaniques du ciment portland hydrat6 d6pendent en grande partie de s a porosit6. Le pr6sent article d & c r i t c e s rapports et montre quail e s t difficile de l e s determiner p r 6 c i s b e n t
B
cause de a ) l%stabilit& du m a t e r i a u vis-&-via de toute forme de contrainte et de sechage, e t b) lkexistence dvespaces intercouches qui jouent un r a l e important dans l a stabilit6 du volume e t l e s modules d q l a s t i c i t 6 duLxauteur d6crit une nouvelle m&thode, celle de la&coulement dgh61ium, qui permet de relever d e s changements relatifs de dimension de pores t r & s petits p a r suite de ltenl&vement de 18eau sorbhe. Cette m6thode comporte l a m e s u r e de l%coulement d 8 h 6 1 i m , en fonction du temps, dans l e s espaces du mat6riau l a i s s 6 s vides p a r 18en18vement de laeau, qui eat ensuite retournee. On m e s u r e en mdme temps l e change
-
ment de volume, l a porosit6 e t l a densit6 du mat6riau en fonction duchangement de poids.
L%uteur prCsente l e s r6sultats obtenus p a r cette m6thode; il montre l e comportement unique de cette "porositC'bt indique l a fason de calculer l a densite de l%au sorb6e. Des resultats montrant 18effet de cette "porosit6" s u r l e module de Young sont 6galement pr6sentCs.
2
-
F e l h a nIt is generally accepted that pore s t r u c t u r e is an irnportant p a r a m e t e r i n determining the p r o p e r t i e s of porous m a t e r i a l s . Manv techniques t o d e t e r m i n e the pore s t r u c t u r e of a solid have been used i n the past. These w e r e based l a r g e l y on s u r f a c e a r e a , p o r e volume and pore -size distribution m e a s u r e m e n t s calculated m a i n l y f r o m adsorption i s o t h e r m s o r m e r c u r y porosimetry. Theae calculations have been relatively successful on m a t e r i a l s with a stable pore
s t r u c t u r e .
This i d e a l situation, however, does not exist f o r m a n y m a t e r i a l s used in every-day life. One such m a t e r i a l i s concrete m a d e f r o m portland cement, f o r which a knowledge of the relationships between porosity and mechanical p r o p e r t i e s a r e v e r y important.
Twelve y e a r s ago a study was initiated by the Division of Building Re s e a r c h , National R e s e a r c h Council of Canada on the physical p r o p e r t i e s of hydrated portland cement and t h e i r dependence on surface chemical and pore s t r u c t u r a l considerations. E a r l y work (1) soon showed that conventional techniques would not provide a full under standing and additional techniques we r e devised.
S e v e r a l specific studies have been c a r r i e d out including sorption with s e v e r a l a d s o r b a t e s (2
-
4), and the associated length changes, porosity m e a s u r e m e n t s by s e v e r a l techniques (5), and mechanical p r o p e r t y-
porosity relationships ( 6-
9). These have been reported a s s e p a r a t e works, including the additional technique of helium flow ( 1-
1 3 ) The study i s now complete and t h i s paper incorporates the r e s u l t s f r o m the s e v e r a l works and d e s c r i b e s how the pores t r u c t u r e of hydrated portland cement h a s been elucidated. Much i s unknown about the physical p r o p e r t i e s of hydrated portland cement, due t o i t s instability under any f o r m of s t r e s s o r humidity change and t o the difficulty i n distinguishing between f o r m s of hydrates o r s t r u c t u r a l water and purely pore water. It i s possible t o obtain different r e s u l t s with different fluids when m e a s u r i n g p a r a - m e t e r s such a s porosity and surface a r e a ( 2 , 4 , 5 ) . This i s particularly t r u e when using w a t e r a s adsorbate. Since in i t s p r a c t i c a l function, hydrated portland cement h a s t o be in contact with water, m o s t m e a s u r e m e n t s have been made with it. F i g u r e 1 i l l u s t r a t e s the difference in m e a s u r i n g porosity by different fluids, methanol,
helium and w a t e r of compacts of hydrated portland cement (5). Water uniformly gives a higher porosity over the whole range of compaction p r e s s u r e s ; the values f o r methanol and helium a r e similar. Nitrogen a t liquid nitrogen t e m p e r a t u r e s gives s i m i l a r values a s with methanol and helium ( 3 ) .
h
o r d e r to m e a s u r e the p r o p e r t i e s of hydrated portland cementof hydrates will occur (14). One may also expect changes in porosity surface a r e a and other physical properties. On exposing the m a t e r i a l to water in determinations of porosity or surface a r e a , rehydration of the decomposed hydrates may occur.
There a r e two main hypotheses with regard t o the physical structure of hydrated portland cement (14, 15). Model (a) i s designed mainly to account f o r the discrepancy between surface a r e a and pore volume obtained a s described above. It postulates that hydrated portland cement has a pore structure, a large portion of which i s composed of pores with fixed narrow necks allowing water t o enter but preventing nitrogen and other fluids from doing so. Model (b) postulates a layered structure for the material. Water resides between the layers, and when the water i s removed the l a y e r s collapse. The water in this form contributes to the rigidity and stability of the system. Water may repenetrate into the system, but inert molecules do not, o r only to a limited extent. This second explanation attempts to use evidence from several types of properties to provide a scheme for the structure.
Sorption
-
Length Change-
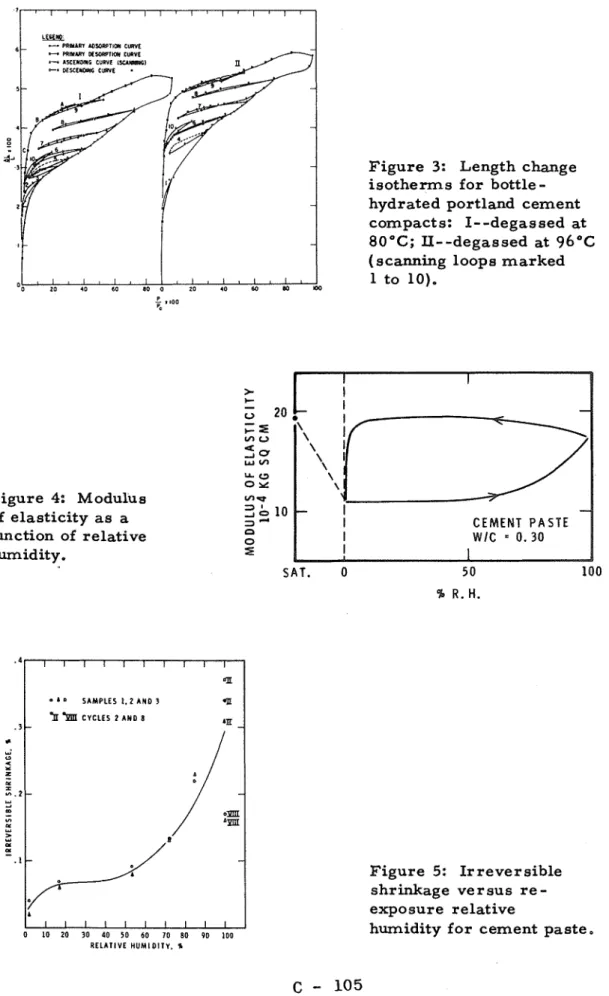
Mechanical P r o p e r t y Relationship Figures 2 and 3 show r e spectively sorption a d length-change isotherms with scanning loops (2). It was postulated that on r e-
exposure to water vapour, water re-entered the layered structure of the dried hydrated portland cement in increments. The scanning loop, a path involving lowering and raising of vapour p r e s s u r e to the original point, involved mainly water adsorbed on the external surface. Indeed a change in mechanical properties i s observed during an iso- therm. This i s shown in Figure 4, where Young modulus i s shown to increase above 50 p e r cent R.W. t o 100 p e r cent and decrease on desorption only at low humidities (6).Other f o r m s of instability exist,
If
the dried m a t e r i a l i s r e - wetted to various humidities a d redried, i t s length at the d r y state i s shorter than before. Exposure above 50 p e r centR.
W. yields agreatly increased shrinkage, a s shown in Figure 5 (161, This increased shrinkage i s not regained on rewetting. It was also found that the
m a t e r i a l responded t o s t r e s s in a similar way.
If
the m a t e r i a l i s placed under compressive s t r e s s , and s t r a i n r a t e at any time i s plotted against R. W e , a curve similar to Figure 5 i s produced.The helium flow technique (10
-
13) was developed in o r d e r to confirm some of the theories on structure. The feature of this technique i s t o indicate or follow the changes t o the structure that result from the removal o r replacement of water. It i s also able t o show quantita- tively the space occupied by the solid and the degree of collapse.0
1,000 10.000 100.000
C O M P A C T I O N P R E S S U R E , P. 5.1.
Q M E T H A N O L
Figure 2: Weight change isotherms for boetle- hydrated portland cement
compacts: I
-
-degassedat 80°C; a - - d e g a s s e d at 96°C (scanning loops
marked 1 to 10).
Figure 1 : Relationship
between porosity and compaction pressure for bottle -hydrated cement.
5
-
FeldmanFigure 4: Modulus of elasticity a s a function of relative humidity.
Figure 3: Length change isotherms for bottle
-
hydrated portland cement compacts: I- -degassed at 80°C; II--degassed at 96"C( scanning loops marked 1 to 10). C E M E N T P A S T E S A T . 0 5 0 100 Figure 5: Irreversible shrinkage versus r e - exposure relative
humidity for cement paste.
The apparatus used i s a helium Comparison Pycnometer. The sample i s placed i n a cylinder which i s the= evacuated. Helium i s allowed t o f i l l the two cylinders a t a p p r o x h a t e l y 1 atmosphere. The cylinders a r e then isolated and c o m p r e s s e d to 2 a t m o s p h e r e s by moving the r e f e r e n c e piston t o a fixed point; in doing t h i s the volume i s exactly halved =d the p r e s s u r e i s doubled. T h e s a p l e piston i s moved simultaneously with the r e f e r e n c e piston and by r e f e r e n c e t o the differential p r e s s u r e indicator, the p r e s s u r e i n the two cylinders is kept the s a m e .
h
the actual e x p e r i m e n t s the samplei s evacuated f o r 80 min, and helium is then admitted t o the sample f o r 15 sec. P r e s s u r e equalization between the c y l i n d e r s and com- p r e s s i o n t a k e s a f u r t h e r 1 m i n e 45 sec. As soon a s t h i s period i s complete a reading i s taken which gives the '9instantaneous solid volume." Subsequent t o t h i s helium flow readings begin. The sample cylinder i s always returned t o 2 a t m o s p h e r e s before a reading i s taken. Flow i s plotted a s m i l l i l i t e r s of helium a t 2 akmospheres p e r 100
gm.
of sample a s a function of t h e , usually up t o 40 hours.Samples a r e t r e a t e d under vacuum before a run i n a s e p a r a t e vacuum vessel. M t e r a p r e s c r i b e d period of t i m e d r y a i r i s allowed t o e n t e r the v e s s e l a d the saxnple i s t r a n s f e r r e d t o the pycnometerls
sample cylinder i n a gloved box d r i e d with magnesium perchlorate. The sample i s usually i n the f o r m of thin d i s c s about l m. thick and weighing about 35
p,
Runs were performed on hydrated portlandcement at 11 p e r cent
R e
H, and then d r i e d by i n c r e m e n t s f i r s t by vacuum alone and then by heat a ~ d vacuum- t o the d r i e s t state. The s a m p l e s w e r e then re-exposed t o v a r i o u s -relative hxmidities up t o 100 p e r cent R,H., but r n e a s l ~ r e m e n t s w e r e always m a d e a t 11 p e r centR.
H. s o that the quantity of adsorbed w a t e r , approximately a mono- l a y e r at 11 p e r cent R. Ii,,
might r e m a i n coanstant, -As shown by the scanning loops in Fig. 2, weight always i n c r e a s e d a f t e r each exposure cycle t o a higher humidity and baclr. t o 11 p e r cent R. H. The sample was weighed a f t e r the helium flow run which extended over 40 h r SOthe change in flow c h a r a c t e r i s t i c s could be plotted a s a function of weight change. The instrument itself exhibited a s m a l l l e a k r a t e , which had been determined before the experiments.
Porositjr m e a s u r e m e n t s ( F i g , I ) , and helium flow and density m e a s u r e m e n t s on other m a t e r i a l s show that during the initial period
of helium irmmersion, the g a s e n t e r s rapidly into a l l but the s m a l l e s t p o r e s o r spaces, It e n t e r s rapidly into the 25 A radius p o r e s of porous g l a s s but m o r e slowly into the srriall spaces of m a t e r i a l s such a s hydrated portland cement into which nitrogen o r methanol molecules cannot e n t e r . Helium flow then m e a s u r e s tge r a t e a t which t h i s g a s e n t e r s the s p a c e s with e n t r a n c e s of s i z e 4 A o r s m a l l e r . The "instanta- neous solid volumeq8 includes t h e s e s p a c e s a s solid volume.
7
-
FeldrnanResults Drying
a ) Helium flow a s a function of time
Figure
6
(10) shows typical helium flow curves for a hydrated portland cement dried from the initial 11 p e r cent R.H. condition to a condition obtained by heating finally at 140 "C f o r6
h r under vacuum. Weight losses a r e recorded from the 11 p e r cent R.H. condition. The curve for the sample at 11 p e r cent ReH.
and the subsequent two curves up to a weight l o s s of 1.92 p e r cent show rapid flow in the f i r s t 50 min. and very low flow subsequently. As water i s removed, m o r e helium can enter the sample rapidly but by 5 p e r cent weight loss the rate at 40 h r i s still significant; further weight l o s s shows a cross-over of the curves a s the initial rate decreases but m o r e helium enters by 40 hr. The curves from6
to 11 per cent weight l o s s show the rate decreasing over the previous curve at both early and late periods.The effect of the withdrawal of water m a y be m o r e clearly observed on Fig. 7 (10). Total helium inflows at 40 h r and at 50 min. a r e plotted aginst weight loss. The helium inflow at 50 mine
decreases at approximately 4 to 4.5 p e r cent weight loss, while the amount of inflow after 40 h r decreased very steeply after
6
to 6.5 p e r cent weight loss, The total inflow after a l l the moisture i s withdrawn i s le s s than that at the beginning 1 1 per centR.
H. condition.b) Solid volume and total space vacated by water on drying
A plot of the change of solid volume AV with weight loss i s plotted on Figure 8 (10); on Figure 7 ''total inflowfs at 40 h r against moisture 10s s has been plotted. Without discus sing any interpretation of the curves i t can be observed that removal of moisture leads t o a change in "solid volume" (AV) and t o a change in total helium inflow AD. Combining these, a parameter AV
-
AD i s obtained where the decrease in volume i s a negative AV and increase inflow, AD, due to increased weight l o s s i s regarded a s positive. This then accounts for the space vacated by the water if helium e n t e r s a l l the space in 40 hr. It i s again emphasized that the space referred to i s that with entrances so small that nitrogen o r methanol cannot enter.As water i s removed from the sample one would expect a continual decrease in the AV-AD vs. weight l o s s curve. In Figure 8, AV-AD i s plotted against weight loss for 10 different samples. It appears linear up to about 5.5 per cent weight l o s s yielding a straight line of slope 0.7886, the inverse of which yields a value f o r the density of the water a s 1.27 f 0.08 gm/ml. The p ~ r a m e t e r AV-AD beyond
8
-
FeldrnanF i g u r e 6: Helium flow into 0.4 water-cement r a t i o cement paste at different water contents, a s a function of time. T I M E . H O U R S W E I G H T L O S S . % O N D R Y I N G F i g u r e 7: Helium flow a t 50 m i n and 40 h r , plotted a s a function of weight l o s s f o r 0.6 water-cement r a t i o cement paste. W E I G H T LOSS. % l A W l OW D R Y I N G F i g u r e 8: Plot of
AV-AD
andAV
a s a function of weight l o s s f o r 10 different p a s t e s .9
-
F e l d m a n5.5 p e r cent weight l o s s t o approximately l 1 p e r cent shows p r a c t i c a l l y no f u r t h e r d e c r e a s e and p e r h a p s an i n c r e a s e even though t h e r a t e of change of AV i n c r e a s e s i n t h i s region (i. e. a n i n c r e a s e d shrinkage p e r unit weight l o s s ) . I n addition, i n F i g u r e 7 , t h e helium flow a t 40 h r
shows t h a t a f t e r 5.5 p e r cent weight l o s s t h e r e i s a v e r y a b r u p t
d e c r e a s e i n the amount t h a t h a s flowed into the s m a l l s p a c e s (AD). T h u s t h e d e p a r t u r e f r o m l i n e a r i t y of t h e plot i n F i g u r e 8 i s due t o t h e sudden reduction i n helium inflow.
c ) Density calculations ( 5 , 11)
Two f o r m s of density c a n be calculated f r o m the helium flow data. Using the instantaneous solid volume one obtains a value f o r d e n s i t y s i m i l a r t o t h a t obtained by methanol.
h
t h i s c a s e t h e changesa r e not m a j o r with weight l o s s , a n i n c r e a s e i n 10 t o 1 5 p e r cent being r e c o r d e d o v e r t h e f u l l r a n g e of weight l o s s .
h
t h e second calculation, t h e t o t a l volume of helium inflowa t 40 h r i s s u b t r a c t e d f r o m the instantaneous solid volume, before computation. The r e s u l t s f o r 4 different s a m p l e s a r e plotted i n F i g u r e 9 ( 5 ) . The d e n s i t y i n c r e a s e s monotonically and, a t 5 t o 6 p e r cent weight l o s s , s t a r t s t o d e c r e a s e . F o r s o m e s a m p l e s the f i n a l d e n s i t y i s lower than a t t h e i n i t i a l 11 p e r c e n t R. H. condition. Re - e x o o s u r e t o W a t e r V a ~ o u r (12)
a ) Helium inflow
F i g u r e 10 (12) i l l u s t r a t e s t h e scanning i s o t h e r m s that a r e obtained fr.om d r i e d hydrated portland cement; i n t h i s portion of the work, the underlying r e a s o n f o r t h e scanning loops w a s investigated. D r i e d s a m p l e s w e r e exposed t o 11, 32, 4 2 , 66, 84 and 100 p e r cent R.H. A f t e r e a c h e x p o s u r e , s a m p l e s w e r e r e t u r n e d t o 9 1 p e r cent R , H. ( f o r r e a s o n s d i s c u s s e d previously) w h e r e helium flow m e a s u r e m e n t s w e r e m a d e . F i g u r e 10 a l s o shows the weight gain of t h e s a m p l e s , and the length of t i m e a t e a c h condition. A f t e r the s a m p l e s w e r e exposed t o 11 p e r cent R. H., they showed a n i n c r e a s e i n t o t a l helium inflow. T h i s i n c r e a s e d with humidity and then d e c r e a s e d , a s shown i n Fig. 11 (12), f o r s e v e r a l s a m p l e s ; t o t a l helium flow i s plotted against weight change ( F i g . 11) and i n t h r e e of the f o u r c a s e s t h e r e w a s a f u r t h e r i n c r e a s e a f t e r e x p o s u r e t o 100 p e r cent R.H. T h i s final point h a s a h i g h e r t o t a l helium inflow than the i n i t i a l condition. The i n i t i a l drying and a second drying a r e a l s o plotted on t h e s e c u r v e s . b) Solid volume and density m e a s u r e m e n t s ( 1 3)
The v a r i a t i o n of volume and density (calculated d i r e c t l y f r o m the instantaneous solid volume) f o r drying, r e - e x p o s u r e t o w a t e r vapour and f i n a l drying i s p r e s e n t e d i n F i g . 12 (13). The f i r s t drying
10
-
F e l d m a n 0 1 2 3 4 5 6 7 8 9 1 0 1 1 WT. L O S S . P E R C E N T F i g u r e 10: s o r p t i o n i s o t h e r m s f o r h y d r a t e d p o r t l a n d c e m e n t p a s t e . F i g u r e 9: R e l a t i o n s h i p between d e n s i t y ( c o r r e c t e d f o r h e l i u m inflow) a n d weight l o s s f o r c e m e n t p a s t e s with w:c r a t i o s of 0 . 4 , 0 . 6 , 0 . 8 a n d 1.0.1 1
-
FeldrnanFigure 12: Plot of volume and density versus weight change on drying and wetting cycles for sample strongly dried.
Figure 1 1 : Helium inflow
at 4 0 hours v s weight change. 9 t t W E l T l N G w/c
-
0 . b 1 0 0 - O 2 n d D t Y I H G 98-
9 2-
3 8 3 9 4 0 4 1 4 2 4 3 44 4 5 9 0 92 9 1 9b 98 1 0 0 V O L U M E , .I WEIGHT, on12
-
Feldmanand r e - e x p o s u r e c u r v e s f o r m a loop; above 42 p e r cent R.H., however, this c e a s e s t o be the c a s e and t h e r e i s a c r o s s - o v e r and the final volume i s significantly l a r g e r than the starting point of the s a m e condition. The density plot a l s o f o r m s a loop; when the d r y hydrated cement i s exposed t o w a t e r vapour an i n c r e a s e in density occurs. This i s followed by a d e c r e a s e which r e s u l t s i n a final density lower than the initial m a t e r i a l .
A plot of AV-AD vs. weight change can a l s o be m a d e f o r r e - exposure and t h i s i s shown i n F i g u r e 13 (13) f o r s e v e r a l samples Up t o exposure t o 42 p e r cent R.H., where about 6.5 p e r cent weight gain i s recorded, an i n c r e a s e in AV-AD of a maximum of 2 m1/100 gm
i s recorded. Beyond t h i s point a good l i n e a r c o r r e l a t i o n i s obtained f o r the data, which yield a density of 1.20 g m / m l f o r the water.
Discussion
The two conflicting hypotheses f o r hydrated portland cement s t r u c t u r e can be e x p r e s s e d a s shown i n Fig. 14 ( 1 2): ( a ) the n a r r o w - necked fixed dimension pore and (b) the collapsing l a y e r model (14,15).
At the 11 p e r cent R. H. condition a t the s t a r t , it i s a s s u m e d that the sample p o s s e s s e s approximately a monolayer of adsorbed water. Restricted flow into the sample at t h i s stage can be described by e i t h e r model a s m o r e w a t e r i s removed. Beyond 4 p e r cent
weight l o s s , however, the flow c u r v e s show a d e c r e a s e i n initial r a t e although m o r e helium h a s flowed in a t 40 h r . This l a s t fact cannot be explained by model (a). Indeed t h e r e i s no mechanism i n this model t o account f o r a d e c r e a s e in flow r a t e o r total flow. One would expect an i n c r e a s e i n initial r a t e and quantity a s the volume of empty space i n the s m a l l p o r e s i n c r e a s e s . However the total helium inflow i s l e s s a t the f i n a l point than i t was a t the s t a r t (Figs. 6 and 7). Density calculations (Fig. 9) c o r r e c t e d f o r helium inflow a l s o show that the final density i s l e s s than that at the initial point.
Model (b) does not suffer f r o m t h i s difficulty i n explaining r e s u l t s : a s water i s removed f r o m the i n t e r l a y e r spaces m o r e space i s vacated and some collapse occurs. At f i r s t , however, the collapse i s not a s g r e a t a s the space 'created and helium inflow i n c r e a s e s i n rate. A s e n t r a n c e s t o i n t e r l a y e r s p a c e s get significantly
s m a l l e r , r a t e of flow d e c r e a s e s even though a l a r g e r volume of helium can ultimately flow in. Where the weight l o s s i s between 5 and
6
p e r cent, the r a t e of volume change with weight l o s s i n c r e a s e s significantly. Figure 7 shows how rapidly the r a t e of flow d e c r e a s e s over a v e r y s m a l l weight l o s s range. It i s believed that in this region the collapsingl a y e r s not only p r e s e n t "narrow necks" t o the helium a t o m s but a l s o long n a r r o w s l i t s which greatly r e s t r i c t flow. This i s i l l u s t r a t e d f u r t h e r i n Fig. 8 which shows that beyond 5.5 p e r cent weight l o s s
t h e r e i s no f u r t h e r d e c r e a s e in AV-AD, the i n c r e a s e i n s h r
(-AV) in t h i s region d o e s not campensate f o r the d e c r e a s e i n flow in the p a r a m e t e r AV-AD, thus s a m e space m u a t be encapsulated,
Helium inflow on r e - e x p o s u r e t o w a t e r vapour f u r t h e r enhances m o d e l (b) f o r the s t r u c t u r e of hydrated p o r t l a d cement, F i g u r e 11
shows how r e - e x p o s u r e t o various h m i d i t i e s ( m e a s u r e d at 11 p e r cent R. W. ) i n c r e a s e s helium flow into the sample, Fixed n a r r o w - necked p o r e s would p r e d i c t only a d e c r e a s e in helium flow but, 8
w a t e r m o l e c u l e s a r e reopening the l a y e r s and returning t o the entrapped space, helium inflow would i n c r e a s e . The r e e n t r y of w a t e r into the collapsed s t r u c t u r e explains the i n c r e a s e of d e n ~ i k y (Fig. 12), calculated on a n instantabl)eous solid volm-e b a s i s s The density calculated by subtracting the v o l m e of helium inflow f r o m the solid v a l m e a l s o i n c r e a s e s s h a r p l y on r e - e x p o s u r e to w & s r vapour, T h i s a l s o can only be explained by w a t e r returning to t h e i n t e r l a y e r s t r u c t u r e without an equivalent re-expansion.
The AV-AD vs. AW plot (Fig. 13) f o r r e - e x c o s u r e yields m u c h information.
If
the fixed dimension narrow-necked p o r e e x i s t s , the v o l m e of the monolayer would be (taken f r o m the f i r s t part of the curve) a m a x i m u m of about 1.75 m1/100 m, os an a r e a of l e s s than 80 m2/grn a s s m i n g a density f o r adsorbed w a t e r d1.20 gm/ml. T h i s m e a n s that a considerable portion of t h e w a t e r sorbed a t 11 p e r cent R.W. on r e - e x p o s u r e h a s gone into the s t r u c t u r e (Fig. 101,
In
the other c a s eLf
we accept the i n t e r l a y e rmodel, the f i r s t weight gain of 6 . 5 p e r cent would k ~ p P y an h ~ s s i b l y
high density of o v e r 3 gm/ml f o r the water. The only expl
then c a n e b e that the w a t e r molecules a r e m a i n l y entering %ha i n t e r -
l a y e r s t r u c t u r e that had p a r t i a l l y collapsed on d r y i n g , the helium i n 40 h r is a s yet not entering fully and i s not m e a s u r i n g the volume occupied by the water. This a l s o indicates that the molaslzysr of
adsorbed w a t e r on the open surface ( a t 11 per cent R , H , ) i s a relatively m i n o r p a r t of the 6.5 p e r cent sorbed.
Beyond the 6.5 p e r cent sorbed, the w a t e r i s completely i n t e r
-
l a y e r since a monolayer was sorbed onto the m a t e r i a l by 1 1 p e r cent R,W. The l i n e a r plot in t h i s region indicates that helium now e n t e r s fully and m e a s u r e s the volume of space within the layers, The value of 1.20 grn/ml a s density of i n t e r l a y e r w a t e r i s significant since it is a r e a l i s t i c value and shows that m o a t of the a s s m p t i o n a are approximately c o r r e c t .Values f o r p a s t e s p r e p a r e d a t w a t e r - c e m e n t r a t i o s of 0,4, obtained f r a m F i g s . 11 t o 13, enable quantitative assessments t o be made. F o r examplz, using the value of h y d r a d i c k-adiua of the p o r e s y s t e m t o be 10 A (15), the r a t i o of total volume of pose t o monolayer volume is 3.7 f o r a pore s y s t e m of spheres and
3 , 6
f o rW E I G H T G A I N S,IAW O N R r " ' - T T I N G I 6 . 0 5 . 0 E rn
5
4.0-
-
E 2 3 . 0 2.0 1 . 0 F i g u r e 14: Two different m o d e l s t o explain the helium flow c h a r a c t e r i s t i c s of the cement pastes. ( a ) model with p o r e s having n a r r o w necksand fixed dimensions (b) i n t e r
-
l a y e r model.-
W I C 0 0 . 4-
0 0 . 1 0 0 . 6 1.0-
0 . 1 2nd D R Y I N G * 1 . 0 2nd D R Y I N G-
/=: , / O-
0 0-
./.o'gO / O 0 - / - 0 , I I I I I I 0 2. 0 4.0 6 . 0 8 . 0 10.0 12.0 D e s o r p t l o n (dl D r y A d s o r p t i o n ( t l 10) S a t u r a t e d F i g u r e 13: P l o tAV-AD
a s a function of weight change f o r 4 different p a s t e s on rewetting.''KXKXKKXX
m
iiil (ill F i g u r e 15: Simplified model f o r the exit and e n t r y of w a t e r into the l a y e r s of t o b e r m o r i t e gel.15
-
F e l d m a ncylinders. The actual r a t i o f o r t h i s s y s t e m i s 1 - 3 5 ,
If
t h e space w e r e m a d e up of perfectly p a r a l l e l smooth p l a t e s with a monolayer between, the r a t i o would be 1.0. F o r c o r r u g a t e d p l a t e s , o r l a c k of perfectly p a r a l l e l alignment with kinks, it would be g r e a t e r than one. T h i s shows that the space approaches that between twoapproximately p a r a l l e l plates,
Based on r e s u l t s of variation of Youngs s modulus with
relative humidity (Fig. 4 (6)) and length change vs. weight change along the sorption i s o t h e r m a simplified s c h e m e (Fig. 1 5 (2)) w a s proposed f o r the exit and e n t r y of i n t e r l a y e r water. T h i s accounts f o r the h y s t e r e s i s i n both t h e s e plots.
Conclusions
The p o r e s t r u c t u r e of hydrated portland cement h a s p r e s e n t e d a difficult problem t o elucidate, due t o i t s instability and the p r e s e n c e of s e v e r a l types of w a t e r within the s t r u c t u r e . Many techniques have been used, which, together with the helium flow techniques, show that the s p a c e s in hydrated portland cement approximate t h e i n t e r l a y e r s p a c e s
a s in s o m e clays and not small-necked fixed-dimension p o r e s . A s water i s removed they p a r t i a l l y collapse. They re-open on r e -
exposure t o w a t e r , and the w a t e r occupying t h e s e i n t e r l a y e r positions p o s s e s s the p r o p e r t y of being able t o stiffen the m a t e r i a l and t o
i n c r e a s e YoungDs modulus. During exposure t o higher humidites, i n t e r l a y e r volume i s i n c r e a s e d leading t o dimensional instability and such phenomena a s creep.
R e f e r e n c e s
1. R.F. F e l d m a n and
P o
J . Sereda. The sorption of w a t e r on compacts of bottle-hydrated cement, J o u r n a l of Applied C h e m i s t r y , Vol. 14, No. 2, Feb. 1964, p. 87-
93.2.
R.
F. Feldman. Sorption and length change i s o t h e r m s of m e t h a n o l and w a t e r on hydrated portland cement, Fifth Intern. Syrnp. on Chem. of Cement, Tokyo, 1968.3. R. Sh. Mikhail
,
L.E.
Copeland and S. Brunauer. P o r e s t r u c t u r e s and s u r f a c e a r e a s of hardened portland cement p a s t e s by nitrogen adsorption. Can. J o u r n a l of C h e m i s t r y , 42, 426-
438 (1964). 4. R. Sh. Mikhail and S.A. Selim. Adsorption of o r g a n i c v a p o r s inrelation t o the p o r e s t r u c t u r e of hardened portland c e m e n t p a s t e s , Highway R e s e a r c h Board, Special Report No. 90, 123
-
134 (1966). 5. R.F. Feldman. Density and porosity studies of hydrated portland16
-
FeldmanP.
J.
Sereda, R.F. Feldman,E.G.
Swenson. Effect of sorbed water on some mechanical properties of hydrated cement pastes and ccrmpacts. Highway Research Board Special Report No. 90, p. 58-
73 (1966).R. A. Helmuth and
D.M.
Turk. Elastic moduli of hardened portland cement and tricalcium silicate pastes: effect of porosity. Highway Research Board S p c i a l Report No. 90, p, 135-
144 (1966).R. F. FelQnan. Some factors affecting Youngs s modulus porosity relationships of hydrated portland cement. Cement and Concrete Research, Vol. 2 No. 4, 375 (1972).
I. Soroka and
P.
J.
Sereda. The structure of cement-stone and the use of compacts a s structural models. 5th Intern. Symp. on Cement Chemistry, Tokyo, 1968.R.F. Feldman. The flow of helium into the interlayer spaces of hydrated Portland cement paste. Cement and Concrete Research, Vol. 1, No. 3, 285 (1971).
R,F. Feldman. Helium flow and density measurements on the hydrated C3S
-
water system. Cement and Concrete Research, Vol. 2, No. 1, 123 (1972).R. F. Feldman. Helium flow characteristics of rewetted specimens of dried hydrated portland cement paste. To be publiehed.
R, F. Feldman. Observation of changes to structure of hydrated portland cement on drying and rewetting by helium flow techniques. to be published.
R.F. FelQnan. Assessment of experimental evidence for models of hydrated portland cement. Highway Research Board Record NO. 370, 8
-
24 (1971)-S. Brunauer, I. Odler, and
M.
Yudedreund. The new model of hardened portland cement pasta. Highway Research Board Record NO. 328, p. 89-
107 (19.70).R.