HAL Id: hal-00296443
https://hal.archives-ouvertes.fr/hal-00296443
Submitted on 13 Feb 2008
HAL is a multi-disciplinary open access
archive for the deposit and dissemination of
sci-entific research documents, whether they are
pub-lished or not. The documents may come from
teaching and research institutions in France or
abroad, or from public or private research centers.
L’archive ouverte pluridisciplinaire HAL, est
destinée au dépôt et à la diffusion de documents
scientifiques de niveau recherche, publiés ou non,
émanant des établissements d’enseignement et de
recherche français ou étrangers, des laboratoires
publics ou privés.
over the Indian Ocean using autonomous unmanned
aerial vehicles
C. E. Corrigan, G. C. Roberts, M. V. Ramana, D. Kim, V. Ramanathan
To cite this version:
C. E. Corrigan, G. C. Roberts, M. V. Ramana, D. Kim, V. Ramanathan. Capturing vertical profiles
of aerosols and black carbon over the Indian Ocean using autonomous unmanned aerial vehicles.
Atmospheric Chemistry and Physics, European Geosciences Union, 2008, 8 (3), pp.737-747.
�hal-00296443�
www.atmos-chem-phys.net/8/737/2008/
© Author(s) 2008. This work is distributed under the Creative Commons Attribution 3.0 License.
Chemistry
and Physics
Capturing vertical profiles of aerosols and black carbon over the
Indian Ocean using autonomous unmanned aerial vehicles
C. E. Corrigan, G. C. Roberts, M. V. Ramana, D. Kim, and V. Ramanathan
Center for Atmospheric Sciences, Scripps Institution of Oceanography, University of California San Diego, 9500 Gilman Dr. m/c 0221, La Jolla, CA, 92093, USA
Received: 4 July 2007 – Published in Atmos. Chem. Phys. Discuss.: 3 August 2007 Revised: 11 January 2008 – Accepted: 13 January 2008 – Published: 13 February 2008
Abstract. Measurements of the vertical distribution of aerosol properties provide essential information for gener-ating more accurate model estimates of radiative forcing and atmospheric heating rates compared with employing re-motely sensed column averaged properties. A month long campaign over the Indian Ocean during March 2006 inves-tigated the interaction of aerosol, clouds, and radiative ef-fects. Routine vertical profiles of aerosol and water vapor were determined using autonomous unmanned aerial vehi-cles equipped with miniaturized instruments. Comparisons of these airborne instruments with established ground-based instruments and in aircraft-to-aircraft comparisons demon-strated an agreement within 10%.
Aerosol absorption optical depths measured directly using the unmanned aircraft differed from columnar AERONET sun-photometer results by only 20%. Measurements of total particle concentration, particle size distributions, aerosol ab-sorption and black carbon concentrations are presented along with the trade wind thermodynamic structure from the sur-face to 3000 m above sea level. Early March revealed a well-mixed layer up to the cloud base at 500 m above mean sea level (m a.s.l.), followed by a decrease of aerosol concen-trations with altitude. The second half of March saw the arrival of a high altitude plume existing above the mixed layer that originated from a continental source and increased aerosol concentrations by more than tenfold, yet the surface air mass showed little change in aerosol concentrations and was still predominantly influenced by marine sources. Black carbon concentrations at 1500 m above sea level increased from 70 ng/m3 to more than 800 ng/m3 with the arrival of
this polluted plume. The absorption aerosol optical depth in-creased from as low as 0.005 to as much as 0.035 over the same period. The spectral dependence of the aerosol
ab-Correspondence to: C. E. Corrigan
sorption revealed an absorption Angstrom exponent of 1.0, which is typical of an aerosol with most of its absorption attributed to black carbon and generally indicates the absorb-ing component originated from fossil fuel sources and other high-temperature combustion sources. The results indicate that surface measurements do not represent the aerosol prop-erties within the elevated layers, especially if these layers are influenced by long range transport.
1 Introduction
Detailed profiles of aerosol parameters are needed to quan-tify the effects of aerosols on radiative forcing and clouds and how these in turn influence climate and the hydrological cy-cle (Haywood and Boucher, 2000; Ramanathan et al., 2001; Kaufman et al., 2002). Measurements of the vertical distri-butions of smoke and pollution aerosols allow for a better understanding of climate forcing due to the effects of aerosol heating on the atmosphere (Menon et al., 2002; Lelieveld et al., 2002). Since recent studies have demonstrated the in-ability to compute these profiles from surface aerosol mea-surements alone, vertical profiles of aerosol optical proper-ties must be acquired to compute aerosol and cloud radiative effects throughout the entire atmospheric column. The loca-tion of aerosols within the vertical column, such as above or below the clouds, can have a significant effect on the sign of the forcing (Podgorny and Ramanathan, 2001).
Vertical profile measurements of aerosol parameters using airborne instruments offer a significant improvement for esti-mating aerosol forcing when compared with remotely sensed aerosol observations, which are normally column integrated quantities. The remote sensing (AERONET and satellite) ap-proach must make assumptions about aerosol physical, opti-cal and chemiopti-cal parameters, as well as homogeneity, which may not lead to valid results (Dubovik et al., 2000; Levy et al., 2004). Lidar measurements are able to distinguish
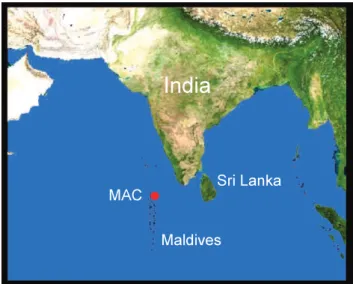
Fig. 1. Location of Republic of Maldives.
atmospheric layers and extinction values, but do not pro-vide any additional data on physical, chemical, and optical properties (Welton et al., 2002). Aircraft allow for detailed measurements to be collected at specific altitude layers of the atmosphere rather than taking a single measurement that integrates the entire column from the surface to the top of the atmosphere (remote sensing) or only collects a single re-solved parameter (Lidar).
Many past studies, such as INDOEX and ACE-Asia, have performed vertical profile measurements using multi-ple, large, heavily instrumented aircraft (Ramanathan et al., 2001; Seinfeld et al., 2004); however, this method requires significant resources and is too cost prohibitive for long-term measurements. One solution has been to employ small, single-engine, piloted aircraft or unmanned balloons to ac-complish routine long-term measurements at a reasonable cost. Small aircraft outfitted with compact instrument pack-ages have been deployed to measure dust aerosols over the Caribbean and have performed routine aerosol measurements over the Midwest for several years (Maring et al., 2003; An-drews et al., 2004). Balloon-borne aerosol instruments have collected vertical profiles of particle size distributions and number concentrations over Wyoming for the past 30 years. (Deshler et al., 2004).
Robotic aircraft offer a new technology for exploring at-mospheric measurements. Lightweight (<50 kg) unmanned aerial vehicles (UAV) provide researchers with a tool for car-rying instrumentation routinely for low cost and at a reduced risk to operators. The specific use of UAVs for climate and atmospheric sciences research have included radiation mea-surements (Stephens et al., 2000), monitoring sea surface temperature (Curry et al., 2004; Inoue et al., 2004) and me-teorological soundings (Soddell et al., 2004). Autonomous UAV (AUAV), which fly independently of a direct opera-tor by using a computer autopilot with GPS navigation, add
additional capability, including the ability to fly coordinated missions using multiple aircraft in formation or close prox-imity (Ramanathan et al., 2007b).
This study reports the routine use of lightweight AUAVs to capture the vertical distribution of aerosol properties over a site in the Indian Ocean using customized, miniaturized in-struments. The validation of these instruments is reported to ensure the veracity of the presented vertical profile data. In addition, a comparison of aerosol absorption optical depths derived using the AERONET sun photometer with in situ measurements using a miniaturized absorption photometer is discussed.
2 Experimental
2.1 Maldives AUAV campaign
This vertical profiling study was a component of a larger campaign called the Maldives Autonomous Unmanned Aerial Vehicle Campaign (MAC) that took place during March 2006 in the Republic of Maldives. Other compo-nents of the MAC project included the measurement of aerosol, cloud, and solar radiation properties with the goal of determining indirect radiative forcing (see weblink http:// www-abc-asia.ucsd.edu/MAC/secure/Index.htm). Measure-ments were conducted off the coast of the island of Han-imaadhoo (6.78 N, 73.18 E) located near the northern end of the Maldives archipelago about 500 km southwest of the southern tip on India (see Fig. 1). An established surface observatory from Project Atmospheric Brown Cloud (ABC) was utilized as an operations base and calibration facility, and provided surface observations during the MAC experi-ment. Details for this surface observatory, the Maldives Cli-mate Observatory-Hanimaadhoo (MCOH), are found in Cor-rigan et al. (2006) and in Ramana and Ramanathan (2006). The month of March was selected for measurements since the Indian Ocean monsoon changes direction from a northern (polluted) to a southern (clean) air mass origin. This twice annual transition provided an opportunity to measure under both clean and polluted conditions as presented in Corrigan et al. (2006) and Ramanathan et al. (2007a).
2.2 Aircraft platform
The Advanced Ceramics Research (ACR) Manta is a lightweight autonomous unmanned aerial vehicle (AUAV) with a maximum takeoff weight of 27 kg, a wingspan of 2.6 m and an overall length of 1.9 m. The aircraft can lift a 5 kg payload in a 12 l compartment while carrying 8 l of fuel. The cruise speed is 60 knots (110 kph or 31 m/s) and the Manta can fly up to 5 h (depending upon mission require-ments), which gives it a nominal range of 550 km. The air-craft is launched and recovered using a human pilot, but op-erates autonomously once in the air. The auto pilot system follows GPS coordinates stored within its memory and flight
Fig. 2. ACR Manta autonomous unmanned aerial vehicle carrying
aerosol-radiation payload landing in the Maldives.
paths can be updated at anytime during the mission. Figure 2 shows a Manta outfitted with radiometers and aerosol instru-mentation being launched during the MAC campaign. 2.3 Instrumentation
A suite of aerosol, cloud, and radiation instruments was developed over several years at the Scripps Institution of Oceanography for AUAV applications. This involved the repackaging and modification of some commercial instru-ments as well as the development of new designs. Specific to this work, the instrumentation included an aerosol inlet system; a meteorological package for measuring pressure, temperature, and relative humidity; a total particle counter; an optical particle counter (OPC); and an aerosol absorption photometer. Additional instruments modified for UAV de-ployment flown during the MAC missions include visible and broadband radiometers, a cloud droplet probe, and a liquid water content probe; results for these instruments are dis-cussed elsewhere (Ramana et al., 2007; Ramanathan et al., 2007b; Roberts et al., 2008). Data from all instruments were collected at a rate of 1 Hz.
The sheathed aerosol inlet probe on the front of the air-plane was designed to be isokinetic at the average air veloc-ity of 35 m/s. Losses due to impaction were estimated and verified to be less than 5% for particles with a diameter of 3 µm. After the inlet, the sampling tube diameter expanded to slow the air velocity and then passed into a four-way flow splitter. The total particle counter counted all particles larger than 10 nm diameter and was adapted from the TSI Model 3007 handheld particle counter with no alteration of the de-tection or flow control portion of the instrument. The optical particle counter (OPC) sampled the number concentration of particles in 8 size channels with diameters greater than 0.3, 0.4, 0.6, 0.8, 1.1, 1.6, 2.2, and 3 µm. The OPC was modi-fied from the MetOne model 9722 with no alteration of the detection path.
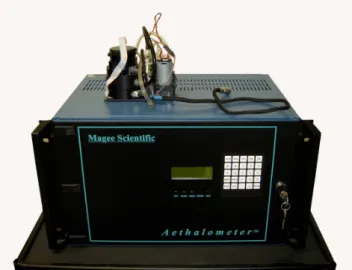
The absorption photometer instrument employed a filter-based optical transmission measurement at 3-wavelengths
Fig. 3. Absorption photometer developed for deployment on AUAVs sitting atop the original, commercial, 19′′ rack-mount in-strument (Magee Scientific AE-31 Aethalometer).
(370, 520, and 880 nm) and was adapted from a Magee Sci-entific AE-31 7-wavelength aethalometer. Figure 3 shows the UAV absorption instrument on top of the original commer-cial aethalometer instrument and demonstrates the degree of size reduction. Only a portion of the original detection cell was retained and all other components, such as packaging, tape advance system, light sources, and the embedded com-puter, were eliminated. While all seven original wavelengths could have been preserved, the removal of extra wavelengths was necessary for increasing the instruments sensitivity by a factor of 5 over the commercial version by positioning the LED light sources to shine more directly through the sam-pling spot. In addition, the electronics were improved to provide more stability in the LED luminosity and to reduce circuit noise. As with the original instrument, variations in altitude that resulted in temperature and relative humidity changes produced fluctuations in the data signal that usually required 5–10 min of equilibration time at a constant altitude for the absorption photometer to acquire a stable signal. Data from the instrument was processed using a method outlined in Arnott et al. (2005) that calibrates the instrument to out-put values as absorption coefficients. Scattering information for the correction routine was estimated using Mie theory and the size distribution data from the onboard OPC, CPC, and a ground based scanning mobility particle sizer. Values for equivalent BC concentration were derived from the ab-sorption coefficient at 880 nm using an abab-sorption cross sec-tion of 10 m2/g. The application of this correction method to aerosols sampled in this region and comparison with in-dependent BC filter measurements is discussed in detail in Corrigan et al. (2006).
The ambient temperature was measured by a 1000 ohm platinum resistive temperature detector (RTD) and had an
0 500 1000 1500 2000 2500 3000 3500 0 500 1000 1500 2000 2500 3000 3500
Total particle concentration (#/cm3)
Altitude (m)
UAV1 UAV2 Surface
Fig. 4. Comparison of total particle concentration measurements
collected from two UAVs launched within 15 min of each other on 28 March 2006. The yellow triangle was the average particle con-centration measured at the ground station during the same period.
uncertainty of 1◦C. Additional RTD devices measured the temperature within the payload bay at three locations. The ambient relative humidity was measured by a capacitive sen-sor mounted on a probe outside the aircraft body and had a resolution of 3% between 10–90% RH. The ambient air pres-sure was meapres-sured using a commercial prespres-sure transducer mounted in the payload bay and had a resolution of 2 mb. 2.4 Flight missions
Missions during the MAC experiment were typically fo-cused on stacked coordinated flights in order to capture mea-surements of cloud-aerosol-radiation interactions from be-low, within, and above the cloud. Aerosol vertical pro-files were collected during most of the 19 missions as one or more of the aircraft containing aerosol instrumentation would achieve a maximum altitude of 3000 m above mean sea level (m a.s.l.) while flying a 2 to 4 h mission. During each mission, at least one aerosol sampling aircraft would maintain level flight for 20 min at various altitudes to allow the absorption photometer to equilibrate and produce an ad-equate signal; therefore, while the total aerosol and particle size data was essentially continuous with respect to altitude, the absorption data was restricted to a limited number of se-lected altitudes.
The vertical profile data were not affected by the UAVs brief exposure to cloud droplets since cloud passes were lim-ited to when the UAVs were transiting between the mixed layer and higher altitudes. Moreover, the trade cumulus cloud fractions during the campaign were typically in the range of 3% to 12%; therefore, the UAV was unlikely to enter a cloud even during its ascent and descent. The CPC and OPC have pass-through sampling systems and are not significantly affected by limited exposure to cloud droplets. The absorption photometer was equipped with a cyclone
hav-0 500 1000 1500 2000 2500 3000 3500 0.1 1 10 100 1000 10000
Particle concentration (#/cm3, dN/dLogD)
Altitude (m)
1.3 µm 0.70 µm 0.50 µm 0.36 µm
UAV1
UAV2
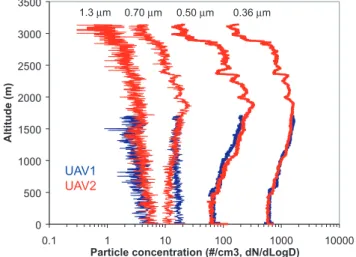
Fig. 5. Comparison of three particle size bins collected from two
UAVs launched within 15 min of each other on 23 March 2006.
ing a 5 µm diameter cut as a precaution to minimize larger cloud droplets or airborne debris from reaching the filter. The few events of suspected cloud exposure were filtered out dur-ing data analysis. These events were identified indirectly by observing aberrant or non-continuous data while the aircraft was at or passing through altitudes associated with the cloud layer.
3 Results
3.1 Validation of instrumentation and data
Instruments were validated by three separate methods to en-sure the reliability of the data. First, periodically during the MAC missions the flight instruments were directly com-pared side by side with the permanent instrumentation at the MCOH observatory. Second, identical instruments on sepa-rate aircraft were cross compared when flying within similar airspace. Third, aircraft data was compared to ground based data when flying below the mixed layer near the MCOH ob-servatory. All three methods demonstrated that the aircraft instrumentation was producing quality data as discussed be-low.
Figure 4 shows the comparison of raw data at ambient temperature and pressure from two total particle counters installed in two separate AUAV platforms launched within
10 min of one another. Both instruments traced nearly
identical altitude profiles and showed a strong correlation (R2=0.97). While the aircraft were within the mixed layer, the total particle concentration measurements determined by surface instruments at MCOH were nearly identical to the data collected by the airborne instruments (within 5%). The average ground based total particle concentration while the aircraft was within the boundary layer is shown as a yellow triangle in Fig. 4.
0 100 200 300 400 500 600 700 800 0:00 1:00 2:00 3:00 4:00 5:00 6:00 7:00 Time (hours) BC Concentration ( µ g m -3) Commercial Aethalometer UAV Aethalometer Mean difference = 0.05% RMS error = 10% 0 100 200 300 400 500 600 700 800 0:00 1:00 2:00 3:00 4:00 5:00 6:00 7:00 Time (hours) BC Concentration ( µ g m -3) Commercial Aethalometer UAV Aethalometer Mean difference = 0.05% RMS error = 1
Fig. 6. Laboratory comparison at 880 nm of the AUAV absorption
photometer with an original commercial Magee Scientific AE-31 aethalometer.
An example of the OPC data integrity is shown in Fig. 5. Four bins of raw data (concentrations for particles centered at 0.36, 0.50, 0.70 and 1.3 µm) are presented and show nearly identical results between two separate aircraft launched ten minutes apart. Post processing of all of the OPC data re-vealed that temperature and humidity artifacts within the in-strument were sometimes an issue in obtaining accurate size information, primarily while changing altitudes faster than the payload could thermally equilibrate to near ambient tem-peratures. The separation between instrument readings for the 0.70 µm channel while the aircraft was below the bound-ary layer shows a commonplace temperature/humidity arti-fact associated with the aircraft descending quickly from the cooler altitudes. These measurement artifacts are common to all size instruments when measuring hygroscopically active particles and are not specific to UAV measurements. When sampling in dry conditions (<50% humidity) or at relatively constant temperature and humidity, particle size data is free of these aberrations.
The absorption photometer was initially compared to
com-mercial Magee AE-31 aethalometers for validation. One
such comparison is shown in Fig. 6 for a ten-minute averaged black carbon concentration data at 880 nm and demonstrates that the modifications made to the UAV instrument did not change the signal. The mean difference between the two sig-nals during the 4 h run was <0.1% and the RMS error was 10%.
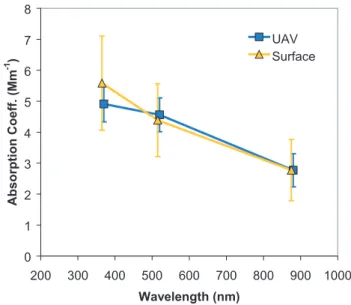
Further field validation of the absorption photometer is presented in Fig. 7 and shows that averaged spectral absorp-tion measurements taken by a commercial aethalometer on the surface agreed within 10% of the airborne absorption photometer measurements taken below the cloud base. The error bars are standard deviations of the measurements col-lected during the time period and illustrate the improved sig-nal to noise ratio of the airborne instrument.
0 1 2 3 4 5 6 7 8 200 300 400 500 600 700 800 900 1000 Wavelength (nm) Absorption Coeff. (Mm -1 ) UAV Surface
Fig. 7. Comparison of spectral absorption data from a
commer-cial aethalometer located on the ground with an airborne absorp-tion photometer flying within the mixed layer (<400 m a.s.l.) on 23 March 2006.
3.2 Vertical profile measurements of total particle concen-tration
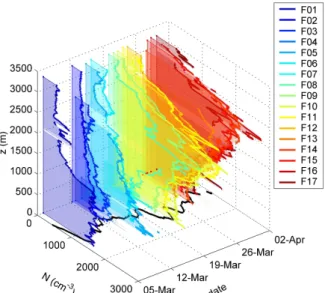
Vertical distributions of total particle concentration were collected during nearly every mission up to an altitude of 3000 m a.s.l. Total particle concentration vertical distribu-tions for the entire MAC study are shown in Fig. 8. The black line in the zero altitude plane shows the surface con-centration observed at MCOH. A relatively constant aerosol concentration was observed on most days from the ground up to an altitude of approximately 500 m a.s.l., which corre-sponded to the typical cloud base. The uniform total aerosol concentrations routinely observed below the cloud base indi-cate that the mixed layer was well mixed throughout the en-tire month of March. Once above the cloud layer, the aerosol concentration diminished during the first half of March. Con-versely, the second half of March showed a dramatic increase in particulate concentrations above the mixed layer. After the onset of this high altitude aerosol plume on 20 March, the maximum aerosol concentration in the vertical column was located between 1500 and 2400 m a.s.l. and dropped off significantly by 3000 m a.s.l. The high altitude plume oc-curring in the last part of March showed concentrations had increased by as much as 10 times. Concentrations at altitude were between 1.3 to 2.8 times higher than those observed at the surface level. The existence of this aerosol layer was essentially undetected by the surface instruments; however, the surface concentrations did register a slight increase in av-erage total particle concentration of around 20% that was slightly correlated to the plume concentration (R2=0.42), which suggests that some small exchange across the mixed
Fig. 8. Total particle concentration by altitude during MAC
experi-ment (March 2006). The legend identifies flight numbers. The solid black line in the zero altitude plane shows the total particle concen-tration collected at the surface station.
layer was occurring. In addition, the accumulation mode (0.1 µm>D>1 µm) increased in proportion to the fine mode (D<0.1 µm), but this change would not have been associated with an overhead plume if profiling had not been performed.
3.3 Atmospheric layers and thermodynamic structure
The vertical profiles of total particle concentration can be used to identify atmospheric layers, especially when com-bined with information on the thermodynamic structure. Fig-ure 9a shows the total particle concentration altitude profile and Fig. 9b shows the equivalent potential temperature (2E) profile and saturated equivalent potential temperature (2ES) profile of the ascent phase for the mission flown on 28 March 2006. The 2E profile exhibits very little change from 100 to 500 m a.s.l. suggesting a well-mixed layer existed up to the cloud base. Likewise, the total particle concentration remains fairly consistent below the cloud base. Above the mixed layer (500 m a.s.l.), a slight increase in aerosol con-centration occurs with altitude until reaching the cloud top just above 1000 m a.s.l. The local minimum in 2ES can be used as an indicator for the cloud top (Betts and Albrecht, 1987). Above the cloud top, 2E drops off slowly with alti-tude until a trade wind inversion at 2700 m a.s.l. when 2E reaches a minimum. The aerosol concentration reduces dra-matically above 2700 m a.s.l. The aerosol concentration pro-file reflects the thermodynamic structure as layers tend to stratify in zones of stability.
3.4 Air mass sources
The existence of high particle concentrations above the mixed layer indicates the existence of long range transport. Figure 10 presents five-day wind back trajectories accord-ing to altitude for the northern Maldives obtained from the NOAA/NCEP Hysplit model (Draxler and Hess, 1998). The back trajectories clearly show the changes in air mass origin between the pre- and post-plume periods of the campaign. Winds arriving at Hanimaadhoo Island for all altitudes up to 3000 m a.s.l. originated from the ocean during early March, which is represented by the 6 March trajectory. None of the air masses had passed near land in the past 5 days; there-fore, aerosol concentrations remained low and were gener-ally confined below the mixed layer. Wind trajectories from two selected days during the plume period, 23 March and 29 March, reveal that winds above 1000 m a.s.l. originate from the Asian and African continents. While over land, the air mass picked up dust and anthropogenic pollution including black carbon. Air sampled in the mixed layer over the Mal-dives still mainly originated from marine sources, even dur-ing the post-plume period. Consequently, the surface mea-surements at the MCOH ground station did not accurately reflect the aerosol properties existing above the mixed layer. The presence of these vertical layers with different air mass sources demonstrate the importance of sampling throughout the vertical column as opposed to simply extrapolating from surface measurements.
Additional evidence supporting the back trajectory analy-sis and showing the source of the long-range pollution plume can be inferred from regional AOD images obtained from the MODIS instrument onboard the NASA Terra satellite (Kauf-man et al., 2002). Figure 11a shows the aerosol optical depth (AOD) at 550 nm for India and the Maldives averaged over the period from 6 to 12 March 2006. Very little pollution from the continent was transported across the ocean to the Maldives during the early part of the month. In contrast, the AOD image averaged from 23 to 29 March 2006 shown in Fig. 11b reveals a large plume coming off of India and en-gulfing the northern Maldives.
3.5 Vertical profiles of particle size distributions
Selected particle size distribution vertical profiles obtained from the OPC during the MAC campaign are shown in Fig. 12a and b and illustrate that the differences between the pre- and post-plume aerosol profiles are similar to trends seen in the total particle concentration. The size distribu-tion profile from the pre-plume period on 6 March shows that all the particle size bins decrease continuously above the mixed layer at 500 m a.s.l. For the polluted period (represented by 29 March), the continental plume is ap-parent above 800 m a.s.l. The concentrations of each size bin in this plume were dramatically increased as compared to the aerosol below the mixed layer. The accumulation
0 500 1000 1500 2000 2500 3000 3500 300 320 340 360 380 400 Temperature (K) 0 500 1000 1500 2000 2500 3000 3500 0 1000 2000 3000 Total Particle Concentration (#/cm3)
Altitude (m) a b ΘE ΘES 0 500 1000 1500 2000 2500 3000 3500 300 320 340 360 380 400 Temperature (K) 0 500 1000 1500 2000 2500 3000 3500 0 1000 2000 3000 Total Particle Concentration (#/cm3)
Altitude (m) a b ΘE ΘES ΘE ΘES
Fig. 9. Total particle concentration, equivalent potential temperature (2E)and saturated equivalent potential temperature (2ES)versus altitude for flight on 28 March 2006.
Fig. 10. Five-day wind back trajectories over the Maldives from NOAA/NCEP reanalysis for 6, 23, and 29 March 2006.
mode (0.1<D<1 µm) aerosol number concentration in-creased with respect to the ultrafine mode (D<0.1 µm) at altitude and this change was seen partially at the surface as well due to mixing above the boundary layer (see Sect. 3.2). This shift in aerosol size was likely due to mineral dust parti-cles carried from the Asian and African continents as shown in the back trajectories. Clearly, considerable limitations ex-ist when trying to predict particle size dex-istribution throughout the entire column when using only the near-surface data.
3.6 Vertical profiles of black carbon
Black carbon concentrations were derived from the aerosol absorption photometer using the procedures outlined in Sect. 2.3. Since the instrument required more than 20 min to produce clear data with each change of altitude due to temperature and humidity variations, only a limited number of data points were generated during each flight. Moreover, only six missions successfully profiled BC at more than a few altitudes due to other mission requirements.
(a)
a
a
(b)b
b
Fig. 11. Mean aerosol optical depth (AOD) at 550 nm over Indian subcontinent from (a) 6 to 12 March 2006 and (b) 23 to 29 March 2006.
(a) 6 March (b) 29 March
Fig. 12. Representative particle size distribution altitude profiles for (a) 6 March 2006 – marine and (b) 29 March – continental influenced
air masses.
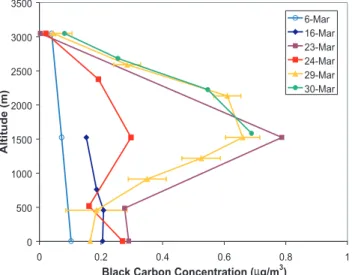
Figure 13 presents the black carbon concentrations at mea-sured altitudes for several flights. The data points shown in the plot for the surface altitudes were obtained from the aethalometer located at MCOH. The error bars, shown for only the 29 March flight in order to maintain legibility, are the standard deviation of the measurements and are attributed to instrument noise, changes in temperature and RH, and variations in the aerosol concentration during the measure-ment period (i.e. 15 min). The flights during the pre-plume periods (6 and 16 March) show that the black carbon concen-tration diminished above the mixed layer. The flights during the post-plume period (23, 24, 29 March) clearly show the in-creased presence of black carbon in the polluted plume and correspond to the trends observed in the total particle con-centration and the particle size distributions. Black carbon
concentrations at an altitude of 1500 m a.s.l. increased from 70 ng/m3to more than 800 ng/m3, a factor of 10 fold, with the arrival of the polluted plume. The origin of this black carbon can be deduced from the back trajectories in Fig. 10 which suggest that the black carbon was picked up by the high altitude jet over India as surface air was swept upwards due to thermal convection. The high concentrations of black carbon in the Maldives above 500 m a.s.l. were not reflected in the surface measurements due to limited exchange with the mixed layer. The presence of significant quantities of absorb-ing material at altitude likely had an effect on the heatabsorb-ing of specific atmospheric layers that could not be resolved using only surface based instruments (Ramana and Ramanathan, 2006).
0 500 1000 1500 2000 2500 3000 3500 0 0.2 0.4 0.6 0.8 1
Black Carbon Concentration (µg/m3)
Altitude (m) 6-Mar 16-Mar 23-Mar 24-Mar 29-Mar 30-Mar
Fig. 13. Black carbon concentration altitude profiles during MAC
experiment (March 2006). Error bars are only shown for a single flight to keep the plot legible and are representative of all flights.
3.7 Vertical profiles of aerosol absorption optical depth To calculate the solar absorption in an aerosol layer, the absorbing nature of the aerosol must be quantified (Ra-manathan et al., 2007b). A parameter that quantifies the col-umn integrated absorption resulting from black carbon and other species is termed the aerosol absorption optical depth, AODabs. Two independent methods were used to measure the
AODabsduring the campaign: (1) integrating values from
di-rect absorption measurements taken at different altitudes by the airborne aerosol absorption photometer, and (2) ground-based remote sensing by the AERONET (sun photometer) stationed at MCOH (Holben et al., 1998; Dubovik et al., 2002). Since AERONET produces only a columnar mea-surement and most aerosol meamea-surements are restricted to the surface, the validation of AERONET derived single scat-ter albedo has been limited. Consequently, altitude resolved absorption coefficients obtained from the airborne absorp-tion photometer were used to find closure with measurements taken by the AERONET instrument. Figure 14 illustrates how absorption measurements taken at a few altitudes using the UAVs were converted to a continuous absorption vertical profile by scaling the absorption measurements to the total particle vertical distribution. Missions with detailed altitude measurements of absorption coefficient justify the assump-tion of a high correlaassump-tion between the total particle concen-tration and the absorption coefficient at this location. The absorption profile was then integrated from the surface to 3000 m altitude to arrive at the AODabs, which ranged from
values as small as 0.005 during the clean period to as much as 0.035 with the polluted plume. Figure 15 shows the com-parison of the AODabs observed using the UAV data with
columnar measurements collected by AERONET. The two
0 5 10 15 0 500 1000 1500 2000 2500 3000 3500 Abs at 520nm (Mm−1) Measured Abs Aerosol Conc Fitted Abs 0 500 1000 1500 2000 2500 3000 0 500 1000 1500 2000 2500 3000 3500 Aerosol concentration (#/cm3) Altitude (m)
Fig. 14. Estimate of continuous absorption coefficient vertical
pro-file derived from limited point measurements fitted to the continu-ous total particle concentration profile on 28 March 2006.
methods show good agreement with the UAV data consis-tently lower (mean bias of 19%) than the AERONET values most likely due to the existence of gas species that absorb in the visible range, such as NO2, and due to aerosols
exist-ing above the UAV measurement ceilexist-ing of 3000 m. In ad-dition, the AERONET algorithm makes certain assumptions about aerosol physical and optical properties that don’t nec-essarily reflect the true aerosol (Dubovik et al., 2000). More-over, some uncharacterized systematic error may be resulting from the algorithm used for retrieving absorption coefficients from the absorption photometer measurements (Arnott et al., 2005) as well as the fitting method used here to create an aerosol absorption vertical profile. The cross in the figure shows the error bars for each axis. The scatter of the data is partly due to the uncertainties in parameters used to calculate the absorption optical depths as well as variations in aerosols and other absorbing species during the 3 to 4 h missions.
The wavelength dependence of the AODabs (closely
re-lated to Angstrom exponent for absorption coefficient) for both the UAV method and AERONET on 28 March 2006 is shown in Fig. 16. Both data sets show agreement within the measurement errors and demonstrate closure between the direct measurements of the aerosol layer and the surface columnar measurements. The Angstrom exponents derived
0 0.01 0.02 0.03 0.04 0 0.005 0.01 0.015 0.02 0.025 0.03 0.035 0.04
Abs AOD (UAV)
Abs AOD (AERONET)
Mean difference= 19.2%
Fig. 15. Comparison of absorption AOD derived from both UAV
absorption photometer and AERONET measurements. The esti-mated error for the data sets are given by the cross symbol.
from the slope using all the data showed a value of 1.06 and 0.70 for the UAV and AERONET measurements, re-spectively. The difference in the Angstrom exponents from each method are primarily influenced by the uneven values at longer wavelengths in the AERONET data. When using only data for wavelengths less than 700 nm, the agreement be-tween the Angstrom exponents improves as the AERONET value becomes 0.90. The Angstrom exponent provides in-formation on the contribution of black carbon and other ab-sorbing species to the total absorption. Since dust and or-ganic compounds tend to preferentially absorb light at shorter wavelengths as compared to the broadband absorption char-acteristics of black carbon, a larger Angstrom exponent for the AODabs indicates a larger proportion of absorption
at-tributed to organics and dust (Bergstrom et al., 2004). A mea-sured Angstrom exponent of 1.0 indicates that the absorbing component of the aerosol was composed primarily of black carbon. Since dust and organic components have only a small contribution to the absorption, the absorbing component of the aerosol most likely originated from the high-temperature combustion of fuels, such as diesel, coal (i.e. fossil fuels) or possibly high-efficiency biomass combustion (Bond et al., 1999; Kirschstetter et al., 2004).
4 Conclusions
Vertical profile measurements of aerosol and meteorologi-cal parameters were conducted over the Maldives in the In-dian Ocean using small, lightweight AUAVs equipped with miniaturized instrumentation. All miniaturized instrumen-tation compared well with surface measurements when fly-ing within the mixed layer. Comparison of aerosol
absorp-400 600 800 1000 1200 0.01 0.015 0.02 0.025 0.03 0.035 0.04 Abs AOD Wavelength (nm) UAV (α = 1.066) AERONET (α = 0.699) λ < 700nm (α = 0.904)
Fig. 16. Comparison of spectral dependence of absorption AOD
de-rived from both UAV absorption photometer and AERONET mea-surements.
tion optical depth derived from both AERONET and air-craft flights indicated a 20% difference, which is attributed to additional absorbing constituents contained in the colum-nar measurements. The first half of March 2006 showed total particle concentration, size distributions, aerosol absorption and black carbon concentrations diminishing with altitude once above the well-mixed surface layer. After 20 March 2006, a large aerosol plume was observed above the mixed layer with the peak concentration located near 2000 m a.s.l. A common assumption persists that the mixed layer has a uniform concentration of constituents which decrease ex-ponentially once above the mixed layer, but these observa-tions demonstrate that multiple layers containing high con-centrations of pollution species may exist above the mixed layer. Five-day back trajectories indicate that during the pre-plume period the high altitude aerosol originated from ma-rine sources, yet the polluted plume seen in later March had been carried from Asia and Africa. Spectral dependence of the aerosol absorption shows an absorption Angstrom ex-ponent of 1.0, which indicates that the absorption is over-whelmingly from black carbon arising from high temperature combustion (i.e. fossil fuels). The results suggest that surface and remote measurements often do not reflect the aerosol be-havior throughout the vertical column. Consequently, accu-rate measurements of the vertical distribution of aerosols and their optical properties offer a more precise understanding of the contribution to heating and cooling of specific atmo-spheric layers.
Acknowledgements. This research was supported by NOAA under the grant NOAA/NA17RJ1231, NSF under the grant ATM05-42531 and the Vetlesen Foundation. Permission and assistance for use of Maldivian airspace and facilities was provided by the Ministry of Environment, Energy and Water, Government of Maldives. We are grateful to the people of Hanimaadhoo, the Hanimaadhoo Island Chief, and Island Aviation for their assistance and generosity.
Edited by: G. McFiggans
References
Arnott, W. P., Hamasha, K., Moosmuller, H., Sheridan, P. J., and Ogren, J. A.: Towards aerosol light-absorption measurements with a 7-wavelength aethalometer: Evaluation with a photoa-coustic instrument and 3-wavelength nephelometer, Aerosol Sci. Technol., 39(1), 17–29, 2005.
Andrews, E., Sheridan, P. J., Ogren, J. A., and Ferrare, R.: In situ aerosol profiles over the Southern Great Plains cloud and radia-tion test bed site: 1. Aerosol optical properties, J. Geophys. Res., 109, D06208, doi:10.1029/2003JD004025, 2004.
Bergstrom, R. W., Pilewskie, P., Pommier, J., Rabbette, M., Rus-sell, P. B., Schmid, B., Redemann, J., Higurashi, A., Naka-jima, T., and Quinn, P. K.: Spectral absorption of solar radiation by aerosols during ACE-Asia, J. Geophys. Res., 109, D19S15, doi:10.1029/2003JD004467, 2003.
Betts, A. K. and Albrecht, B. A.: Conserved variable analysis of the convective boundary-layer thermodynamic structure over the tropical oceans, J. Atmos. Sci., 44(1), 83–99, 1987.
Bond, T. C., Bussemer, M., Wehner, B., Keller, S., Charlson, R. J., and Heintzenberg, J.: Light absorption by primary particle emissions from a lignite burning plant, Environ. Sci. Technol., 33(21), 3887–3891, 1999.
Corrigan, C. E., Ramanathan, V., and Schauer, J. J.: Im-pact of monsoon transitions on the physical and optical properties of aerosols, J. Geophys. Res., 111, D18208, doi:10.1029/2005JD006370, 2006.
Curry, J. A., Maslanik, J., Holland, G., and Pinto, J.: Applications of Aerosondes in the Arctic, B. Am. Meteorol. Soc., 85(12), 1855– 1861, 2004.
Draxler, R. R. and Hess, G. D.: An overview of the HYSPLIT 4 modeling system for trajectories, dispersion, and deposition, Aust. Meteorol. Mag., 47, 295–308, 1998.
Dubovik, O., Smirnov, A., Holben, B. N., King, M. D., Kauf-man, Y. J., Eck, T. F., and Slutsker, I.: Accuracy assessments of aerosol optical properties retrieved from Aerosol Robotic Net-work (AERONET) Sun and sky radiance measurements, J. Geo-phys. Res., 105(D8), 9791–9806, 2000.
Dubovik, O. and King, M. D.: A flexible inversion algorithm for retrieval of aerosol optical properties from Sun and sky radi-ance measurements, J. Geophys. Res., 105(D16), 20 673–20 696, 2000.
Haywood, J. M. and Boucher, O.: Estimates of the direct and in-direct radiative forcing due to tropospheric aerosols: A review, Rev. Geophys., 38, 513–543, 2000.
Holben, B. N., Eck, T. F., Slutsker, I., Tanr´e, D., Buis, J. P., Set-zer, A., Vermote, E., Reagan, J. A., Kaufman, Y. J., Nakajima, T., Lavenu, F., Jankowiak, I., and Smirnov, A.: AERONET – A federated instrument network and data archive for aerosol char-acterization, Rem. Sens. Environ., 66, 1–16, 1998.
Inoue, J. and Curry, J. A.: Application of Aerosondes to high-resolution observations of sea surface temperature over Barrow Canyon, Geopys. Res. Lett., 31(14), L14312, doi:10.1029/2004GL020336, 2004.
Kaufman, Y. J., Tanr´e, D., and Boucher, O.: A satellite view of aerosols in the climate system, Nature, 419, 215–223, 2002. Kirchstetter, T. W., Novakov, T., and Hobbs, P. V.: Evidence that
the spectral dependence of light absorption by aerosols is af-fected by organic carbon, J. Geophys. Res., 109(D21), D21208, doi:10.1029/2004JD004999, 2004.
Lelieveld, J., Berresheim, H., Borrmann, S., Crutzen, P. J., et al.: Global air pollution crossroads over the Mediterranean, Science, 298, 794–799, 2002.
Levy, R. C., Remer, L. A., and Kaufman, Y. J.: Effects of neglect-ing polarization on the MODIS aerosol retrieval over land, IEEE Trans. Geosci. Remote Sens., 42(11), 2576–2583, 2004. Maring, H., Savioe, D. L., Izaguirre, M. A., Custals, L., and Reid, J.
S.: Vertical distributions of dust and sea-salt aerosols over Puerto Rico during PRIDE measured from a light aircraft, J. Geophys. Res., 108(D19), 8587, doi:10.1029/2002JD002544, 2003. Menon, S., Hansen, J., Nazarenko, L., and Luo, Y.: Climate effects
of black carbon aerosols in China and India, Science, 297, 2250– 2253, 2002.
Podgorny, I. A. and Ramanathan, V.: A modeling study of the direct effect of aerosols over the tropical Indian Ocean, J. Geophys. Res., 106(D20), 24 097–24 105, 2001.
Ramana, M. V. and Ramanathan, V.: Abrupt transition from nat-ural to anthropogenic aerosol radiative forcing: Observations at the ABC-Maldives Climate Observatory, J. Geophys. Res., 111, D20207, doi:10.1029/2006JD007063, 2006.
Ramana, M. V., Ramanathan, V., Kim, D., Roberts, G. C., and Cor-rigan, C. E.: Albedo, atmospheric solar absorption and heating rate measurements with stacked UAVs, Q. J. Roy. Meteorol. Soc., 133, 1913–1931, 2007.
Ramanathan, V., Crutzen, P. J., Lelieveld, J., et al.: Indian Ocean Experiment: An integrated analysis of the climate forcing and effects of the great Indo-Asian haze, J. Geophys. Res., 106(D22), 28 371–28 398, 2001.
Ramanathan, V., Li, F., Ramana, M. V., Praveen, P. S., Kim, D., Corrigan, C. E., et al.: Atmospheric Brown Clouds: Hemi-spherical and regional variations in long range transport, ab-sorption, and radiative forcing, J. Geophys. Res., 112, D22S21, doi:10.1029/2006JD008124, 2007a.
Ramanathan, V., Ramana, M. V., Roberts, G. C., Kim, D., Corrigan, C. E., Chung, C., and Winker, D.: Warming trends in Asia am-plified by brown cloud solar absorption, Nature, 448, 575–578, doi:10.1038/nature06019, 2007b.
Roberts, G. C., Ramana, M. V., Corrigan, C. E., Kim, D., and Ramanathan, V.: Unveiling the aerosol indirect effect – simul-taneous observations of aerosol-cloud-albedo interactions, Proc. Natl. Acad. Sci., in press, 2008.
Seinfeld, J. H., Carmichael, G. R., and Arimoto, R.: ACE-ASIA – Regional climatic and atmospheric chemical effects of Asian dust and pollution, B. Am. Meteorol. Soc., 85(3), 367–380, 2004. Soddell, J. R., McGuffie, K., and Holland, G. J.: Intercomparison
of atmospheric soundings from the Aerosonde and radiosonde, J. Appl. Meteorol., 43(9), 1260–1269, 2004.
Stephens, G. L., Ellingson, R. G., and Vitko, J.: The Department of Energy’s Atmospheric Radiation Measurement (ARM) Un-manned Aerospace Vehicle (UAV) program, B. Am. Meteorol. Soc., 81(12), 2915–2937, 2000.