HAL Id: hal-01021774
https://hal-enac.archives-ouvertes.fr/hal-01021774
Submitted on 29 Oct 2014
HAL is a multi-disciplinary open access
archive for the deposit and dissemination of
sci-entific research documents, whether they are
pub-lished or not. The documents may come from
teaching and research institutions in France or
L’archive ouverte pluridisciplinaire HAL, est
destinée au dépôt et à la diffusion de documents
scientifiques de niveau recherche, publiés ou non,
émanant des établissements d’enseignement et de
recherche français ou étrangers, des laboratoires
A new algorithm to reduce AGPS acquisition TTFF
Hanaa Al Bitar-El Natour, Michel Monnerat, Anne-Christine Escher,
Christophe Macabiau, Marie-Laure Boucheret
To cite this version:
Hanaa Al Bitar-El Natour, Michel Monnerat, Anne-Christine Escher, Christophe Macabiau,
Marie-Laure Boucheret. A new algorithm to reduce AGPS acquisition TTFF. ION NTM 2006, National
Technical Meeting of The Institute of Navigation, Jan 2006, Monterey, United States. pp 301 - 311.
�hal-01021774�
A new algorithm to reduce AGPS acquisition
TTFF
Hanaa A. EL-NATOUR, ENAC/ TeSA Michel MONNERAT, Alcatel Alenia Space
Anne-Christine ESCHER, ENAC Christophe MACABIAU, ENAC Marie-Laure BOUCHERET, ENST
BIOGRAPHY
Hanaa A. EL-NATOUR graduated as a networks and telecommunications engineer in 2002 from the Lebanese University of Beirut, Lebanon. She has a masters and research degree in Networks and Telecommunications from the ENSEEIHT in Toulouse, France (2003). Currently, she is a PhD student at the ENAC (Ecole Nationale de l’Aviation Civile), in Toulouse, France. She is investigating different signal processing techniques for GPS positioning.
Michel Monnerat graduated from the ENSICA (Ecole Nationale Supérieure d’Ingénieur de Constructions Aéronautiques) engineering school. After being involved within Alcatel Space in many radar programs, in charge of the onboard processing of the ARGOS / SARSAT payload, he has been involved in the Galileo program since 1998, for the signal design and performance aspects. He is currently involved in Alcatel Space LBS programs.
Anne-Christine ESCHER graduated as an electronics engineer in 1999 from the ENAC in Toulouse, France. Since 2002, she has been working as an associate researcher in the signal processing lab of the ENAC. She received her Ph.D. in 2003.
Christophe MACABIAU graduated as an electronics engineer in 1992 from the ENAC in Toulouse, France. Since 1994, he has been working on the application of satellite navigation techniques to civil aviation. He received his Ph.D. in 1997 and has been in charge of the signal processing lab of the ENAC since 2000.
Marie-Laure BOUCHERET graduated from the ENST Bretagne in 1985 (Engineering degree in Electrical Engineering) and from Telecom Paris in 1997 (PhD degree). She worked as an engineer in Alcatel Space from 1986 to 1991 then moved to ENST as an Associated Professor then a Professor. Her fields of interest are
digital communications (modulation/coding, digital receivers, multicarrier communications …), satellite on-board processing (filter banks, DBFN …) and navigation systems.
ABSTRACT
The dramatic increase of Location Based Services and other location and navigation applications gives rise to a crucial need to improve positioning solutions. Currently, the American GPS is the only operational satellite based positioning system as the European Galileo system will be operational by 2010. This paper only deals with GPS receivers. The Time To First Fix (TTFF) and the sensitivity are the key drivers for their performance evaluation. The TTFF is the time needed for a GPS receiver to provide a first position. The sensitivity is the ability of a GPS receiver to acquire weak signals. For commercial solutions, an efficient receiver is one with reduced TTFF and high sensitivity. But generally, enhancing the sensitivity results in an increased TTFF and vice versa. In this paper, we propose a new algorithm for GPS acquisition which essentially deals with the TTFF.
I. INTRODUCTION
The expansion of GPS to Location-Based Services and other location and navigation applications gives rise to indoor localization requirements which pose particularly difficult problems, like GPS receiver sensitivity, cross-correlation and multipath issues [Parsons, 1992 - J. Miller, 1995], or TTFF.
The GPS receiver sensitivity must be as low as possible in order for the receiver to be able to detect very weak signals like those received in indoor environments (inside buildings) or urban canyons where many obstacles can significantly reduce the received power.
Moreover, in these harsh environments, it may happen that an interfering GPS signal coming from another satellite arrives at the user antenna while unaffected by any obstacle. It then causes the appearance of high cross-correlation peaks that may have levels comparable to the useful signal autocorrelation main peak. This can result in a false alarm (detection of a wrong signal) and consequently in an inaccurate location estimate. On the other hand, the obstructed signal may still reach the receiver by multiple reflections for example. In this case, the received signal is called multipath. It is an attenuated and delayed version of the original one. Thus even if it could be acquired, it will also lead to inaccurate location estimate. These cross-correlation and multipath peaks must not disturb the final solution selected by the receiver.
Finally, the TTFF, which is the time needed for a GPS receiver to find its first location, must be as short as possible so that the client does not “lose patience” while the receiver is trying to compute its location.
All of these issues are somehow related to each other. Indeed, one way to enhance sensitivity is to increase coherent and non coherent correlation duration so that weaker signals can be detected [Van Diggelen, 2001]. But this way, the TTFF also increases; and an increased TTFF is not at all desirable for real time applications as already explained.
As for multipath and cross-correlations, they must not affect the detection of the right autocorrelation peak for weaker signals, hence the right Doppler frequency and code delay. The algorithms needed to perform this discrimination might increase the TTFF or the sensitivity of the receiver.
In this paper we investigate a new algorithm for GPS receivers. It essentially decreases, by means of reduced computing load, the traditional TTFF. It may then provide the ability to increase coherent and/or non-coherent correlation duration in order to increase the sensitivity at comparable or even reduced TTFF. In addition, the implementation of the algorithm induces a rejection of some threatening multipath and cross-correlation peaks, and hence reduces the probability of wrong detection.
The algorithm consists in adding different code replicas to each other before using them to despread the GPS signal. This means that different satellite signals are despread together instead of being despread each one alone. The output which consists in a sum of autocorrelation and cross-correlation functions leads to as many useful correlation peaks as there are replicas added together. This could easily lead to the detection of false peaks when very weak signals are present. But as it will
be explained, the algorithm induces a way to reject correlations. However, even if the harmful cross-correlation peaks were rejected, a raise in the noise floor is observed. This results in potential false alarms.
Note that this algorithm is based on the Assisted GPS concept to constrain the search space and to improve its false detection ability. That is, Assistance Data (AD) from the GSM network is used to calculate approximate values ofthe Doppler frequency and code delay for each satellite, and provides a raw user position within a GSM cell [LaMance, 2002]. Thus the GPS receiver is supposed to receive data from a cellular mobile phone. Consequently, the AD disseminated by the telecommunication channel is used by the receiver in order to improve its sensitivity and to decrease the TTFF. Typically in cold start, the AD set required is composed of:
• The reference time • The reference location
• The navigation model (Ephemeris) • The ionosphere correction
The paper is organized as follows: first we describe the classical GPS acquisition algorithm; next, we present the new proposed algorithm. The subsequent section consists in analyzing the algorithm and presenting its strong points and drawbacks. Finally, in the last part we present results for performance evaluation obtained with this algorithm. In what follows, the new algorithm will be referred to as Sum Of Replicas algorithm (SOR). II. THE CLASSICAL FFT AGPS ALGORITHM
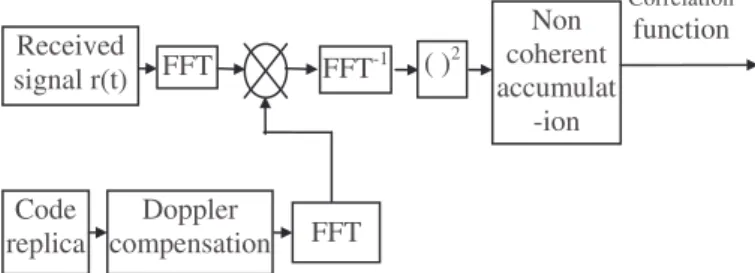
A standard AGPS FFT acquisition scheme is shown in figure 1:
Fig 1 Classical GPS acquisition scheme
In figure 1, r(t) is the GPS received signal. It is a composite signal comprising multiple satellite signals (satellites in view), hence multiple Coarse/Acquisition (C/A) PRN codes. These PRN codes are searched for sequentially. FFT FFT-1 Doppler compensation Code replica ( )2 Non coherent accumulat -ion Correlation function FFT Received signal r(t)
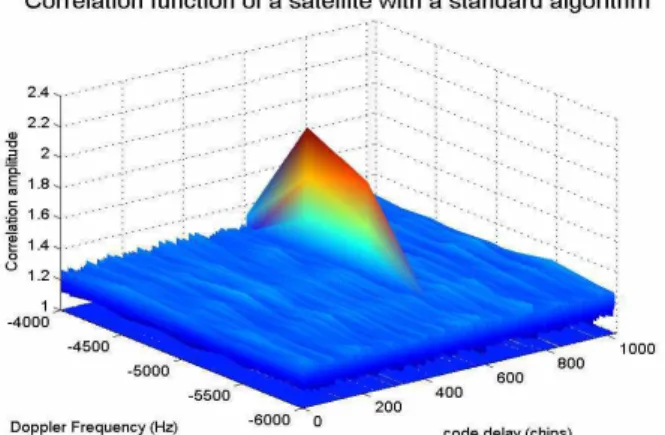
The acquisition process first consists in despreading the useful received signal by correlating it with a local replica. This correlation is achieved using the Fast Fourier Transform (FFT) technique. The process aims at finding each satellite signal code delay and Doppler frequency by detecting the location of the signal maximum energy. Figure 2 shows an example of a classical GPS acquisition algorithm output.
Fig 2: An example of a classical GPS acquisition output for a signal at 30dBHz, with a Doppler frequency and code delay of -4500Hz and 600chips respectively
In a classical case, all the Doppler/code delay bins must be investigated. In our case however, the acquisition process is carried out in an AGPS context, and thus with an aid for a-priori estimates of the Doppler frequency and the code delay for each satellite signal. Nevertheless, one has to keep in mind that these estimates are affected by uncertainties on the reference position and on the receiver clock offset with respect to GPS time.
The received signal Doppler frequency has mainly three sources: (1) the satellite motion, (2) the receiver motion, and (3) the receiver clock drift with respect to GPS time [Kaplan, 1996]. The AD estimated Doppler frequency is deduced only from the satellite motion. The estimation error on this Doppler frequency is considered negligible and in the order of a few Hz. However, the two other Doppler components cannot be estimated by the AD and must be searched for. We suppose that these two Doppler components vary between ± 2 KHz.
The reference position is that of the transmitting GSM Base Station. Consequently, the uncertainty on the reference position depends on the considered GSM cell radius. A GSM cell radius varies between approximately 1km for urban areas, and 30km for rural areas. The time uncertainty is of the order of ±2s. This value corresponds to the accuracy of the time transfer through the GSM cellular network.
The uncertainties on the Doppler frequency and the code delay lead to the estimate of a code delay range rather than a code delay value, and the correlation can only be computed for the code delay values within this range. But using the FFT technique to compute correlation all the code delay bins are necessarily explored and this information can only be used as an authentication of the acquisition result.
In the case of a standard algorithm, this acquisition process is sequentially repeated for each satellite in view. A joint search of several satellites would allow a reduction of the time allocated to the acquisition of the different satellites. This is the base of the proposed algorithm presented in the next section.
III. THE SOR ALGORITHM
The general principle is to correlate the incoming signal with the sum of C/A code replicas rather than correlating it with only one replica. This yields to a parallel search for all visible satellites rather than searching for them sequentially. The acquisition process is obviously speeded up. Note that visible satellites PRN are known a priori thanks to the AGPS AD.
The acquisition is realized according to the scheme presented in figure 3:
Fig 3 SOR algorithm principle
The resulting correlation function in each explored Doppler cell is equal to the sum of the correlation function which would have been obtained if satellites were individually correlated.
Figure 4 illustrates an example of such a correlation function for a composite signal comprising 10 satellite signals at 30 dBHz. Four of them are acquired in parallel. Sat 2 C/A code Sat n C/A code Doppler Compensat-ion Doppler Compensat-ion FFT FFT FFT-1 ( )2 Non coherent accumulation Correlation function FFT Doppler Compensat-ion FFT Received Signal Sat 1 C/A code
0 200 400 600 800 1000 1200 0 5 10 15x 10 6
Fig 4 Example of the output correlation function of the SOR algorithm with 4 satellites acquired together
Each satellite PRN code has its own delay, and hence corresponds to one of the acquisition peaks detected in this correlation function. At this stage, the issue is to determine the proper correspondence between satellite PRNs and acquisition peaks. This correspondence is done first by trying to locate each acquisition peak within a code delay window. Indeed assuming that the reference location, the reference time and the navigation model are known thanks to AD, the receiver can compute the differential time of arrival between the satellites. This information can be used to identify the correlation peak pattern. The correspondence is then possible since each code delay window is already assigned to a satellite PRN code as it is shown in figure 5 below.
Fig 5 Satellites identification process using the code delay ranges function (red plot) estimated by the AD. The blue plot corresponds to the acquisition code delay positions
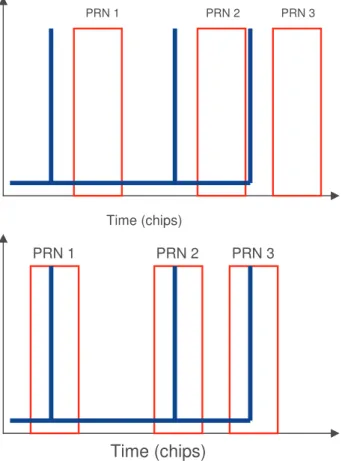
However, this identification process is not possible if for example, two or more satellites have the same or close code delays. Thus a discrimination process should first be undertaken. A classification in groups of the visible satellites according to their respective expected code delay is realized to avoid correlation peak collisions. Such potential collisions are eliminated if the code delay windows of satellites in the same group do not intersect with each other. Else, the satellites cannot be part of the same composite replica as shown in Figure 6.
Fig 6 Collisions between satellites having close code delays
Obviously, the accuracy of the provided code delay computed through AD is tremendously important and the wider the code delay windows, the fewer satellites per group.
Once the satellites are grouped according to their code delays, each group goes through an acquisition process by correlating the incoming signal with the sum of the corresponding replicas. The output is a correlation function similar to that shown in figure 4 with as many peaks as there are satellite signals in the considered group.
We still have the satellites identification issue. In fact, the peak position returned by the function is affected by a time offset. This is due to the receiver clock offset
Time (chips) PRN k PRN n PRN m
Acquisition peak position function Peak range function
Peak range k Peak range m
Collision!!!
Peak range k Peak range m
which causes the peak configuration computed by the grouping function to be shifted. This has no impact on the previous processing (correlating the signal with code replicas, grouping the satellites in order to avoid collisions between their code delays), but has an impact on the identification of the peaks. A solution to this problem is to correlate the code delay windows function and the acquisition peaks positions function (resulting from correlation) defined as:
- Peak range function
= ∈ = port ms the on elsewhere t Ranges PRN t if t sup 1 0 ) ( 1 ) ( χ χ
- Acquisition peaks positions function
{
}
= ∈ = port ms the on elsewhere t peaks n acquisitio ected t if t sup 1 0 ) ( det 1 ) ( η ηThe maximum of the resulting correlation function provides the most likely configuration and in the same time provides the relationship between the peaks and the PRN number (figure 7).
Fig 7 Satellites identification by correlating the ranges function (in red) and the acquisition code delay ranges function (in blue)
In practice, even if the satellites were grouped a priori such that collisions are avoided between their code delays, collisions are still possible. The reason is that the code delays detected by the acquisition process do not have necessarily the same pattern as that of the ranges estimated by the AD. This is due to possible cross-correlation peaks which may mask those of weak signals or even multipath peaks. These peaks have random delays. In this case, some of the output correlation function peaks are wrong. However, the peaks which are not included in any code delay range are not accounted for since code delays are searched for only within the precalculated ranges. Whereas if two peaks are included in the same code delay range, one of them obviously does not correspond to the proper correlation peak, i.e., it does not correspond to a PRN code delay. In such cases, the lower peak is eliminated and only the higher one is taken into consideration. This is also applied if more than two peaks coincide within the same code delay range.
Obviously, the more satellites per group, the greater the complexity reduction with respect to a standard algorithm. But having too many satellites per group may affect the receiver sensitivity as discussed in the next section.
IV. ADVANTAGES AND DRAWBACKS OF THIS ALGORITHM
The SOR algorithm reduces the TTFF by reducing the complexity in comparison to a standard algorithm, since it allows the acquisition of more than one satellite at once, or in other words, it allows for a parallel processing of the satellites. This reduction depends on the number of satellites processed together. Thus the more we have satellites per group, the more the complexity is reduced and the lower is the TTFF.
Conversely, having more satellites per group induces a reduction in sensitivity, since the global noise level is increased. To illustrate this, let us consider a composite GPS signal comprising the signals coming from N satellites. Searching for one of the satellite signals, namely the first, with a standard algorithm yields an autocorrelation function added to N-1 cross-correlation functions. The additive noise is correlated is correlated with only code.
Using the SOR algorithm, suppose that the first group of satellites contains 3. Accordingly, the signal will be correlated with the sum of 3 Doppler compensated replicas. The result is the sum of 3 autocorrelation functions and 6+3*(N-3) cross-correlation functions. In this case, the noise is the correlated with the sum of the codes. Therefore, in this case we have much more cross-correlation peaks and more autocross-correlation peaks, and the noise level is increased.
PRN 1 PRN 2 PRN 3
Time (chips)
PRN 1 PRN 2 PRN 3
In conclusion, compared to the standard algorithm, the SOR algorithm introduces more cross-correlation peaks which may lead to more false alarms. But the solution to this problem is inherent to the implementation of the SOR algorithm itself. Indeed, the correlation peaks are searched for within predetermined code delay windows. Thus all cross-correlation peaks which occur outside the boundaries of these windows are eliminated. Hence, the smaller the width of the ranges, the lower is the probability of false alarm. Furthermore, we notice an increase of the global noise level due to the correlation of the noise with many C/A codes. This increase must be characterized.
Note that the C/A codes are summed together after Doppler compensation, thus they have different delays and Doppler shifts. All of these parameters must be considered in order to have a subtle study of the variation of the noise level when more than one satellite are acquired together.
At this stage, two solutions may be adopted to enhance sensitivity:
- The first solution is to set an upper level for the number of satellites per group, such that the loss in C/N0 is limited
to a predetermined value.
- The second solution consists in realizing integrations on signal sections free from bits transitions which may enhance the C/N0 by 2 or 3dBs approximately depending
on the bit transition position within a 20ms section of the signal. The issue is then to pregroup the satellites according to their respective bit transitions, once again thanks to the AD. Next, the correlations are computed with the signal being shifted by the value of each group proper bit transition (in ms).
The next section presents performance evaluation of the algorithm based on the TTFF and the sensitivity parameters.
V. PERFORMANCE EVALUATION OF THE SUM OF REPLICAS ALGORITHM
Prior to presenting performance evaluation results, an example of output of this algorithm is first shown below. It only aims at illustrating the algorithm outputs, performance tests will be shown later. The test signal used is a simulated one using a Spirent STR4500 with 10 visible satellites with characteristics given in Table 1 and 2.
Group number PRN number 1 1,3,6,8,10,22,25
2 17,18,30
Table 1: Satellites grouping to avoid collisions between code delay ranges.
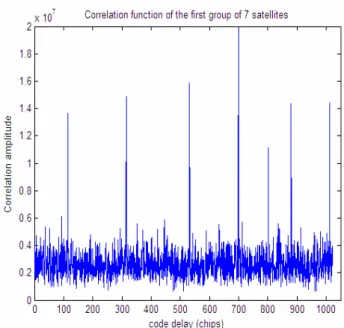
The 10 satellites in view are divided in 2 groups, with the first group having 7 satellites and the second having 3 satellites. This grouping is realized after computing the estimates of each satellite code delay using the AD. The ranges corresponding to each code delay are then calculated. Next the satellites are grouped such that ranges of satellites of the same group do not collide. All of the signals are at approximately 41.5 dBHz. The reference position uncertainty is set to 10Km.
PRN 1 3 6 8 10 22 25 17 18 30 delay
(chips) 802 1.012 699.5 114.5 315 880.5 532 725 293.5 510 C/N0
(dBHz) 33 34 36 34 35 34.5 35 38.3 37 38
Table 2: Satellites respective estimated C/N0 ratios and code delays (detected after acquisition)
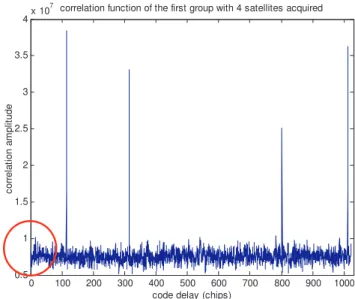
Fig 8: Correlation function for the first group of satellites with 7 peaks corresponding to each satellite
Fig 9: The relationship between the acquisition peaks and the different AD ranges for the first group of 7 satellites
In figure 9, the peaks fall in the middle of the code delay ranges because the AD estimated code delays were set to the accurate ones (The clock drift considered was the exact one). Indeed in this case, the central value of the ranges, which must correspond to the code delays estimated by the AD matches with that calculated after the acquisition process. But for real signals this is not the case.
Fig 10: Correlation function for the second group of satellites with 3 apparent peaks
Fig 11: The relationship between the acquisition peaks and the different ranges
Next, we present the results of the SOR performance evaluation. As explained before, for a GPS receiver, the performance evaluation key drivers are the TTFF and the sensitivity. The performances are evaluated in comparison to a standard algorithm that sequentially processes all the satellites.
As already mentioned, with the proposed algorithm, the TTFF is reduced since many operations, namely FFTs and Doppler compensation that are done for each satellite in a standard algorithm are rather done for each group of satellites in the SOR algorithm. Consequently, the TTFF is directly related to the number of groups as already explained, and thus to the number of satellites per group. The number of satellites per group is related to the width of the AD ranges. Now, the width of the AD ranges is directly affected by the reference position and the time uncertainties (The satellite elevation and the Doppler also affect the code delay range width but the main contribution to this value is that of the reference position and the time uncertainties). In order to test different GSM environments, three characteristic values of the reference position uncertainty will be considered: 1Km, 10Km and 30Km. These values match with different GSM cell radii. A cell radius of 30Km corresponds to a rural case, whereas the 2 other values correspond to urban cases.
The studied simulations outputs are:
- Mean width of the code delay ranges
- Number of subset of satellites used in the algorithm
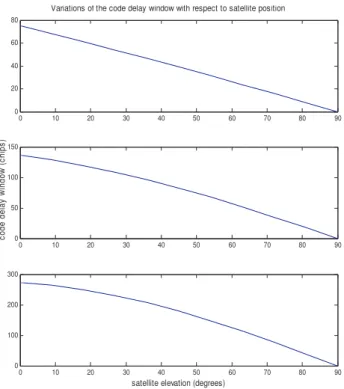
Note that for a satellite in the horizontal plane, i.e., with a maximum Doppler frequency of 5KHz [Kaplan, 1996] and an elevation of 0°(generally the mask angle is of 5°), the range width values due to uncertainties on the reference position and the GPS time add together. For a time uncertainty of 2s, the approximate code delay range width is of 273 chips, 136 chips and 75 chips for GSM cell radii of 30, 10 and 1Km respectively. At the zenith, i.e., with a null Doppler frequency and an elevation of 90° the code delay range width is equal to 0, which means that we have no uncertainty on the code delay in this case. In other words, in this case the code delay for a user located at the Base Station or anywhere else within the considered cell is approximately the same. Figure 12 depicts the code delay range width variation for elevations lying between 0 and 90°, and Doppler frequencies ranging from 5 KHz to 0 correspondingly. 0 10 20 30 40 50 60 70 80 90 0 20 40 60 80 0 10 20 30 40 50 60 70 80 90 0 50 100 150 0 10 20 30 40 50 60 70 80 90 0 100 200 300
Variations of the code delay window with respect to satellite position
satellite elevation (degrees)
c o d e d e la y w in d o w ( c h ip s )
Fig 12: Variations of the code delay windows with the satellites elevation for three different reference position uncertainties
The results shown hereafter were obtained by averaging results obtained with different real GPS signals collected using a GPSBuilder receiver. Note that results obtained with simulated signals using a Spirent STR4500 were similar to those obtained with real signals.
Fig 13: The average width of AD ranges for 3 reference position uncertainties
Fig 14: The average number of groups of satellites for 3 reference position uncertainties
Figures 13 and 14 clearly show that the number of groups of satellites has the same variations as those of the code delay windows.
Fig 15: The observed average number of satellites per group for 3 reference position uncertainties
Average number of groups of satellites
0 0,5 1 1,5 2 2,5 3 3,5 30 Km 10 Km 1 Km
reference position uncertainty
A v e ra g e n u m b e r o f g ro u p s
Average number of satellites per group
0 1 2 3 4 5 6 7 8 30 Km 10 Km 1 Km
reference po sitio n uncertainty
A v e ra g e n u m b e r o f s a te lli te s
Average w idth of AD code delay ranges
0 20 40 60 80 100 120 140 160 180 30 Km 10 Km 1 Km
ref erence position uncertainty
c o d e d e la y w in d o w ( c h ip s )
Thus, the number of satellites per group increases when the reference position uncertainty decreases. For an uncertainty of 10 Km for example, the average number of satellites per group is approximately 3.
The algorithm complexity reduction has been compared to a standard one. The results are given in figure 16 for a TMS320C64x DSP.
Reduction of TTFF between a standard algorithm and the sum of replicas algorithm 0 1 2 3 4 5 6
10 sats-4groups 10 sats-3groups 10 sats-2groups 10 sats-1groups
T T F F r e d u c ti o n r a ti o n
Fig 16: TTFF improvement brought by the SOR algorithm for different grouping of 10 satellites, in comparison with the standard algorithm
As we can see in the previous figure, when the satellites are divided into three groups, i.e. the average number of satellites per group is approximately 3, the TTFF is reduced by a factor of approximately 3.
Results concerning sensitivity essentially deal with the reduction of the C/N0 when more satellites are
acquired together, or in other words when more satellites are present in the same group. The tests conducted showed that the more satellites we have per group, the lower is the C/N0.
The following example depicts the reduction in the C/N0 level when more satellites are present in the
same group. The signal used to conduct this test was simulated using a Spirent STR4500. It comprises 10 satellites at 41,5 dBHz approximately.
Group number PRN Number 1 1; 3; 8; 10
2 6; 22; 25
3 17;18
4 30
Table 3: Satellites grouping to avoid collisions between code delay ranges
Table 4: Satellites respective C/N0 ratios and code delays (detected after acquisition)
For this signal, when only one satellite is present the C/N0 ratio corresponds approximately to the real one,
whereas for three satellites we have an approximate loss of 3dBs and for four satellites, the loss is of approximately 4.5 dBs.
The figures below illustrate the correlation function for each group. 0 100 200 300 400 500 600 700 800 900 1000 0.5 1 1.5 2 2.5 3 3.5 4x 10 7
code delay (chips)
c o rr e la ti o n a m p lit u d e
correlation function of the first group with 4 satellites acquired
Fig 17 1st group (correlation amplitude v/s code delay)
0 100 200 300 400 500 600 700 800 900 1000 0 0.5 1 1.5 2 2.5 3 3.5 4x 10 7
code delay (chips)
c o rr e la ti o n a m p lit u d e
correlation function for the second group of 3 satellites
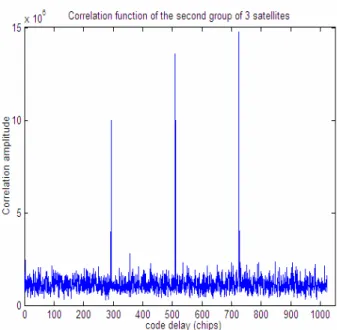
Fig 18 2nd group (correlation amplitude v/s code delay)
PRN 1 3 8 10 6 22 25 17 18 30 C/N0 36 37.3 37 38 37.6 38.4 37 40 39.14 41.8 Code
0 100 200 300 400 500 600 700 800 900 1000 0 0.5 1 1.5 2 2.5 3 3.5x 10 7
code delay (chips)
c o rr e la ti o n a m p lit u d e
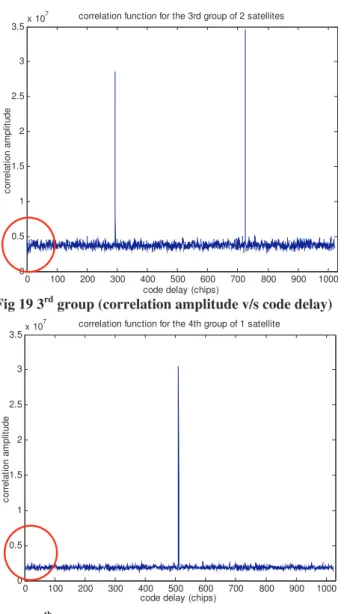
correlation function for the 3rd group of 2 satellites
Fig 19 3rd group (correlation amplitude v/s code delay)
0 100 200 300 400 500 600 700 800 900 1000 0 0.5 1 1.5 2 2.5 3 3.5x 10 7
code delay (chips)
c o rr e la ti o n a m p lit u d e
correlation function for the 4th group of 1 satellite
Fig 20 4th group (correlation amplitude v/s code delay) Considering figures 17, 18, 19, and 20 we can see that the global noise level (mean value of the noise) is lower when only one satellite is present and that the noise variations increase also with the number of satellites processed at once. This explains the loss in the C/N0 ratio
observed for a group of more than one satellite. In addition the noise variations are more important when more signals are present. This can be due to cross-correlations. Figure 21 below depicts the average loss in the C/N0 induced by the SOR algorithm, for different
groupings of 10 satellites. The signals used here were also simulated using a Spirent STR4500, in order to be able to choose different C/N0 for each test. The results obtained
correspond to the average loss in C/N0 for these signals at
41.5 and 26.5dBHz respectively.
Fig 21: Reduction in C/N0 in terms of the number of satellites per group
Reconsidering the case of three satellites per group, the reduction in the C/N0 is of approximately 3dB.
At this stage, one should find the good compromise between the reduction in TTFF and that of sensibility. An upper limit for the number of satellites per group can be set in order for the global loss in the C/N0 to
be limited to a certain value.
The results we have until now show that limiting the number of satellites per group to 3 may be a good compromise.
VI. CONCLUSION
In this paper we presented a new algorithm for GPS acquisition. It essentially enhances the TTFF by correlating the incoming satellite signal with a sum of different C/A codes replicas rather than correlating it with only one code replica. Such processing implies a certain parallelism by searching for more than one satellite at once. It results in a complexity reduction with respect to a standard sequential algorithm. This implies a reduction in the TTFF needed for a GPS receiver to compute a solution.
Evaluating the performances of this algorithm depicted that the global complexity reduction induced by the SOR algorithm in comparison with a standard one depends on the number of satellites processed in parallel. For three satellites the complexity is reduced by a factor of 3 approximately.
However, a loss in the C/N0 ratio was noticed.
The more satellites we have per group, the greater is this loss. Thus a compromise must be set in order to have the best correspondence between the reduction in sensitivity and that of the TTFF. An upper limit for the number of
Reduction in C/N0 in terms of the number of satellites per group 0 0,5 1 1,5 2 2,5 3 3,5 4 4,5 5
4 satellites 3 satellites 2 satellites 1 satellite
R e d u c ti o n i n C /N 0
satellites per group must be adopted in order to limit the loss in C/N0 ratio. Bit transitions may be an interesting
topic to be considered when correlating in order to compensate for the reduction in sensitivity.
ACKNOWLEDGMENTS
This paper has been written in the frame of the research activities of the European project LIAISON. LIAISON is a research project led by Alcatel Alenia Space and involving 34 other European partners, which aims at developing Location Based Services for professional markets. LIAISON has received research funding from the Community's Sixth Framework Program.
We would like to thank Olivier JULIEN for his valuable remarks and suggestions.
REFERENCES
[Van Diggelen, 2001] - F. van Diggelen (2001), “Global Locate Indoor GPS Chipset and Services”, Global Locate, Inc., 1515, in proceedings of the ION GPS 2001 [LaMance, 2002] - Jimmy LaMance, Javier DeSalas, Jani Jarvinen (2002)
,
“Assisted GPS: A Low-Infrastructure Approach”, GPS World[Kaplan, 1996] - Eliott D. Kaplan (1996), “Understanding GPS: Principles and Applications”, Artech House, Norwood, MA
[J. Miller, 1995] - Michael J. Miller, Branka Vucetic, Les Berry (1995), “Satellite Communications: Mobile and Fixed Services”, Kluwer Academic Publishers, USA [Parsons, 1992] – David Parsons (1992), “The Mobile Radio Propagation Channel”, BPCC Wheatons Ltd, GB