HAL Id: hal-00336503
https://hal.archives-ouvertes.fr/hal-00336503
Submitted on 4 Nov 2008
HAL is a multi-disciplinary open access
archive for the deposit and dissemination of
sci-entific research documents, whether they are
pub-lished or not. The documents may come from
teaching and research institutions in France or
abroad, or from public or private research centers.
L’archive ouverte pluridisciplinaire HAL, est
destinée au dépôt et à la diffusion de documents
scientifiques de niveau recherche, publiés ou non,
émanant des établissements d’enseignement et de
recherche français ou étrangers, des laboratoires
publics ou privés.
Investigation of time-reversal processing for
surface-penetrating radar detection in a multiple-target
configuration
Anthony Cresp, Ioannis Aliferis, M. Yedlin, Christian Pichot, Jean-Yves
Dauvignac
To cite this version:
Anthony Cresp, Ioannis Aliferis, M. Yedlin, Christian Pichot, Jean-Yves Dauvignac. Investigation of
time-reversal processing for surface-penetrating radar detection in a multiple-target configuration. 5th
European Radar Conference (EuRAD), European Microwave Week, Oct 2008, Amsterdam,
Nether-lands. pp.144-147. �hal-00336503�
Investigation of Time-Reversal Processing
for Surface-Penetrating Radar Detection
in a Multiple-Target Configuration
A. Cresp
#1, I. Aliferis
#2, M. J. Yedlin
∗3, Ch. Pichot
#4, J.-Y. Dauvignac
#5 #LEAT, Universit´e de Nice Sophia-Antipolis, CNRS;250 rue Albert Einstein, 06560 Valbonne, France
1 Anthony.Cresp@unice.fr 2 Iannis.Aliferis@unice.fr 4 Christian.Pichot@unice.fr 5 Jean-Yves.Dauvignac@unice.fr
∗Department of Electrical and Computer Engineering, University of British Columbia
2332 Main Mall, Vancouver, B.C., Canada V6T 1Z4
3 matty@ece.ubc.ca
Abstract— This paper presents detection and imaging
capa-bilities of a simple time-reversal focusing algorithm, applied to experimental data that are obtained under various radar scene configurations (single- or multiple-target in free-space or through-the-wall). Data are collected with the ultra-wideband surface penetrating radar SIMIS (Synthetic-Impulse Microwave Imaging System, designed in LEAT) which operates almost from dc up to 18 GHz. The algorithm propagates time-reversed received signals in a supposedly known medium (either free-space or through a wall with known parameters) using a simple dipole model for the antennas. At each time step, an image of the scene is obtained, corresponding to the instantaneous electric-field energy in each pixel. A focusing criterion, looking for a minimum of entropy combined with a maximum of energy in the image, automatically selects the optimum frame, shown here. Two free-space (dielectric target, dielectric and metallic target) and one through-the-wall (dielectric target) configurations are investigated, showing the efficiency of the method.
I. INTRODUCTION
In GPR and, in a wider sense, Surface-Penetrating Radar (SPR) applications, signal processing plays a key role in obtaining images of targets. Different well-known techniques combining pre-processing treatments and microwave imaging are currently used to construct an image of a scene [1]. Recent research shows that time-reversal (TR) data processing in acoustics and electromagnetics (narrow-band configuration) is a very efficient method to detect positions of transmitters (see [2] for a topic review). Time-reversal has been also successfully applied to ultra-wideband (UWB) telecommuni-cations in a multipath environment [3], [4], leading to data-rate improvement. The efficiency of time-reversal has already been shown in the case of embedded targets [5], [6].
Here, we propose to investigate TR for experimental SPR applications in a multiple-target configuration. The paper is structured in five sections. The experimental setup (SIMIS radar and geometric configuration of radar scenes) are pre-sented in Section II. The TR algorithm, together with an
ap-propriate optimum focusing frame selection criterion, is given in Section III, while Section IV presents experimental imaging results for both metallic and dielectric targets. Section V contains a final discussion and conclusion.
II. MEASUREMENT SYSTEM AND EXPERIMENTAL CONFIGURATIONS
A. Measurement system
Data are collected with the SIMIS (Synthetic-Impulse Mi-crowave Imaging System) radar [7], [8]. This system consists of a linear array of eight ETS (Exponential Tapered Slot) antennas, presenting an SWR < 2 over the frequency band
1.4−20 GHz [9]. Each antenna of the array can be used either
as a transmitter or a receiver by means of two electromechani-cal microwave 1-to-8 multiplexers. A two-port vector network analyzer provides RF signal to the transmitting antenna and measures reflection and transmission S parameters.
In a first configuration of the system, called “SIMIS config-uration”, all antennas of the array play the role of transmitter and receiver. Thus, we have access to sixty-four measurements, linked to all possible different couples of emitting/receiving antennas, without moving the array. Measured data comprise the eight S11 parameters as well as the fifty-six S21
pa-rameters, corresponding to all possible combinations of eight transmitting and eight receiving antennas.
An alternative approach is to use an extra antenna for transmission and then measure just the eightS21 parameters.
This acquisition scheme, called “hybrid configuration” (Fig.1), does not use any S11 parameters. Among the advantages of
this configuration is the possibility to move and locate the transmitting antenna independently of the array, to use differ-ent emitting antennas (dipole, horn, . . . ), possibly associated with an amplifier.
Measurements are made in the frequency domain, in the 2−
Fig. 1. The SIMIS radar, consisting of one emitting antenna (top right) and an eight-element receiving array.
points). We perform differential measurements (with / without the target) and obtain, by subtraction, the scattered electro-magnetic field coming from the target only (assuming no interaction between the target and the background). Time-domain signals are then obtained by an inverse (fast) fourier transform.
B. Experimental configurations
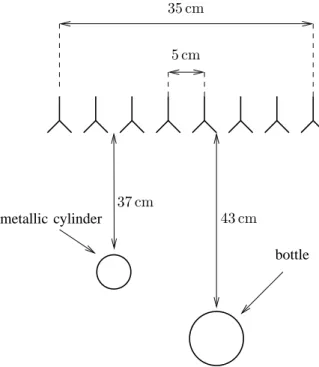
Three experimental radar scenes are presented here. The first one consists of a plastic bottle filled with salted water, placed at 40 cm with respect to the center of the array. The second experiment (Fig. 2) includes the same bottle of salted water as well as a metallic cylinder, located quite close to each other (about 3λ/5 at the lowest frequency). In both cases, we
deal with a free-space configuration. Measurements are made using the “SIMIS configuration”.
In the third experiment, the same bottle is centered in front of the array but hidden behind an interface, a through-the-wall (TTW) configuration. The through-the-wall is 7 cm thick, located at
41 cm from the array. The target is at 33 cm from the wall,
thus 81 cm from the array. Measurements are made using the “hybrid configuration”.
III. TIME-REVERSAL METHOD
A. Principle
In order to image the radar scene, we simulate the propaga-tion of time-reversed versions of the signals recorded by the re-ceiving antennas. Under space and time reciprocity conditions (that are clearly satisfied here), this time-reversal processing gives us information on the measured wave past: the unknown targets, considered as an effective set of secondary sources, are detected as the origin of the wave.
The time-reversal method applied here is schematically illustrated in the case of a simplified radar scene (Fig. 3) in the sequence of Figures 4, 5 and 6. We can see that time-reversed propagated signals interfere constructively at the scatterer location. 35 cm 5 cm 37 cm 43 cm metallic cylinder bottle
Fig. 2. Multiple-target experiment geometry: dielectric bottle filled with salted water and metallic cylinder, in free-space.
T x Rx1 Rx2
r0 r
1 r2
Fig. 3. Simplified geometry used to illustrate the time-reversal algorithm (Figs. 4 to 6). r0 c r0 c + r1 c r0 c + r2 c t 0
Fig. 4. A pulse, emitted att = 0 by T x (Fig. 3), recorded by Rx1(blue) andRx2(red). −r0c − ¡r0 c + r1 c ¢ − ¡r0 c + r2 c ¢ 0 t
Fig. 5. Receiver signals (Fig. 4) after time-reversal: pulses are flipped with respect to the origin,t = 0.
− r0
c 0 t
Fig. 6. Time reversed signals (Fig. 5) after propagation from each receiver to the target: pulses arrive simultaneously on the right space point, resulting to focusing.
B. Algorithm
Our implementation of the time-reversal principle has been discussed in [10]. At each pixel of the investigation domain, we assign the sum of appropriately time-shifted and attenuated (under free-space propagation) copies of the time-reversed recorded signals after taking the time derivative1.
In this paper, we propose three extensions to the previously published algorithm. We model the array antennas as small dipoles, instead of point-like sources. The presence of a wall (in a TTW configuration) is taken into account by a simple phase-correction model: an extra time-shift is applied accord-ing to the length of the intersection between the antenna-pixel line and the wall, assuming that the wall position, thickness, and permittivity are known. Finally, instead of showing images of the energy path (accumulated electric-field energy over the entire measurement time window), which contain only space focusing information, we develop a technique to automatically select the time frame when the energy is focused in the image.
C. Time focusing criterion
The aim of this section is to illustrate an efficient systematic way to retrieve the time where the wave focusing is optimum, i.e. the time frame when the energy is concentrated at the location where the target initially was. By assigning to each pixel the value of the instantaneous electric-field energy, wave focusing is equivalent to a “well-ordered” image: if we calculate the image entropy at each time step, the minimum should correspond to the optimum focusing. This image can be used to detect the target.
In our case, the image entropy is defined as
Ht= − X i X j pijlnpij (1)
where t denotes time, i and j are the coordinates of the
considered pixel in the image mesh, and pij is the energy
of the pixel normalized with respect to the total energy in the image, so that values ofpij are always between 0 and 1.
1This time differentiation is justified by the fact that the sources in the
electric-field wave-equation ∇2E− 1 c2 ∂2E ∂t2 =µ ∂J ∂t
appear in the form of∂J/∂t. Data measured with the VNA are voltages at
the connector of the antenna and thus are proportional to the current induced by the impinging electric field; using these measurements as an electric-field excitation signal necessitates the time differentiation of the equivalent current source. 0 5 10 15 20 25 30 35 10 20 30 40 50 60 −20 −18 −16 −14 −12 −10 −8 −6 −4 −2
distance along array (cm)
d is ta n ce fr o m ar ra y (c m )
Fig. 7. Image obtained with the one-target experimental data after simulated free-space propagation of time reversed received signals; colors represent the instantaneous electric-field energy, normalized with respect to maximum, in dB.
In order to favour time frames corresponding to ordered images that effectively contain energy, Ht is divided by the
maximum energy among all the pixels in the frame. The search for the optimum time frame starts at the moment when energy begins to accumulate in the image and stops when total energy begins to drop.
IV. RESULTS
We process the experimental data with the time-reversal algorithm and apply the focusing criterion of the previous Section to automatically select the optimum frame, in terms of electric-field energy focusing in the image. Results for the three radar scenes described in Section II-B are shown here.
The dielectric target in free-space (bottle with salted water, first configuration described in Section II-B), is imaged quite clearly (Fig. 7), at the exact position. We note the high energy levels on the back side: they correspond to a wave reflection from a slow (salted water) to a fast (free-space) medium, in accordance with basic electromagnetic theory.
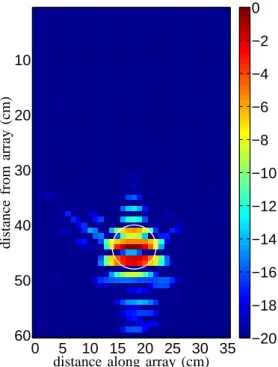
The image of the second radar scene (bottle and metallic cylinder, Fig. 2) presents some blur (Fig. 8), probably due to mutual coupling between the two targets, located close together. However, the targets are well separated and the metallic cylinder (left) shown at the exact location. We note that the image shown here presents the best focusing over all time frames produced by the propagation of time-reversed signals.
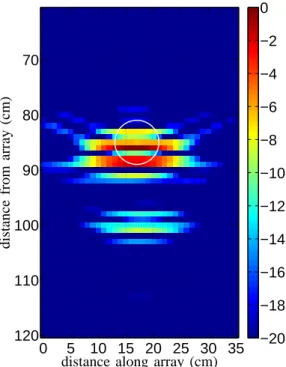
The third image (Fig. 9) shows the bottle behind the wall. The focusing spot is wider than the one obtained in free-space
0 5 10 15 20 25 30 35 10 20 30 40 50 60 −20 −18 −16 −14 −12 −10 −8 −6 −4 −2 0
distance along array (cm)
d is ta n ce fr o m ar ra y (c m )
Fig. 8. Image obtained with the two-target experimental data (Fig. 2) after simulated free-space propagation of time reversed received signals; colors represent the instantaneous electric-field energy, normalized with respect to maximum, in dB.
(Fig. 7), mainly because of the simple model used to take into account the wall — just a phase correction, as explained in Section III-B. The target is found at the correct location. For this image, we useεr = 2.12, obtained after time-delay
measurements.
V. CONCLUSION
It has been demonstrated in this paper that the time-reversal algorithm is a good candidate for microwave data processing used for the detection of targets in free space or situated behind an interface.
The focusing criterion, based jointly on entropy and energy considerations, allows the automatic selection of the optimum time frame. Imaging results are very good for a single target configuration, but a bit blurred in the two-target configura-tion, mainly due to coupling between targets. In the TTW configuration, the target is imaged correctly, but with some noticeable spread in the image. Future research will include the investigation of target separation by the MUSIC or DORT algorithms, examination of algorithm robustness when using time-gating on raw data (no differential measurements) and two-dimensional data acquisition by antenna array translation.
ACKNOWLEDGEMENT
The authors appreciate the comments of Prof. M.D. Sacchi (Department of Physics, University of Alberta, Canada) on entropy. 0 5 10 15 20 25 30 35 70 80 90 100 110 120 −20 −18 −16 −14 −12 −10 −8 −6 −4 −2 0
distance along array (cm)
d is ta n ce fr o m ar ra y (c m )
Fig. 9. Image obtained with the through-the-wall experimental data after simulated free-space propagation of time reversed received signals; colors represent the instantaneous electric-field energy, normalized with respect to maximum, in dB. The upper part of the image, 0 − 60 cm, (not shown here) contains no energy at this time step.
REFERENCES
[1] D. J. Daniels, Ground Penetrating Radar, 2nd ed., ser. IEE Radar, Sonar, Navigation and Avionics Series. London: The Institution of Electrical Engineers, 2004, no. 15.
[2] M. Fink, D. Cassereau, A. Derode, C. Prada, P. Roux, M. Tanter, J.-L. Thomas, and F. Wu, “Time-reversed acoustics,” Reports on Progress in Physics, vol. 63, no. 12, pp. 1933–1995, December 2000.
[3] G. Lerosey, J. de Rosny, A. Tourin, A. Derode, G. Montaldo, and M. Fink, “Time reversal of electromagnetic waves and telecommuni-cation,” Radio Science, vol. 40, no. 5, p. RS6S12, September 2005. [4] A. E. Akogun, R. C. Qiu, and N. Guo, “Demonstrating Time Reversal in
Ultra-wideband Communications Using Time Domain Measurements,” Knoxville, Tennessee, May 8–11, 2005.
[5] G. Micolau and M. Saillard, “D.O.R.T. method as applied to electromag-netic subsurface sensing,” Radio Science, vol. 38, no. 3, pp. 4 1–4 12, May 2003.
[6] G. Micolau, M. Saillard, and P. Borderies, “DORT Method as Applied to Ultrawideband Signals for Detection of Buried Objects,” IEEE Transactions on Geoscience and Remote Sensing, vol. 41, no. 8, pp. 1813–1819, August 2003.
[7] E. Guillanton, “ ´Etude d’un syst`eme d’imagerie microonde multistatique-multifr´equence pour la reconstruction d’objets enfouis,” Ph.D. disserta-tion, Universit´e de Nice – Sophia Antipolis, December 2000. [8] V. Chatel´ee, “D´eveloppement d’un syst`eme d’imagerie microonde
mul-tistatique ultra large bande. Application `a la d´etection d’objets en r´egime temporel et fr´equentiel,” Ph.D. dissertation, Universit´e de Nice – Sophia Antipolis, December 2006.
[9] E. Guillanton, J.-Y. Dauvignac, C. Pichot, and J. Cashman, “A new design tapered slot antenna for ultra-wideband applications,” Microwave and Optical Technology Letters, vol. 19, no. 4, pp. 286–289, November 1998.
[10] I. Aliferis, T. G. Savelyev, M. J. Yedlin, J.-Y. Dauvignac, A. Yarovoy, C. Pichot, and L. P. Ligthart, “Comparison of the diffraction stack and time-reversal imaging algorithms applied to short-range UWB scattering data,” in Proceedings of the IEEE International Conference on Ultra-Wideband (ICUWB 2007), Singapore, September 24–26, 2007.