HAL Id: hal-00328250
https://hal.archives-ouvertes.fr/hal-00328250
Submitted on 17 Dec 2007HAL is a multi-disciplinary open access
archive for the deposit and dissemination of sci-entific research documents, whether they are pub-lished or not. The documents may come from teaching and research institutions in France or abroad, or from public or private research centers.
L’archive ouverte pluridisciplinaire HAL, est destinée au dépôt et à la diffusion de documents scientifiques de niveau recherche, publiés ou non, émanant des établissements d’enseignement et de recherche français ou étrangers, des laboratoires publics ou privés.
Validation and data characteristics of methane and
nitrous oxide profiles observed by MIPAS and processed
with Version 4.61 algorithm
Sébastien Payen, C. Camy-Peyret, H. Oelhaf, G. Wetzel, G. Maucher, C.
Keim, Michel Pirre, Nathalie Huret, A. Engel, M. C. Volk, et al.
To cite this version:
Sébastien Payen, C. Camy-Peyret, H. Oelhaf, G. Wetzel, G. Maucher, et al.. Validation and data characteristics of methane and nitrous oxide profiles observed by MIPAS and processed with Version 4.61 algorithm. Atmospheric Chemistry and Physics Discussions, European Geosciences Union, 2007, 7 (6), pp.18043-18111. �hal-00328250�
ACPD
7, 18043–18111, 2007 Validation of MIPAS CH4 and N2O S. Payan et al. Title Page Abstract Introduction Conclusions References Tables Figures ◭ ◮ ◭ ◮ Back CloseFull Screen / Esc
Printer-friendly Version Interactive Discussion
EGU Atmos. Chem. Phys. Discuss., 7, 18043–18111, 2007
www.atmos-chem-phys-discuss.net/7/18043/2007/ © Author(s) 2007. This work is licensed
under a Creative Commons License.
Atmospheric Chemistry and Physics Discussions
Validation and data characteristics of
methane and nitrous oxide profiles
observed by MIPAS and processed with
Version 4.61 algorithm
S. Payan1, C. Camy-Peyret1, H. Oelhaf2, G. Wetzel2, G. Maucher2, C. Keim2, M. Pirre3, N. Huret3, A. Engel4, M. C. Volk4, H. Kuellmann5, J. Kuttippurath5,*, U. Cortesi6, G. Bianchini6, F. Mencaraglia6, P. Raspollini6, G. Redaelli7, C. Vigouroux8, M. De Mazi `ere8, S. Mikuteit2, T. Blumenstock2, V. Velazco5, J. Notholt5, M. Mahieu9, P. Duchatelet9, D. Smale10, S. Wood10, N. Jones11, C. Piccolo12, V. Payne13, A. Bracher5, N. Glatthor2, G. Stiller2, K. Grunow14, P. Jeseck1, Y. Te1, K. Pfeilsticker15, and A. Butz15
1
Laboratoire de Physique Mol ´eculaire pour l’Atmosph `ere et l’Astrophysique, Universit ´e Pierre et Marie Curie-Paris 6, Paris, France
2
Institut f ¨ur Meteorologie und Klimaforschung, Forschungszentrum Karlsruhe, Karlsruhe, Germany
3
Laboratoire de Physique et Chimie de l’Environnement/CNRS, Orl ´eans, France
4
Institut f ¨ur Atmosph ¨are und Umwelt, J.W. Goethe Universit ¨at Frankfurt, Frankfurt, Germany
5
Institute of Environmental Physics/Institute of Remote Sensing, University of Bremen, Bremen, Germany
6
ACPD
7, 18043–18111, 2007 Validation of MIPAS CH4 and N2O S. Payan et al. Title Page Abstract Introduction Conclusions References Tables Figures ◭ ◮ ◭ ◮ Back CloseFull Screen / Esc
Printer-friendly Version Interactive Discussion
EGU
7
Universit `a di L’Aquila, Dipartimento di Fisica, L’Aquila, Italy
8
Belgian Institute for Space Aeronomy, Brussels, Belgium
9
Institut d’Astrophysique et de G ´eophysique, University of Li `ege (ULg), Li `ege, Belgium
10
National Institute for Water and Atmospheric Research (NIWA), Lauder, Otago, New-Zeland
11
University of Wollongong, Wollongong, Australia
12
Atmospheric, Oceanic and Planetary Physics, Dept. of Physics, Oxford Univ., Oxford, UK
13
Atmospheric and Environmental Research, Inc, Lexington, Massachusetts
14
Meteorologisches Institut der FU Berlin, Berlin, Germany
15
Institut f ¨ur Umweltphysik, University of Heidelberg, Germany
∗now at: Laboratoire de M ´et ´eorologie Dynamique, Ecole Polytechnique, Palaiseau, France
Received: 18 June 2007 – Accepted: 2 July 2007 – Published: 17 December 2007 Correspondence to: S. Payan ([email protected])
ACPD
7, 18043–18111, 2007 Validation of MIPAS CH4 and N2O S. Payan et al. Title Page Abstract Introduction Conclusions References Tables Figures ◭ ◮ ◭ ◮ Back CloseFull Screen / Esc
Printer-friendly Version Interactive Discussion
EGU
Abstract
The ENVISAT validation programme for the atmospheric instruments MIPAS, SCIA-MACHY and GOMOS is based on a number of balloon-bone, aircraft and ground-based correlative measurements. In particular the activities of validation scientists were co-ordinated by ESA within the ENVISAT Stratospheric Aircraft and Balloon Campaign of
5
ESABC. As part of a series of similar papers on other species [this issue] and in par-allel to the contribution of the individual validation teams, the present paper provides a synthesis of comparisons performed between MIPAS CH4and N2O profiles produced
by the current ESA operational software (Instrument Processing Facility version 4.61 or IPF v4.61) and correlative measurements obtained from balloon and aircraft
ex-10
periments as well as from satellite sensors or from ground-based instruments. The MIPAS-E CH4values show a positive bias in the lower stratosphere of about 10%. In
case of N2O no systematic deviation with respect to the validation experiments could
be identified. The individual used MIPAS data version 4.61 still exhibits some unphysi-cal oscillations in individual CH4and N2O profiles caused by the processing algorithm 15
(with almost no regularization). Taking these problems into account, the MIPAS CH4
and N2O profiles are behaving as expected from the internal error estimation of IPF v4.61.
1 Introduction
On 1 March 2002, the Michelson Interferometer for Passive Atmospheric Sounding,
20
MIPAS-E (Fischer and Oelhaf, 1996; ESA, 2000, Fischer et al., 2007), was launched on the Sun-synchronous polar-orbiting European ENVIronmental SATellite (ENVISAT). MIPAS is a Fourier transform spectrometer providing limb spectra of atmospheric in-frared emission between 685 cm−1 (14.60 µm) and 2410 cm−1 (4.15 µm) at a spectral unapodised resolution of 0.035 cm−1.
25
ACPD
7, 18043–18111, 2007 Validation of MIPAS CH4 and N2O S. Payan et al. Title Page Abstract Introduction Conclusions References Tables Figures ◭ ◮ ◭ ◮ Back CloseFull Screen / Esc
Printer-friendly Version Interactive Discussion
EGU second Atmospheric Chemistry Validation of ENVISAT workshop in May 2004 at
ES-RIN, Frascati, and during the first MIPAS Validation Meeting in November 2005 in Karl-sruhe) had to be compared with products generated by the latest version of the opera-tional processing software. For the MIPAS CH4and N2O profiles discussed here, the corresponding products were generated by the Instrument Processor Facility or IPF
5
v4.61.
A summary of MIPAS-E measurements, data processing, algorithm, and error bud-get is briefly described in Sect. 2.
The validation experiments and analysis methods are presented in section 3
The correlative measurements for MIPAS CH4 and N2O profiles considered here
10
(see Table 1) have been obtained by balloon experiments (Sect. 4) and by aircraft experiments (Sect. 5) participating in the ENVISAT Stratospheric Aircraft and Balloon Campaign (ESABC) coordinated by Wursteisen (2003).
An interesting complementary dataset allowing higher statistics is provided by ground-based profiles of CH4 and N2O derived by inversion of atmospheric solar ab-15
sorption spectra recorded using Fourier transform infrared spectroscopy (FTIR). The vertical resolution of the ground-based data (Sect. 6) is, however, much coarser than MIPAS data and averaging kernels have to be used for the comparison.
An interesting complementary dataset with more global coverage and allowing higher statistics is provided by satellite observations (Sect. 7).
20
Whereas balloon measurements provide trace species profiles with high vertical res-olution in most of the stratosphere, their specific constraints and limited geographical coverage make aircraft measurements interesting especially for optimising the coinci-dence or “rendez-vous” possibilities with MIPAS measurements from orbit, but with a smaller vertical coverage of the stratosphere. Since methane and nitrous oxide are
25
passive tracer in the lower stratosphere, the availability of simultaneous profiles of these 2 species affords the possibility of internal consistency checks by examining the corresponding CH4/N2O correlation plots (Sect. 8), which will be discussed in this
ACPD
7, 18043–18111, 2007 Validation of MIPAS CH4 and N2O S. Payan et al. Title Page Abstract Introduction Conclusions References Tables Figures ◭ ◮ ◭ ◮ Back CloseFull Screen / Esc
Printer-friendly Version Interactive Discussion
EGU validation scientists and balloon or aircraft operation teams has been made to achieve
good space and time coincidence with MIPAS, the number of such correlative data is only allowing a limited statistical analysis.
Finally, in Sect. 9, with the caveat that the amount of data available for comparisons is limited, some conclusions and recommendations are given.
5
2 Summary of MIPAS-E measurements, data processing, algorithm, and error
budget
2.1 Measurements
The wide mid-infrared spectral region covered by MIPAS-E enables simultaneous ob-servation of various trace gases. ENVISAT orbits the Earth once every ∼100 min,
10
resulting in ∼14 polar orbits per day. During the original standard observation mode, which generally was the nominal one until 26 March 2004, the field-of-view is 30 km in the horizontal and about 3 km in the vertical at the tangent points. One limb scan of the standard observation mode covers the altitude range of 6–68 km in 17 steps with tangent altitude distance of 3 km for the 13 lower tangent altitudes, followed by tangent
15
point around 47 km, 52 km, 60 km and 68 km. These measurements cover the whole latitude band from pole to pole with 14.3 orbits per day and about 73 limb scans along one orbit.
Generation of calibrated, so-called level-1B radiance spectra is described in Nett et al. (2002). Several data analysis schemes have been developed for near-real time and
20
off-line retrieval of profiles of atmospheric trace species from calibrated MIPAS spectra provided by the European Space Agency (ESA) (von Clarmann et al., 2003).
During the period from mid-May until mid-October 2003 MIPAS operated quasi-continuously, with the exception of the periods 19–20 May, 25 May–4 June and 5–7 September, where no data are available.
25
ACPD
7, 18043–18111, 2007 Validation of MIPAS CH4 and N2O S. Payan et al. Title Page Abstract Introduction Conclusions References Tables Figures ◭ ◮ ◭ ◮ Back CloseFull Screen / Esc
Printer-friendly Version Interactive Discussion
EGU processor under ESA responsibility (Raspollini et al., 2006).
2.2 Error budget
The MIPAS L2 products contain estimates of random error derived from the propaga-tion of the radiometric noise through the retrieval. The noise itself varies with time, steadily rising between decontamination events, but its contribution to the L2 random
5
error also depends on the atmospheric temperature, which controls the total radiance received. Hence, for all species, the random error varies latitudinally/seasonally with atmospheric temperature, with a superimposed time dependence on decontamination events.
The main source of the random error of the ESA L2 Offline MIPAS profiles is the
10
noise error due to the mapping of the radiometric noise in the retrieved profiles. This predicted random error is proportional to the NESR (Noise Equivalent Spectral Radi-ance) and inversely proportional to the Planck function (therefore atmospheric temper-ature), but it does not directly depend on the VMR of the gases.
In the ESA retrieval processing, first, temperature and tangent pressure are retrieved
15
simultaneously, then the 6 “key species” (H2O, O3, NO3, CH4, N2O and NO2) VMR
pro-files are retrieved individually in sequence. The effects of temperature and pressure errors on the VMR retrievals are taken into account in the predicted random error esti-mation.
The MIPAS noise error is the covariance matrices given in the MIPAS level 2
prod-20
ucts. The systematic errors are described in Dudhia et al. (2002) and can be find in the Oxford web page (www.atm.ox.ac.uk/group/mipas/err) where errors are divided into systematic errors with random variability and in purely systematic errors, with one ex-ception: the altitude shift has been taken as a systematic error with random variability. The total error is the root sum square of systematic error and random error
com-25
ponents. The random errors take into account the propagation of instrument noise through the retrieval. The definition of systematic error here includes everything which is not propagation of the random instrument noise through the retrieval. However, to
ACPD
7, 18043–18111, 2007 Validation of MIPAS CH4 and N2O S. Payan et al. Title Page Abstract Introduction Conclusions References Tables Figures ◭ ◮ ◭ ◮ Back CloseFull Screen / Esc
Printer-friendly Version Interactive Discussion
EGU use these errors in a statistically correct manner for comparisons with other
measure-ments is not straightforward. Each systematic error has its own length/time scale: on shorter scales it contributes to the bias and on longer scales contributes to the SD of the comparison. Fortunately, two of the larger systematic errors (propagation of error due to pressure and temperature retrieval, and spectroscopic database errors) can be
5
treated properly. The p/T propagation error is uncorrelated between any two MIPAS profiles (since it is just the propagation of the random component of the p/T retrieval error through the VMR retrieval). Spectroscopic database errors are constant but of unknown sign, so will always contribute to the bias of any comparison. Of the other significant errors, the calibration-related errors should, in principle, be uncorrelated
be-10
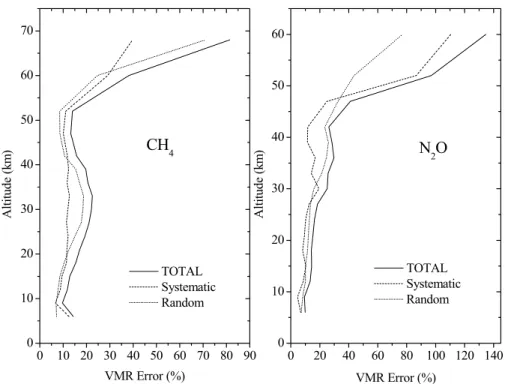
tween calibration cycles however analysis of the residuals suggests that these errors are almost constant so could be included in the bias. Figure 1 presents for CH4and for
N2O the vertical distribution of random, systematic and total errors for a global
com-posite of the five reference atmospheres, with twice the weight given to results from the polar winter case.
15
3 Validation experiments and analysis methods
The correlative measurements for MIPAS CH4and N2O profiles considered here (see Table 1) have been obtained from a large number of in situ and remote sensing instru-ments carried out from ground, balloon, aircraft and satellite platforms participating in the ENVISAT Stratospheric Aircraft and Balloon Campaign (ESABC) coordinated by
20
(Wursteisen, 2003).
The coincidence criteria recommended for the intercomparison were set to 300 km and 3 h. However, some individual research groups involved in the validation work pre-sented here have used more relaxed criteria whenever justified on the basis of previous experiences. Representation of CH4and N2O volume mixing ratio (VMR) vertical pro-25
files is preferred versus pressure than altitude. Another requirement to be considered for intercomparison of polar winter measurements has been a recommended maximum
ACPD
7, 18043–18111, 2007 Validation of MIPAS CH4 and N2O S. Payan et al. Title Page Abstract Introduction Conclusions References Tables Figures ◭ ◮ ◭ ◮ Back CloseFull Screen / Esc
Printer-friendly Version Interactive Discussion
EGU potential vorticity (PV) difference of: ∆PV/PV<15%.
In addition, a reduction of vertical smoothing differences using averaging kernels and common a priori state are used when needed, i.e. when vertical resolution resolu-tion of MIPAS-E and correlative measurements are significantly different. For a given correlative experiment considered in this paper, precision are given in the text, when
5
smoothing is applied.
The use of trajectory calculations to increase the number of coincidences (with the same baseline collocation criteria adopted for direct coincidences) has been used.
4 Comparison with validation balloon campaign data
The balloon experiments for which CH4and/or profiles N2O (as well as the
correspond-10
ing MIPAS data) were available, include FTIR remote sensing instruments operating in limb thermal emission such as IBEX (Biancini et al., 2003) in the far-infrared and MIPAS-B (Friedl-Vallon et al., 2004) or in solar occultation such as LPMA (Camy-Peyret et al., 1995) as well as in situ samplers such as the Bonbon cryosampler (Engel et al., 1998) and in situ diode laser spectrometers such as SPIRALE (Moreau et al., 2005).
15
They are discussed in sequence, a priority being given to the balloon experiments of the 2002 campaigns for which IPF v4.61 MIPAS CH4and N2O profiles are available.
4.1 IBEX
The IBEX (Infrared Balloon Experiment, Istituto di Fisica Applicata “Nello Carrara”, IFAC CNR, Firenze, Italy) (Bianchini, 2003) is a far-infrared Fourier transform
spec-20
trometer, which was flown during the first campaign of ESABC from Sicily (Trapani-Milo; 38 N, 12 E) over the Mediterranean to Spain on 28–29 July 2002. Because there was no coincidence between the period when IBEX was at float and an overpass of EN-VISAT, the data used for comparison was taken from MIPAS-E limb scans performed over the Mediterranean within a ±1 day window covering the IBEX measurements.
ACPD
7, 18043–18111, 2007 Validation of MIPAS CH4 and N2O S. Payan et al. Title Page Abstract Introduction Conclusions References Tables Figures ◭ ◮ ◭ ◮ Back CloseFull Screen / Esc
Printer-friendly Version Interactive Discussion
EGU The comparison with MIPAS v4.61 data is based on trajectory calculations performed
by using the Global Trajectory Model of Universit `a di L’Aquila, since no direct coinci-dence satisfying the standard criteria of 300 km, 3 h was available for the IBEX balloon flight. Figure 2 shows the mean relative difference (red crosses) for matching pairs of MIPAS and IBEX data (with forward and back-trajectories up to 4 days), along with the
5
combined precision (blue line) and combined total (green line) errors. The data plotted in Fig. 2 shows a reasonable agreement in the mid stratosphere with some dispersion of the balloon data. The MIPAS-E values in the very lower stratosphere present a pos-itive bias with respect to IBEX values, a situation which is also seen in other correlative measurements (see below).
10
4.2 MIPAS-B
ENVISAT validation flights were carried out with the cryogenic Fourier transform in-frared spectrometer MIPAS-B, the balloon-borne version of MIPAS, from Aire-sur-l’Adour (France, 44◦N) on 24 September 2002, Kiruna (Sweden, 68◦N) on 20/21 March 2003, and again from Kiruna on 3 July 2003. MIPAS-B measures all atmospheric
15
parameters that MIPAS is covering. Essential for the balloon instrument is the so-phisticated line of sight stabilization system, which is based on an inertial navigation system and supplemented with an additional star reference system. Averaging several spectra during one single elevation angle yields to a reduction of the noise equivalent spectral radiance (NESR) and therefore to an improvement of the signal to noise
ra-20
tio. The MIPAS-B data processing including instrument characterization is described in Friedl-Vallon et al. (2004) and references therein. Retrieval calculations of atmospheric target parameters were performed with a least squares fitting algorithm (using analyti-cal derivative) of spectra simulated by the Karlsruhe Optimized and Precise Radiative transfer Algorithm (KOPRA; Stiller et al., 2002; H ¨opfner et al., 2002). A
Tikhonov-25
Phillips regularization approach constrained with respect to the shape of an a priori profile was adapted. The resulting vertical resolution lies typically between 2 and 3 km and is therefore comparable to the vertical resolution of MIPAS-E. Target parameters
ACPD
7, 18043–18111, 2007 Validation of MIPAS CH4 and N2O S. Payan et al. Title Page Abstract Introduction Conclusions References Tables Figures ◭ ◮ ◭ ◮ Back CloseFull Screen / Esc
Printer-friendly Version Interactive Discussion
EGU are analyzed in MIPAS-B proven microwindows. An overview on the MIPAS-B data
analysis is given in Wetzel et al. (2006) and references therein.
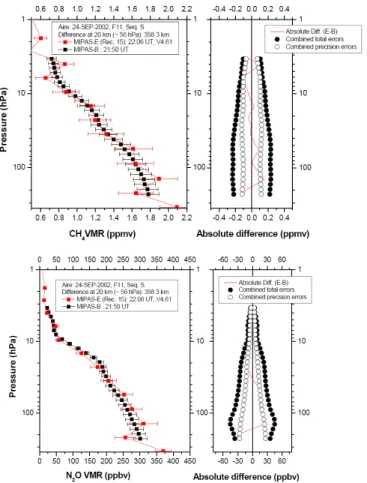
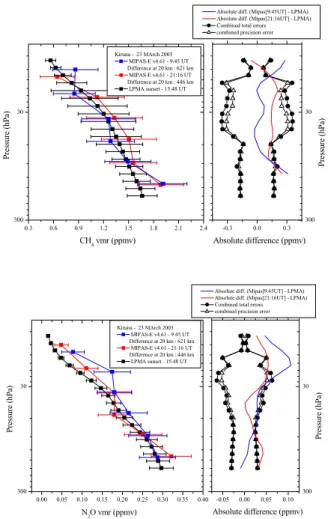
The measurements of three MIPAS-B flights have been used in this paper : (a) Flight 11 (F11), 24 September 2002, Aire-sur-l’Adour, sequence S and N3; (b) Flight 13 (F13), 20/21 March 2003, Kiruna, sequence N3a and D15c; (c) Flight 14 (F14), 3 July
5
2003, Kiruna, sequence 3.
For F11 one finds two MIPAS-E comparisons (Rec. 14 and Rec. 15 from orbit 2975) to MIPAS-B sequence S. At low altitudes (15 km, 120 hPa), the horizontal distance between both sensors is quite large for Rec. 15 (ca. 460 km). For F13 MIPAS-E, orbits 5508 and 5515 were used for the comparison and concerning F14 the MIPAS-E data
10
from orbit 7004 have been compared to MIPAS-B. An extremely good space and time coincidence was achieved during the MIPAS-B flight of 24 September 2002 from Aire-sur-l’Adour (43◦N, 0◦E). The vertical mixing ratio profiles of CH4 and N2O and the
corresponding errors are plotted as a function of pressure for the MIPAS IPF v4.61 together with the balloon profile. An example of the comparison for a single flight
15
sequence (sequence S of flight 11) is given in Fig. 3.
The mean deviations between MIPAS-B and MIPAS for all balloon flights together are shown in Fig. 4. The differences MIPAS-B minus MIPAS-E v4.61 have been com-pared with the combined (root sum squares) error and demonstrate the impact of the remaining “oscillations”: the mixing ratio values of MIPAS-E around 100 and 300 hPa
20
are clearly overestimated and underestimated, respectively for both species. 4.3 Bonbon
The flight of the cryosampler Bonbon (Engel et al., 1998) of Institut f ¨ur Meteorologie und Geophysik, J. W. Goethe Universit ¨at, Frankfurt, Germany, took place the same day as the MIPAS-B flight on 24 September 2002, also from Aire-sur-l’Adour. The v4.61
25
MIPAS-E CH4and N2O mixing ratio profiles from 3 limb scans are plotted as a function
of altitude on the left panel of Fig. 5, whereas a larger statistics is achieved by combin-ing five-days forward and backward trajectories “MIPAS-E transported” profiles (shown
ACPD
7, 18043–18111, 2007 Validation of MIPAS CH4 and N2O S. Payan et al. Title Page Abstract Introduction Conclusions References Tables Figures ◭ ◮ ◭ ◮ Back CloseFull Screen / Esc
Printer-friendly Version Interactive Discussion
EGU on the right panel) matching the cryosampler profile. The picture emerging from this
comparison is slightly different from the previous comparison in the mid stratosphere, where MIPAS-E results appear to have a negative bias. But the overestimation of CH4
by MIPAS-E in the very lower stratosphere seems to be confirmed. 4.4 SPIRALE
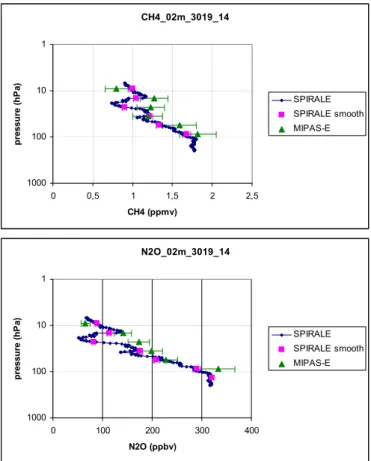
5
The SPIRALE instrument (Moreau et al., 2005) from Laboratoire de Physique et Chimie de l’Environnement (LPCE, Orl ´eans, France) is a fast measurement rate in situ diode laser spectrometer. Two flights of SPIRALE took place in the framework of the EN-VISAT validation, firstly at mid-latitude in the fall 2002 during the ESABC campaign from Aire-sur-l’Adour, and secondly at high latitude on 21 January 2003 from Kiruna. For
10
these two flights a detailed analysis of the vertical structure of the stratosphere based on the N2O and CH4measurements obtained has been made by Huret et al. (2006).
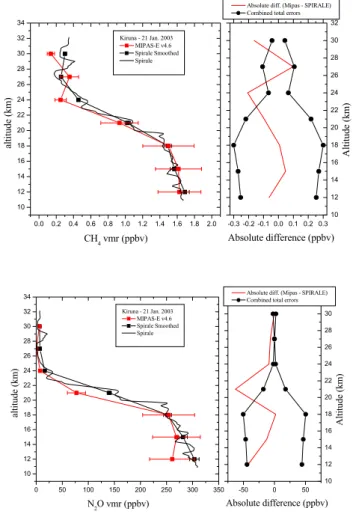
Figure 6 presents the comparison of SPIRALE and MIPAS-E profiles, for CH4 and
N2O respectively, measured on 21 January 2003. In order to take into account the
large difference between SPIRALE and MIPAS-E vertical resolution (150 m and 3 km
15
respectively), the CH4and N2O SPIRALE profiles have been smoothed using
MIPAS-E averaging kernels. A good agreement is obtained from 12 km up to 24 km. Above 24 km for CH4the absolute difference between the two set of data is increasing. It can be noticed that the SPIRALE instrument has intercepted a thin PV filament at 28 km, in this layer the volume mixing ratios of each species is enhanced (Huret et al., 2006).
20
This thin layer is not observed by MIPAS because of its coarser vertical resolution. Since MIPAS was not operating on 2 October 2002 when SPIRALE was launched for its second flight, the comparison is only possible with backward trajectories starting from MIPAS measurements on 26, 27 and 28 September and ending at the SPIRALE location on 2 October. The SPIRALE flight took place in pre-vortex formation
condi-25
tions when air mass exchanges between tropics region and polar region occur. The abundance of long lived species is largely modified by these exchanges leading in par-ticular to non monotonic profiles. Air mass origin discussed using N2O-CH4correlation
ACPD
7, 18043–18111, 2007 Validation of MIPAS CH4 and N2O S. Payan et al. Title Page Abstract Introduction Conclusions References Tables Figures ◭ ◮ ◭ ◮ Back CloseFull Screen / Esc
Printer-friendly Version Interactive Discussion
EGU in Huret et al. (2006) are very different as a function of altitude. Then before
compar-ing the MIPAS data to SPIRALE measurements we must check for the consistency of dynamical conditions using a potential vorticity analysis. This is performed with the MIMOSA PV contour advection model (Hauchecorne et al., 2002).
Backward trajectories ending at the location of the SPIRALE profiles (43◦.6 N–0◦E) 5
on 2 October 2002 (07:15–08:30 UT at the ascent and 09:15–10:30 UT at the descent) have been computed as a function of potential temperature with increments of 25 K (∼1 km). Profiles 14 and 15 of orbit 3019 have been shown to be the best possible profiles to be compared with SPIRALE. These profiles have been measured close to 00:00 UT on 28 September, 4.5 days before SPIRALE. Latitude and longitude of profile
10
14 are respectively 42◦N–335◦E. Latitude and longitude of profile 15 are respectively
46◦.5 N–334◦E.
The distance between the points on the trajectories at the time of the MIPAS mea-surements is varying from 100 km to 2100 km. SPIRALE data may be used to validate MIPAS if a set of trajectories ending close to each point of the SPIRALE profile (+/–0◦.5
15
in latitude,+/–0◦.5 in longitude,+/–250 m) is verifying the two following criteria : (a) the PV is conserved on the 4.5 days which separate between MIPAS and SPIRALE mea-surements and (b) the PV differences between MIPAS and SPIRALE on each isentropic surface is small. From this analysis we conclude that SPIRALE data may be used to validate : MIPAS profile 14 of orbit 3019 for MIPAS nominal altitudes 18, 21, 24, 30 and
20
33 km,
As we can see on Fig. 7 the SPIRALE instrument resolves atmospheric fine struc-tures during ascent (or descent) of the payload and the comparison with the MIPAS values transported by trajectory mapping to the SPIRALE geolocation is within the combined errors bars.
25
4.5 LPMA
The LPMA (Limb Profile Monitor of the Atmosphere) is a remote sensing infrared Fourier transform instrument operating in absorption against the sun (Camy-Peyret
ACPD
7, 18043–18111, 2007 Validation of MIPAS CH4 and N2O S. Payan et al. Title Page Abstract Introduction Conclusions References Tables Figures ◭ ◮ ◭ ◮ Back CloseFull Screen / Esc
Printer-friendly Version Interactive Discussion
EGU et al., 1995). Its high spectral resolution and sensitivity allow the retrieval of vertical
profiles of trace species having stratospheric mixing ratios as small as 0.1 ppbv. The measurements of three flights have been used for the validation of MIPAS CH4 and
N2O vertical profiles. As an example of LPMA measurements, during the flight
per-formed on 24 March 2004, the Sun was acquired above a rather elevated cloud deck
5
at about 10 km. The first complete interferograms (after proper setting of the gains of the preamps for each channel) have been obtained just above 10 km. From that point on, the primary pointing system, the heliostat, the interferometer and all the ancillary equipments performed nominally during ascent, float and occultation up to loss of sun, again behind the high cloud cover (∼10 km). The 180 recorded spectra show sufficient
10
absorption by CH4and N2O for precise retrieval in the appropriate micro-windows. The LPMA flight observations started at 14:31 UT (the balloon was at an altitude of 10 km during its ascent), the float was reached at 16:03 UT and occultation measurements (conventionally distinguished from ascent measurements as pertaining to negative so-lar elevation angles) have been recorded until loss of Sun at 17:29 UT.
15
The slant column density (SCD) retrieval of N2O, CH4, O3, NO2, NO, HNO3,
H2O, HCl, CO2 and ClONO2 is performed simultaneously using a multi fit of 11 micro-windows. The target micro-window for N2O and CH4 are around 1240.38 to
1243.65 cm−1. In addition CH4appears as an interfering absorber in the O3, NO2, HCl
and HNO3target windows whereas N2O contribute in the HNO3target window. These
20
contributions need to be included for a reliable SCD retrieval. Based on absorption line parameters from HITRAN 2004 (Rothman et al., 2005) and a reasonable a priori guess for the trace gas profiles, a forward model calculates synthetic spectra which are fitted to the measured ones by a non-linear Levenberg-Marquardt algorithm. The cal-culation of the synthetic spectra relies on atmospheric parameters taken from nearby
25
radiosonde launches and climatological and meteorological model data. Fitting param-eters include a polynomial of up to third order, a small additive wavenumber shift and several parameters to adjust the instrumental line shape (ILS). All auxiliary ILS param-eters are determined separately in various test runs and finally set to a fixed value for
ACPD
7, 18043–18111, 2007 Validation of MIPAS CH4 and N2O S. Payan et al. Title Page Abstract Introduction Conclusions References Tables Figures ◭ ◮ ◭ ◮ Back CloseFull Screen / Esc
Printer-friendly Version Interactive Discussion
EGU all spectra during a balloon flight.
The error bars comprise the statistical error of the fitting routine (1σ), the uncertainty in determining the instrumental line shape, the error coming from the ambient atmo-spheric parameters and their impact on the spectroscopic parameters and the stated error bars of the latter (in total 10% systematic contribution for both gases). Each
spec-5
trum yields an N2O and CH4 SCD according to the specifications described above.
Vertical trace gas profiles are then inferred during balloon ascent and solar occultation. For more details on LPMA retrieval and data analysis see Payan et al. (1998, 1999) and Dufour et al. (2005).
The vertical mixing ratio profiles of CH4and N2O and the corresponding errors have 10
been plotted as a function of pressure for the MIPAS IPF v4.61 together with the balloon profile. An example is given in Fig. 8 for flight LPMA20 taking place 20 March 2003 from Kiruna.
5 Comparison with simultaneous aircraft measurements
Several papers submitted to ACPD cover in details the comparison between MIPAS-E
15
and ACE measurements of CH4 (De Mazi `ere et al., 2007
1
), between MIPAS-E and ACE measurements of N2O (Strong et al., 20072), and between MIPAS-E and Aura
1
De Mazi `ere, M., Vigouroux, C., Bernath, P. F., Baron, P., Blumenstock, T., Boone, C., Brogniez, C., Catoire, V., Coffey, M., Duchatelet, P., Griffith, D., Hannigan, J., Kasai, Y., Kramer, I., Jones, N., Mahieu, E., Manney, G. L., Piccolo, C., Randall, C., Robert, C., Senten, C., Strong, K., Taylor, J., T ´etard, C., Walker, K. A., and Wood, S.: Validation of ACE-FTS v2.2 methane profiles from the upper troposphere to lower mesosphere, Atmos. Chem. Phys. Discuss., submitted, 2007.
2
Strong, K., Wolff, M. A., Kerzenmacher, T., et al.: Validation of ACE-FTS N2O
ACPD
7, 18043–18111, 2007 Validation of MIPAS CH4 and N2O S. Payan et al. Title Page Abstract Introduction Conclusions References Tables Figures ◭ ◮ ◭ ◮ Back CloseFull Screen / Esc
Printer-friendly Version Interactive Discussion
EGU Microwave Limb Sounder measurements of N2O (Lambert et al., 2007
3
). These papers report differences generally consistent with the reported systematic uncertainties. 5.1 In situ and remote sensing payload aboard the Geophysica
Within the ESABC, three campaigns have been carried out with the M55-Geophysica high altitude aircraft in mid-latitude (Forl`ı, Italy, July and October 2002) and Arctic
re-5
gions (Kiruna, Sweden, March 2003). All the flights have been planned and performed with the goal of a very good coincidence between the geolocations of MIPAS-ENVISAT profiles and the profiles measured by the Geophysica payload. Profiles of N2O and/or
CH4have been measured by the in situ instrument HAGAR and the two remote sensing
instruments MIPAS-STR and SAFIRE-A.
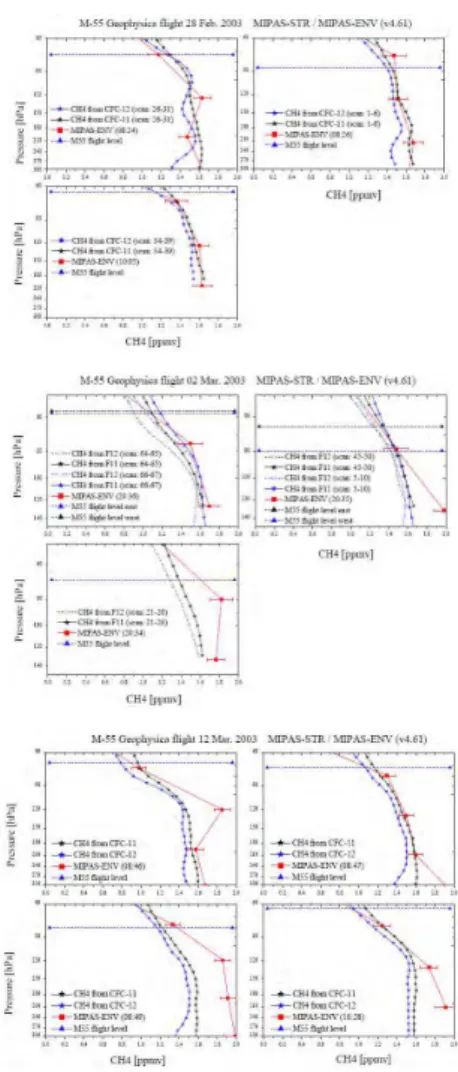
10
MIPAS-STR (MIPAS-STRatospheric aircraft, FZK-IMK, Karlsruhe, Germany) is a limb viewing Fourier transform spectrometer, measuring the atmospheric emission in the thermal infrared spectral region (Piesch et al., 1996; Keim et al., 2004). Its charac-teristics and performance is comparable to the satellite version MIPAS-ENVISAT. The retrieval of the vmr-profiles is performed on a fixed altitude grid (steps of 0.5 km below
15
20 km). For the validation purpose, at each satellite geolocation, six collocated MIPAS-STR profiles have been averaged. CH4 and N2O profiles have been determined from
the measured CFC-11 and CFC-12 profiles by use of the correlations measured by HAGAR. There are two dominating error sources in the retrieval chain. First, the er-ror in the used temperature profile is estimated to be 2 K, which results in an erer-ror
20
of 5% in CFC-11 and CFC-12. The second error source is connected to the use of
3
Lambert, A., Read, W. G., Livesey, N. J., Santee, M. L., Manney, G. L., Froidevaux, L., Wu, D. L., Schwartz, M. J., Pumphrey, H. C., Jimenez, C., Nedoluha, G. E., Coeld, R. E., Cuddy, D. T., Daffer, W. H., Drouin, B. J., Fuller, R. A., Jarnot, R. F., Knosp, B. W., Pickett, H. M., Perun, V. S., Snyder, W. V., Stek, P. C., Thurstans, R. P., Wagner, P. A., Waters, J. W., Jucks, K. W., Toon, G. C., Stachnik, R. A., Bernath, P. F. Boone,, C. D., Walker, K. A., Urban, J., Murtagh, D., Elkins, J. W., and Atlas, E.: Validation of the Aura Microwave Limb Atmos. Chem. Phys. Discuss., submitted, 2007.
ACPD
7, 18043–18111, 2007 Validation of MIPAS CH4 and N2O S. Payan et al. Title Page Abstract Introduction Conclusions References Tables Figures ◭ ◮ ◭ ◮ Back CloseFull Screen / Esc
Printer-friendly Version Interactive Discussion
EGU HITRAN spectral line data for the radiative transfer calculation in the forward model,
and this error is estimated to be below 10%. Effects such as non-LTE, uncertainties in the pointing of the instrument, horizontal atmospheric inhomogeneity along the line of sight, or the error of the used correlation can cause further errors, which were consid-ered of minor importance. As the dominating error sources are independent, they sum
5
up to below 11%. The N2O profiles of MIPAS-STR are plotted in Fig. 9 as a function of
tangent pressure, together with the coinciding profiles of MIPAS-E. The vertical mixing ratio profiles of CH4are plotted in Fig. 10. The IPF algorithm retrieves the vmr only on tangent altitudes. This makes regularization unnecessary, but results in a zigzagging, observable in more or less all N2O and CH4 profiles. On 22 July 2002 (not presented 10
in Fig. 9 and Fig. 10) there is an unrealistic high vmr at ≈18 hPa in both MIPAS-E N2O
profiles. Also the corresponding CH4 profiles of this day show problems. Both IPF
versions (v4.55 and v4.61) do indeed present “oscillations” which are not observed in the MIPAS-STR profiles. In opposite to N2O (see Fig. 10), where the profiles oscil-late around the MIPAS-STR values, some CH4 profiles have either separate outliers 15
(e.g. Fig. 9, 12 March 2003, upper left panel) and some profiles are completely dif-ferent to the MIPAS-STR measurement (e.g. Fig. 9, 12 March 2003, lower left panel). This kind of problems can not be explained only by the omitted regularization.
5.2 SAFIRE-A
SAFIRE-A (Spectroscopy of the Atmosphere by using Far-Infrared Emission –
Air-20
borne, IFAC-CNR, Firenze, Italy) is also a limb viewing FT spectrometer, but measures the far infrared (10–250 cm−1) atmospheric emission in narrow bands (1–2 cm−1). Its characteristics and performance are described by Bianchini et al. (2004).
The geolocation of the SAFIRE-A limb scans and of the corresponding MIPAS-E tangent points is presented in Fig. 11 for the M-55 flight of 24 October 2002,
demon-25
strating the high degree of coincidence between aircraft and satellite measurements. The N2O mixing ratio values are plotted in Fig. 12 for MIPAS-E limb scan 15 and for the corresponding SAFIRE-A data. Clearly around the 100 hPa level, MIPAS-E presents
ACPD
7, 18043–18111, 2007 Validation of MIPAS CH4 and N2O S. Payan et al. Title Page Abstract Introduction Conclusions References Tables Figures ◭ ◮ ◭ ◮ Back CloseFull Screen / Esc
Printer-friendly Version Interactive Discussion
EGU a positive bias with respect to correlative measurements as already noticed for other
comparisons in the UT/LS.
5.3 ASUR aboard the German Falcon
ASUR is a passive heterodyne receiver operating in the frequency range of 604.3 to 662.3 GHz (Mees et al., 1995; von Koenig et al., 2000). It is equipped with two
5
spectrometers, an Acousto Optical Spectrometer (AOS) and a Chirp Transform Spec-trometer (CTS). Stratospheric measurements performed with the AOS are used in this comparison study. The total bandwidth of the AOS is 1.5 GHz and its resolution is 1.27 MHz. In order to avoid absorption by tropospheric water vapor, observations are carried out aboard a research airplane. The instrument looks upward at a stabilized
10
constant zenith angle of 78◦. ASUR measures thermal emission around rotational lines of the target molecule. The shape of the pressure broadened line is related to the ver-tical distribution of the trace gas. Measured spectra are integrated up to 150 s, which leads to a horizontal resolution of about 30 km along the flight path. Vertical profiles of the molecule are retrieved in an equidistant altitude grid of 2 km spacing using the
15
Optimal Estimation Method (Rodgers, 1976). Vertical resolution of the N2O
measure-ments is about 8–16 km and vertical range is from 16 to 45 km. The precision of a single measurement is 10 ppb and the accuracy is 15% or 30 ppb, whichever is higher, including systematic uncertainties. Details about the measurement technique and re-trieval theory can be found in Bremer et al. (2002) and in Kuttippurath (2005).
20
The ASUR N2O measurements performed during the SCIAVALUE (Sciamachy Val-idation and Utilization Experiment) campaign (Fix et al., 2005) are used here. Data from 14 selected ASUR measurement flights during the campaign are analyzed. De-tails about the flights are given in Table 2. The MIPAS off line IPF v4.61 are considered. A criterion that the ASUR measurements are within +/–1000 km and in +/–12 h around
25
the satellite observations is chosen for the comparison between datasets. This crite-rion resulted in 323 coincident measurements (from 14 flights) with the IPF data. The MIPAS volume mixing ratios are convolved with the ASUR N2O averaging kernels to
ACPD
7, 18043–18111, 2007 Validation of MIPAS CH4 and N2O S. Payan et al. Title Page Abstract Introduction Conclusions References Tables Figures ◭ ◮ ◭ ◮ Back CloseFull Screen / Esc
Printer-friendly Version Interactive Discussion
EGU account for the lower vertical resolution of the ASUR profiles. The difference ∆ VMR
= ASUR – MIPAS is calculated from the individual ASUR and MIPAS profiles. These delta profiles are averaged over the tropics (5 S–30 N), mid-latitudes (30 N–60 N), and high latitudes (60 N–90 N). Results are presented in terms of these latitude bands sep-arately.
5
Figure 13 shows the results from the comparison between ASUR and IPF v4.61 profiles. There are 101 coincident measurements in the tropics, 38 in mid-latitudes and 184 in high-latitudes. The differences range from –18 to 48 ppb in the tropics, 2 to 31 ppb in the mid-latitudes and –10 to 13 ppb in the high latitudes. The deviation is largest at 24–28 km altitude for all latitude bands, in which the tropical profile shows the
10
highest deviation of about 48 ppb. It is found that the MIPAS profiles underestimate the ASUR VMRs in the altitude range 25–30 km and overestimate the ASUR values above 34 km. However, agreement between the profiles appears to be very good at mid and high latitudes above 30 km altitude.
In comparison with the MIPAS datasets in the tropics and mid-latitudes, there seems
15
to be a systematic difference. Temporary atmospheric variations and the reduced alti-tude resolution of ASUR can hardly explain these systematic deviations. We note that the N2O values in the tropical lower stratosphere retrieved from ASUR measurements
seem relatively high. Comparisons with Odin/SMR have also shown this particular fea-ture of ASUR N2O retrievals (Urban et al., 2005). However, for mid and high latitudes
20
and for the lower values of N2O, agreement between ASUR and MIPAS profiles is very
good. This was also true for comparison between ASUR and SMR profiles (Urban et al., 2005). The differences in these latitude and altitude regions are well within the ASUR error bars.
ACPD
7, 18043–18111, 2007 Validation of MIPAS CH4 and N2O S. Payan et al. Title Page Abstract Introduction Conclusions References Tables Figures ◭ ◮ ◭ ◮ Back CloseFull Screen / Esc
Printer-friendly Version Interactive Discussion
EGU
6 Comparison with ground-based measurements
6.1 FTIR products
Within the framework of NDACC (Network for the Detection of Atmospheric Compo-sition Change, former NDSC or Network for the Detection of Stratospheric Change), FTIR spectrometers are operated at various stations worldwide on a regular basis.
5
These instruments record solar absorption spectra from which one can retrieve the abundances of a large number of atmospheric constituents. In this work, we will present results from data recorded at Ny-Alesund (78.9◦N, 11.9◦E, 20 m a.s.l.), Kiruna (67.8◦N, 20.4◦E, 420 m a.s.l.), Jungfraujoch (46.5◦N, 8.0◦E, 3580 m a.s.l.), Wollon-gong (34.4◦S, 150.9◦E, 30 m a.s.l.), Lauder (45.0◦S, 169.7◦E, 370 m a.s.l.), and Arrival
10
Heights (77.8◦S, 166.7◦E, 200 m a.s.l.). In addition to total columns, low vertical res-olution profiles are retrieved from the spectra by using the Optimal Estimation Method of Rodgers (2000) in the inversion programs. For the Kiruna data, the inversion code used is PROFFIT (PROFile FIT) (Hase, 2000, 2004), based on the forward model KO-PRA (Karlsruhe Optimized Precise Radiative transfer Algorithm) (H ¨opfner et al., 1998).
15
For all other stations, the retrievals have been performed using the SFIT2 algorithm (Pougatchev et al., 1995a, b; Rinsland et al., 1998). The PROFFIT and SFIT2 codes have been cross-validated successfully by Hase et al., 2004. In all cases, the syn-thetic spectra were calculated using daily pressure and temperature data of the Na-tional Centers for Environmental Prediction (NCEP). All retrieval parameters (spectral
20
microwindows, spectroscopic parameters, instrumental line shape, a priori information, and model parameters) have been optimized independently for each station. For the N2O retrievals, all stations used the spectroscopic line parameters from the HITRAN
2000 database including official updates through 2001 (Rothman et al., 2003). For the CH4 retrievals, the northern hemisphere stations used the HITRAN 2000 database, 25
while the southern hemisphere stations used the HITRAN 2004 database (Rothman et al., 2005).
ACPD
7, 18043–18111, 2007 Validation of MIPAS CH4 and N2O S. Payan et al. Title Page Abstract Introduction Conclusions References Tables Figures ◭ ◮ ◭ ◮ Back CloseFull Screen / Esc
Printer-friendly Version Interactive Discussion
EGU signal (DOFS) are about 3 for CH4 at all stations except Ny-Alesund (4) and about
3.6 for N2O at all the stations except Ny-Alesund and Jungfraujoch (4.5). Thus for the
comparisons with MIPAS, it is more relevant to consider a limited number of partial columns containing independent information. The lower altitude limit for the partial column comparisons is determined by the MIPAS measurements and is about 12 km.
5
The upper altitude limit for the comparisons is chosen taking into account the ground-based FTIR sensitivity which is reasonable up to around 30 km for both molecules at all stations. The DOFS within these partial columns limits are about 1.4 for CH4at all
stations except at Kiruna (1.0) and Ny-Alesund (2.0), and about 1.7 for N2O for the
three southern hemisphere stations and 1.3, 2.3 and 2.7 for Kiruna, Ny-Alesund and
10
Jungfraujoch, respectively . 6.2 Comparison methodology
In this work, the ground-based FTIR data are used to validate MIPAS ESA data v4.61 for the period when the instrument was operating at its full spectral resolution (i.e., from 6 July 2002 to 26 March 2004). The selected coincidence criterions were temporal and
15
spatial distances of, respectively, ± 3 h and ± 300 km maximum at the MIPAS nominal tangent height of 21 km. For Wollongong, the number of coincidences found using these criteria is very small, so we decided to include the results of comparisons using relaxed coincidence criteria of ± 4 h and ± 400 km distance.
When the spatial variability of the target gas is high, such as in winter-spring at
20
high latitude stations, the standard deviations of the comparisons would become large and would not represent the agreement between both measurements. This is due to 1) the collocation error of the air masses, and 2) the horizontal smoothing error which corresponds to the gradient of the target gas within the instruments’ line of sight (Cortesi et al., 2006, Sect. 4; von Clarmann et al., 2006). For the Kiruna data an
25
additional PV criterion of 15% difference has been applied to reduce the collocation error. But, as this does not necessarily reduce the smoothing error, we decided to show also comparisons for limited time periods for which the spatial variability is smaller
ACPD
7, 18043–18111, 2007 Validation of MIPAS CH4 and N2O S. Payan et al. Title Page Abstract Introduction Conclusions References Tables Figures ◭ ◮ ◭ ◮ Back CloseFull Screen / Esc
Printer-friendly Version Interactive Discussion
EGU (summer-autumn for high latitude stations).
To avoid a possible geometric altitude error in the MIPAS data, the comparisons between MIPAS and FTIR measurements are made on a pressure grid. The MIPAS profiles are degraded to the lower vertical resolution of the ground-based FTIR mea-surements by smoothing the MIPAS profiles with the averaging kernels of the
ground-5
based FTIR data. Thus, smoothed MIPAS profiles have been used in the comparisons of profiles and partial columns.
The statistics of the profiles and partial columns comparisons are given (in percent-ages) in the tables and figures of the next sections. The relative differences between MIPAS and FTIR products are calculated by taking the mean absolute difference
be-10
tween MIPAS and FTIR data (MIPAS-FTIR), divided by the mean FTIR value. The means (M) of the statistical comparisons (i.e., the biases) will be compared to the 3σ standard errors on the means (SEM) to discuss their statistical significance. The SEMs are calculated as 3×STD/√N, N being the number of coincidences, and STD the standard deviation of the differences. The precision of the instruments will also
15
be discussed by comparing the standard deviations (STD) of the differences with the random error on the difference MIPAS-FTIR.
The random error covariance matrix of the difference MIPAS – FTIR has been eval-uated, using the work of Rodgers and Connor (2003) for the comparison of remote sounding instruments and of Calisesi et al. (2005) for the re-gridding between the
MI-20
PAS and the FTIR data (see Vigouroux et al., 2006 for more details). The FTIR random error budget has been estimated for a typical measurement at Kiruna (F. Hase, IMK, private communication). There are different contributions to the MIPAS random error covariance matrix. The noise error contribution is the covariance matrix given in the MIPAS level 2 products. The mean of these covariance matrices for the coincident
25
MIPAS profiles has been used as the noise error contribution to the MIPAS random er-ror matrix. Following the approach adopted for MIPAS comparison with other satellite measurements, the systematic errors with random variability have been added to the MIPAS random error budget (see Sect. 2).
ACPD
7, 18043–18111, 2007 Validation of MIPAS CH4 and N2O S. Payan et al. Title Page Abstract Introduction Conclusions References Tables Figures ◭ ◮ ◭ ◮ Back CloseFull Screen / Esc
Printer-friendly Version Interactive Discussion
EGU 6.3 CH4comparisons
Table 3 give for every station, the height region of the partial columns (in pressure units), the mean (M) and the standard deviation (STD) of the partial column relative differences, along with the number N of coincident pairs, the estimated random error on the partial column differences and the 3σ standard error on the mean (SEM).
5
From Table 3, we see that there is a statistically significant positive bias in the rel-ative differences of partial columns for all the stations except Ny-Alesund and Arrival Heights. Due to the high standard deviation at Arrival Heights during the whole period of comparison, the bias is not significant. If we limit the comparisons to the summer-autumn period, the bias at Arrival Heights appears to be also significant.
10
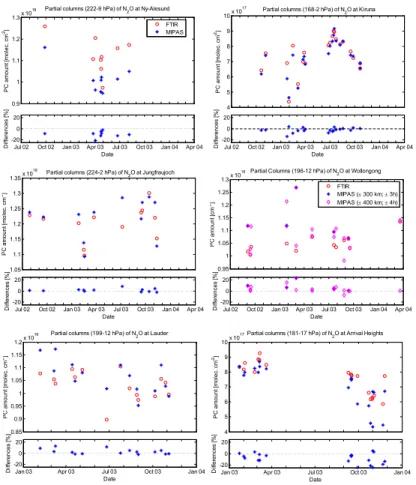
Figure 14 presents plots of the time series of partial columns of CH4 at the six
ground-based stations, together with the time series of the relative differences (MIPAS-FTIR)/mean (FTIR). We see from Fig. 14 that the biases do not show a seasonal de-pendence.
Table 3 also shows that the statistical standard deviation (i.e. the dispersion) is
usu-15
ally slightly larger than the estimated random error which is probably due to collocation and horizontal smoothing errors. We see clearly from Fig. 14 that the standard devi-ations are higher during winter-spring periods for the high latitude stdevi-ations, which is confirmed by the statistics in Table 3 for reduced time periods.
In the profile comparison plot (Fig. 15), the means and the standard deviations of
20
the relative differences between the ground-based FTIR and the MIPAS CH4 profiles
at each station in percentage versus pressure are given. The combined random error associated with the mean difference is represented by the shaded grey area. The 3σ standard error on the mean is also reported to facilitate the discussion of the statistical significance of the observed bias. The black solid lines in each plot mark the pressure
25
levels adopted as the lower and upper limits for the calculations of partial columns. The CH4 difference profiles confirm what has been seen for the partial columns
ACPD
7, 18043–18111, 2007 Validation of MIPAS CH4 and N2O S. Payan et al. Title Page Abstract Introduction Conclusions References Tables Figures ◭ ◮ ◭ ◮ Back CloseFull Screen / Esc
Printer-friendly Version Interactive Discussion
EGU and Arrival Heights in the lower stratosphere. At Wollongong, the bias is maximum
in the middle stratosphere. At Ny-Alesund, no bias was seen in the partial columns. We can see, however, in Fig. 15 that a positive bias exists in the lower stratosphere but is compensated by a negative bias in the middle and upper stratosphere. These oscillations in the difference of profiles are due to the FTIR products at Ny-Alesund.
5
The constraints on the a priori information (Rodgers, 2000) are probably too small, leading to oscillations in the profiles. This would also explain the larger (and probably non realistic) degrees of freedom for signal at Ny-Alesund, given in Sect. 6.1.
6.4 N2O comparisons
The FTIR datasets used here are the same ones as used already by Vigouroux et
10
al. (2007) for the validation of MIPAS N2O v4.61 products, for all the stations except
Ny-Alesund. But the coincidence criteria were less strict, which was compensated by the use of the data assimilation system BASCOE. Here we show results obtained with the same criteria as adopted elsewhere in the present paper (±3 h; ±300 km).
Considering the means and their statistical 3σ standard errors (SEM) given in
Ta-15
ble 4, there is no statistically significant bias in the relative differences of partial columns for the Kiruna, Jungfraujoch, Wollongong, and Lauder stations. A statistically signifi-cant negative bias is seen for the highest latitude stations: Ny-Alesund (–10.1%) and Arrival Heights (–8.5%). For Arrival Heights, we can see in Fig. 16 and Table 4 that the bias is more pronounced during the local spring period, and that it is no longer
20
significant when the comparisons are limited to summer-autumn. For Ny-Alesund, the number of coincidences in the limited time period (3) is too small to draw any significant conclusions.
From Table 4, it can be seen that the statistical standard deviations are within the estimated random error for Ny-Alesund, Jungfraujoch, Lauder and Kiruna. For
Wol-25
longong, we see in Fig. 16 that the larger standard deviation for the statistics (with coincidence criteria of ±3 h; ±300 km) is due to one single coincidence only, on the 1 March 2003. Thus, results are better for the relaxed criteria. For Arrival Heights,
ACPD
7, 18043–18111, 2007 Validation of MIPAS CH4 and N2O S. Payan et al. Title Page Abstract Introduction Conclusions References Tables Figures ◭ ◮ ◭ ◮ Back CloseFull Screen / Esc
Printer-friendly Version Interactive Discussion
EGU considering the whole period, the statistical standard deviation is also larger than the
estimated random error, but this is no longer the case in the reduced time period. In-deed, we see in Fig. 16 that the dispersion is larger during local spring for the three highest latitude stations.
Figure 17 confirms that, except at Ny-Alesund and to a smaller extent at Lauder,
5
there is no statistically significant bias in N2O comparisons in the lower stratosphere
where the N2O concentration is the highest. At higher altitude, a high positive bias is
seen at Wollongong, and a small negative one at Kiruna. 6.5 Conclusions
For CH4 comparisons, we obtain a statistically significant positive bias of 5 to 11% 10
between MIPAS and FTIR lower-middle stratosphere partial columns, and a standard deviation of 4 to 7.5%, when the high variability period (winter-spring) for high latitude stations is not taken into account.
For N2O comparisons, no statistically significant bias is seen between MIPAS and
FTIR lower-middle stratosphere partial columns, and the standard deviation is between
15
2.5 and 6.8%, when the high variability period (winter-spring) for high latitude stations is not taken into account.
When the winter-spring period is included in the comparisons for the high latitude stations, we can reach standard deviations of 9 and 15%, for N2O and CH4respectively,
probably due to collocation and horizontal smoothing errors.Several papers submitted
20
to ACPD cover in details the comparison between MIPAS-E and ACE measurements of CH4(De Mazi et al, 2007), between MIPAS-E and ACE measurements of N2O (Strong
et al., 2007), and between MIPAS-E and Aura Microwave Limb Sounder measurements of N2O (Lambert et al., 2007). These papers report differences generally consistent with the reported systematic uncertainties.
ACPD
7, 18043–18111, 2007 Validation of MIPAS CH4 and N2O S. Payan et al. Title Page Abstract Introduction Conclusions References Tables Figures ◭ ◮ ◭ ◮ Back CloseFull Screen / Esc
Printer-friendly Version Interactive Discussion
EGU
7 Comparison with simultaneous satellite measurements
7.1 Comparison with HALOE
Satellite-satellite intercomparisons are another method to assess the quality of a new space instrument, once another one, considered to be already validated by indepen-dent measurements, is stable and is producing reliable profiles. This is the case for
5
the Halogen occultation Experiment (HALOE on board UARS) providing since 1991 vertical mixing ratio profiles of CH4 (Park et al., 1996) (and several other species) in
the full stratospheric range using solar absorption gas correlation radiometry.
The Institute of Environmental Physics (IUP) of University of Bremen has been using HALOE version v19 data for comparison with coincident MIPAS-E measurements.
10
No averaging kernels have been applied because of similar vertical resolution be-tween the two satellite instruments (3 km for MIPAS, 2–3 km for HALOE) The following accuracy/precision are given by Park et al. (1996) : (a) at 0.3 and 50 hPa acccuracy between 6 and 15%, precision between 0 and 14%, (b) at 0.1 and 100 hPa acccu-racy between 6 and 27%, precision between 0 and 27%. The validation study
per-15
formed by Park et al. (1996) shows an agreement within 10 to 15% of HALOE profiles with balloon-borne (FTS, cryosampler), rocket (cryogenic whole air sampler) and satel-lite/shuttle (ATLAS1+ATLAS2/ATMOS) measurements from 0.3 to 100 hPa.
Figure 18 displays comparisons for a high latitude profile and a tropical profile in good coincidence (distance between HALOE and MIPAS tangent point less than 300 km,
20
time difference less than 3 h). This choice of two quite different profiles is made to demonstrate the possibility of global coverage for the satellite-satellite comparison.
A statistical comparison is then feasible as summarised in table 5 and illustrated by figure 19 and 20.
MIPAS CH4 profiles show in the pressure range 2–140 hPa a positive bias of 5 to 25
20% compared to HALOE. Comparisons from high latitudes look similar for both hemi-spheres.
differ-ACPD
7, 18043–18111, 2007 Validation of MIPAS CH4 and N2O S. Payan et al. Title Page Abstract Introduction Conclusions References Tables Figures ◭ ◮ ◭ ◮ Back CloseFull Screen / Esc
Printer-friendly Version Interactive Discussion
EGU ent. The agreement varies between no or low negative bias to the same high positive
bias values, but the RMS is generally higher (up to ∼30%). However, the number of comparisons are only half or a third of the comparisons in high latitudes.
Comparisons from winter, spring and summer look similar for both hemispheres 7.2 Comparison with ODIN
5
The Sub-Millimetre Radiometer (SMR), launched aboard the ODIN satellite on 20 February 2001 for a combined astronomy and aeronomy mission, is a limb sounding instrument that employs four tunable heterodyne receivers in the range 486–581 GHz and one mm-wave receiver at 119 GHz, to observe atmospheric thermal emission spectra for the determination of the vertical distribution of trace species relevant to
10
stratospheric and mesospheric chemistry and dynamics (Murtagh et al., 2002; Frisk et al., 2003).
In the current work, we compared ODIN-SMR version 1.2 data in the period from July 2002 to March 2003 with collocated MIPAS N2O profiles v4.61. By applying the
standard coincidence criteria of ∆s<300 km and ∆t<3 h, we selected a total number of
15
1087 matching profiles.
The comparison has been done including all the matching pairs of measurements available in the test period (global average plots) and for matching pairs of measure-ments split in six latitude bands (latitude average plots). The six latitude bands con-sidered are: [90◦N–65◦N], [65◦N–20◦N], [20◦N–0◦], [0◦–20◦S], [20◦S–65◦S], [65◦S–
20
90◦S]. The ODIN-SMR systematic error results from the individual instrumental errors (i.e. calibration error, pointing uncertainty, antenna and sideband response knowledge, spectrometer resolution), model error (i.e. temperature knowledge) and spectroscopic error. The ODIN-SMR random error for single profile retrieval is due to the intrinsic receiver noise. On average, a typical systematic error profile has been considered for
25
both MIPAS and ODIN-SMR measurements. These systematic error profiles are then multiplied by the respective mean N2O profiles of the matching pairs of measurements.
ACPD
7, 18043–18111, 2007 Validation of MIPAS CH4 and N2O S. Payan et al. Title Page Abstract Introduction Conclusions References Tables Figures ◭ ◮ ◭ ◮ Back CloseFull Screen / Esc
Printer-friendly Version Interactive Discussion
EGU systematic errors. The combined random error is given by the root sum square of the
averaged random error profiles of the two instruments.
The global average of the percentage difference between MIPAS and ODIN-SMR N2O values, calculated over the full set of collocated measurements is presented in
Fig. 21 (absolute difference) and in Fig. 22 (scaled difference), where the mean profile
5
of the relative difference between MIPAS and ODIN-SMR with respect to the latter is plotted along with error bars representing the standard error on the mean (1σ).
The MRD values are within ±10% from approximately 100 to 10 hPa, with MIPAS mostly underestimating the N2O content; the resulting bias is anyhow constantly lower
than the combined systematic error in this pressure range. Outside this interval, both in
10
the upper stratospheric layers and in the UTLS, the average N2O VMR values retrieved by ODINSMR become increasingly higher than those measured by MIPAS.
This discrepancy could be due to a lack of statistics, not so many points as it can be seen from the standard deviation at altitudes below 60 hPa. We can notice that in the retrieval process, altitudes below 60 hPa might include mainly the a priori information.
15
No significant variations in the seasonal and latitudinal mean differences are present between MIPAS and ODIN-SMR N2O; the global average of the differences is repre-sentative of the overall comparison between the two different instruments capabilities.
The systematic deviation between MIPAS and ODIN/SMR N2O values is not
con-firmed by the other validation data, except ASUR (see Sect. 5.3) which is, as ODIN, a
20
microwave instrument for which N2O retrievals are possibly affected by spectroscopic
errors (uncertainties in line broadening an temperature dependence).
8 Correlation plots of nitrous oxide versus methane
8.1 Satellite / satellite correlation
MIPAS CH4 and N2O data retrieved under ESA responsibility were plotted against
25
(Atmo-ACPD
7, 18043–18111, 2007 Validation of MIPAS CH4 and N2O S. Payan et al. Title Page Abstract Introduction Conclusions References Tables Figures ◭ ◮ ◭ ◮ Back CloseFull Screen / Esc
Printer-friendly Version Interactive Discussion
EGU spheric Trace MOlecule Spectroscopy) data obtained in the early 1990s (see Figs. 23,
24, and 25 as an example). The ESA data shown were produced with software ver-sions MIPAS/4.61 and MIPAS/4.62 on basis of re-calibrated MIPAS spectra. The al-titude range extends from 400 to 0.1 hPa (about 6 to 60 km). Different plots were produced representing data subsets from the northern hemispheric tropics (0–10◦N,
5
Fig. 23), mid- and high latitudes (28–69◦N, Fig. 24) and arctic latitudes (69–90◦N, Fig. 25). Further the data shown are restricted in time to March/April 2003 and Novem-ber 2002/2003, resulting in samples consisting of 3332 to 13829 values, respectively. These restrictions have been applied to obtain the best possible temporal and lati-tudinal agreement with the ATMOS data used to derive previous regression curves
10
(Michelsen et al., 1998a,b).
The ATMOS data were obtained on three Spacelab-missions: 25 March to 2 April 1992 (ATMOS-1), 8–16 April 1993 (ATMOS-2) and 4–12 November 1994 (ATMOS-3). Polynomial fits were performed for data from the northern hemispheric tropics, mid-and high latitudes mid-and from the Arctic vortex. The tropical polynomial was fitted to data
15
obtained on ATMOS-1 and ATMOS-3 between 0 and 10◦N, the mid- and high latitude polynomial to data from AT-3 from 28 to 69◦N and the Arctic vortex polynomial to data
obtained on ATMOS-2.
Generally, the MIPAS N2O and CH4values extend up to about 0.4 and 2.5 ppmv,
re-spectively, which exceed the tropospheric climatological values of 0.32 and 1.8 ppmv.
20
The mid-latitude and arctic correlations are reasonably compact, whereas the tropical correlations exhibit a somewhat larger scatter. The black curves are 5th order poly-nomials fitted to the ESA data, and the red curves are third order polypoly-nomials fitted piecewise to the ATMOS data (Michelsen et al., 1998a, b). To take into account the difference of about 10 years between ATMOS and MIPAS measurements, the
ATMOS-25
polynomials have been trend-corrected by addition of 2.3% (N2O) and 3.2% (CH4). Apart from the highest altitudes (low N2O and CH4values) the Michelsen polynomials
are generally below the ESA polynomials, which hints at either a high bias in the ESA CH4 or a low bias in the ESA N2O data. However the above comparison with
clima-ACPD
7, 18043–18111, 2007 Validation of MIPAS CH4 and N2O S. Payan et al. Title Page Abstract Introduction Conclusions References Tables Figures ◭ ◮ ◭ ◮ Back CloseFull Screen / Esc
Printer-friendly Version Interactive Discussion
EGU tological values and the overall slight positive bias of MIPAS CH4 makes the former
assumption more plausible. 8.2 Balloon/satellite correlation
The simultaneous measurements of N2O and CH4 are providing another consistency
test when the correlation CH4/N2O is plotted for the SPIRALE values, for the
MI-5
PAS “transported” values and for the reference mid-latitude correlation of ATMOS (Michelsen et al., 1998a and b). All available MIPAS data for January, May and Septem-ber 2003 have been used and binned into 3 latitude bands (15–20 N; 40–45 N et 75– 80 N) to generate CH4/N2O correlation plots and to perform comparison with SPIRALE,
and reference regression curve from Michelsen et al. (1998a and b). An example is
10
given in Fig. 26. In addition, MIPAS data have been averaged to generate a zonal mean with error bars taking into account the accuracy + SDV/√n(where SDV is the standard deviation and where n is the number of measurements in a given latitude bands). These zonal means have then been compared to reference curves. A large dispersion of individual MIPAS data is observed but it is significantly decreased when
15
zonal means are used. The agreement with Michelsen curves is good for N2O VMR
lower than 200 ppbv. For N2O values higher than 330 ppbv, and CH4 values higher than 2 ppmv, Michelsen curves are outside error bars associated to zonal means.
Figure 27 shows N2O-CH4relationships as measured by MIPAS-E and the
balloon-borne MIPAS-B instrument. For comparison, trend-corrected correlations observed by
20
ATMOS (Michelsen et al., 1998) and in situ balloon measurements (Engel et al., 1996) are also shown. A polynomial fit has been applied to MIPAS-E and MIPAS-B. The fitted MIPAS-B correlation is very close to the in situ balloon reference. A small bias towards the MIPAS-B data is visible in the fitted MIPAS-E correlation giving a hint that MIPAS-E CH4 is slightly overestimated and/or N2O slightly underestimated. Some unphysical 25
outliers are also obvious in the MIPAS-E data which are connected to oscillations in the N2O and CH4profiles at lower altitudes.

![Fig. 15. Statistical means and standard deviations of the relative di ff erences mean(MIPAS- mean(MIPAS-FTIR)/mean(FTIR) [%] of the CH 4 profiles](https://thumb-eu.123doks.com/thumbv2/123doknet/14792544.602040/58.918.164.542.55.511/statistical-standard-deviations-relative-erences-mipas-mipas-profiles.webp)