2004-04 DIVERSITY AND EMPLOYMENT GROWTH IN CANADA, 1971-2001: SPECIALITY, DIVERSITY AND RESTRUCTURING Richard SHEARMUR, Mario POLÈSE
INRS
Urbanisation, Culture et Société
Mai 2004Diversity and Employment Growth in Canada, 1971-2001:
Speciality, Diversity and Restructuring
Richard SHEARMUR Mario POLÈSE
Institut national de la recherche scientifique (INRS) Urbanisation, Culture et Société
Inédits collection edited by Richard Shearmur
Institut national de la recherche scientifique (INRS) Urbanisation, Culture et Société
3465 Durocher Street Montreal QC H2X 2C6 Phone: (514) 499-4000 Fax: (514) 499-4065 www.inrs-ucs.uquebec.ca/ ISBN 2-89575-065-3 © All rights reserved
TABLE OF CONTENTS
1. INTRODUCTION ... 1
2. AGGLOMERATION ECONOMIES, SPECIALITY AND DIVERSITY ... 2
2.1 Agglomeration economies... 2
2.2 A complex approach to speciality, diversity and economic development ... 3
2.3 Summary and hypotheses... 6
3. DATA AND METHODOLOGY ... 7
3.1 The data ... 7
3.2 Methodology... 8
4. EMPIRICAL RESULTS: DIVERSITY, SPECIALITY AND THE RESTRUCTURING OF REGIONAL ECONOMIES ... 11
4.1 The diversification and specialization of Canadian regions ... 11
4.2 Diversity, speciality and employment growth ... 12
4.3 Diversity, employment growth and time ... 14
5. ECONOMIC STRUCTURE AND EMPLOYMENT GROWTH ... 14
6. DISCUSSION: SPECIALIZATION OR DIVERSIFICATION? ... 16
6.1 Empirical Results... 16
6.2 Policy implications ... 18
List of Tables
Table 1 – part 1 : The Fifteen Clusters – Urban Branch ... 23
Table 1 – part 2 : The Fifteen Clusters – Rural Branch ... 24
Table 2: Various Statistics Relating to the 15 Clusters ... 25
Table 3 : The Diversity of Canadian Regions by Region Type, 1971-2001... 26
Table 4 : Relationship between Initial Diversity and Subsequent Employment Growth, 1971-2001 ... 27
Table 5: Structural Change and Diversification: Movement out of 1971 Clusters ... 28
Abstract/Résumé
Diversification and Employment Growth in Canada, 1971-2001: Speciality, Diversity and Restructuring
In this paper, we explore the link between diversity in the local economy and subsequent employment growth. To do so, we first examine diversification trends between 1971 and 2001 across 382 Canadian regions (urban and rural). We then examine whether or not the more diversified regions display faster employment growth. Although they do—which is evidence of the effect of urbanization economies—an analysis of changes in economic structure suggests that the link between the process of diversification and employment growth is complex. Because specialization can also lead to employment growth, and because the link between the process of diversification and employment growth is not systematic, we suggest that diversification policies will be difficult to implement successfully. We also emphasize the importance of distinguishing between diversity and speciality. Diversity is measured at the level of a regional economy. Speciality is sometimes interpretedas being sector-specific (and as such, is not directly related to diversity), but is sometimes interpreted as characterizing a regional economy (and as such, is the opposite of diversity).
Key words: agglomeration economies; diversification; specialization; regional economic structure; Canada
•••
Nous explorons dans cet article le lien qui existe entre la diversité d’une économie locale à un moment donné et la croissance de l’emploi qui s’ensuit. En premier lieu nous examinons l’évolution de la diversité sectorielle de 382 régions canadiennes (urbaines et rurales) entre 1971 et 2001. Nous nous posons ensuite la question de savoir si ce sont les régions les plus diversifiées qui connaissent la croissance d’emploi la plus rapide. Bien que ce soit le cas (et ceci tend à démontrer l’existence d’économies d’agglomération) — une analyse plus détaillée de l’évolution des structures économiques montre que le lien entre le processus de diversification et la croissance de l’emploi est complexe. Comme la spécialisation peut elle aussi mener à la croissance de l’emploi, et parce que le lien entre le processus de diversification et la croissance de l’emploi n’est pas systématique, nous suggérons que les politiques de diversification économique seront difficiles à mener avec succès. Nous soulignons aussi l’importance de distinguer entre la diversité et la spécialité. La diversité se mesure à l’échelle d’une économie dans son ensemble. La spécialité, au contraire, peut être mesurée soit au
niveau d’une économie (et, dans ce sens, c’est le contraire de la diversité), soit au niveau d’une industrie (et, dans ce sens, c’est une mesure de la concentration de cette industrie en un lieu donné).
Mots clés : économies d’agglomération; diversification; spécialisation; structure économique régionale, Canada
1. INTRODUCTION
In this article, we set out to answer two simple questions. Between 1971 and 2001, have Canadian regions with a more diversified economic structure tended to grow faster than those with a more specialized structure? And, over the same period, have Canadian regions tended to diversify or to specialize? In the context of the debates between the proponents of Jacobs externalities (who argue that diversified local economies are conducive to growth; see Jacobs (1969)) and the proponents of Marshall-Arrow-Romer (MAR) externalities (who argue that specialization is conducive to growth: see Porter (1990)), it is useful to take a step back and consider, from both the theoretical and empirical perspectives, what type of growth can be expected from each type of agglomeration economy.
We first briefly summarize the principal ideas that underpin these two forms of agglomeration economies, and the reasons why each may lead to regional growth. Then, in the light of some recent studies, we discuss whether Jacobs and MAR externalities are alternatives, or are complementary to each other.
After presenting our data and methodology, the empirical analysis proceeds in two main stages.
First, we perform a straightforward analysis of diversity1 by way of an index. This
analysis covers the entire space economy (382 regions), and includes controls for subgroups defined by city size, proximity to a metropolitan area and geographic region. Second, the link between diversity, the process of diversification, and employment growth is explored. To begin, a broad-brush approach is taken. Then we examine in more detail the changing economic structures of Canadian regions, with the aim of uncovering whether certain types of diversity, and of diversification, can be associated with employment growth.
Overall, we identify trends that provide partial corroboration for the existence of Jacobs externalities. However, we call into question any simple distinction between speciality and diversity. Despite a number of clear patterns, the processes of economic restructuring, diversification and specialization turn out to be multi-facetted. One of the reasons for this is that speciality is not necessarily an alternative to diversity.
1 The word “diversification” suggests a process occurring over time. The word “diversity” suggests a state at a given point in time. Despite the common use of the term “diversification index” (see Dewhurst and McCann, 2002), we think it is clearer to use the term “diversity” for a static state, and to use the term “diversification” for the process of becoming more diverse. Likewise we will use the term “speciality” to refer to static specialization, and “specialization” to refer to the process of becoming more specialized.
To begin, we will turn to a brief discussion of agglomeration economies, speciality and diversity.
2. AGGLOMERATION ECONOMIES, SPECIALITY AND DIVERSITY
It is an accepted truth, at least among many economic development agencies, that the diversification of local economic structure is to be sought after and encouraged. The names of agencies such as Western Economic Diversification (Canada), Société de diversification économique de l’outaouais (Canada), Savannah River Regional Diversification Initiative (USA) and Fonds de diversification régionale Picardie (France) speak for themselves.
In this paper, we will argue that a distinction should be made between the process of diversification and diversity. Policymakers may well be basing their policies on the belief that the most diversified regional economies are the ones that have grown the fastest, at least since the early eighties. It does not follow that the process of
diversification will lead to faster growth. Indeed, for some region types (those that are,
and have always been, more specialized), diversity may not be an option, and targeted
specialization may be a more appropriate policy response.
There are, of course, good theoretical and empirical reasons to substantiate the link between diversity and regional growth. But there are also reasons suggesting that specialization can sometimes be a better way to promote growth within a particular sector, and by extension (depending on the weight of the sector in the overall economy), in the economy as a whole. To understand this apparent contradiction, we will first briefly summarize what is meant by agglomeration economies.
2.1 Agglomeration economies
Notwithstanding refinements currently being made to the theory of agglomeration economies (Parr, 2002; Phelps & Ozawa, 2003)—some of which we will return to—the benefits that an economic actor may derive, from locating in a particular region, are usually divided into two components (Dicken & Lloyd, 1990):
− Localization economies: These are savings that accrue to a firm in a particular industry from locating in proximity to other firms in the same industry. The type of savings referred to are knowledge spillovers through “spying, imitation, and rapid transfer of highly skilled personnel” (Glaeser et al. 1992, p. 1127). Porter (1990) also suggests that inter-firm competition within the same sector leads to increased efficiency and a more rapid rate of innovation, as each firm tries to gain an edge on
3 the others. Such economies, which are associated with industrial speciality of local economic structure, are often referred to as MAR economies (Glaeser et al. 1992; Acs, 2002)
− Urbanization economies: These are savings that accrue to firms in all industries from locating in proximity to other economic activities of different sorts. These types of savings can result from the division of labour (though this can occur both within and between different sectors), the sharing of infrastructure, cheaper transport costs because of higher volumes, the transfer of ideas between sectors, informal interactions, chance encounters, etc. Hall (1999) proposes many of these factors as possible explanations for the rise of great innovative cities—though precisely how these factors function is uncertain.
Of the two types of agglomeration economies, the first is increasingly being measured and documented (Henderson, 1997, 2003; Freel, 2000; Staber, 2001; Chevassus-Lozza & Galliano, 2003). There is little doubt that, for some types of firms, locating in areas where there are many other firms in the same industry leads to economies and increased efficiency (Carrincazeaux, 2000). This does not mean that interactions at other spatial scales are not important (Echeverri-Carroll & Brennan, 1999), or that some firms do not develop successfully outside clusters (Suarez-Villa & Walrod, 1997). But, it does mean that in some cases, and for some industries, localized clusters develop their own dynamism.
It is more difficult to identify and measure urbanization economies, and this has led some researchers to question the extent to which they contribute to the competitiveness and efficiency of firms (Henderson, 1997, 2003; Beardsell & Henderson, 1999). Glaeser
et al. 1992) and Quigley (1998), on the other hand, find that a diversified economy is
conducive to city-level employment growth. As a number of researchers have made clear (Acs & Varga, 2002; Hansen, 2001), there is no consensus on the relative importance of urbanization and localization economies. They are often difficult, if not impossible, to isolate from one other. There is agreement that, if they exist, such economies should be associated with industry- or regional-level growth. From a regional policy perspective, it is often employment growth at the regional level that is hoped for.
2.2 A complex approach to speciality, diversity and economic development
A series of recent articles have suggested that the diversity/speciality debate is more complex than the brief outline above suggests. We will elaborate on four aspects of this
debate. As we will see, even though these aspects have recently been under discussion, they are not new. However, their relevance has once again come to light because of the heightened interest in the causes and economic consequences of agglomeration.
i) Speciality and diversity: independent concepts
A debate between Porter and Markusen, which took place between the covers of the
International Journal of Regional Science (1996, 19.1 & 2), was concerned with the
relative importance to local economies and industries of urbanization (diversity) economies and localization (speciality) economies. Without going into detail, the aspect of the debate that is relevant to this paper is that both speciality and diversity can coexist within the same city. To illustrate this point, Porter (1996) uses the example of Seattle—a large, diversified metropolitan area that also incorporates specialized industrial clusters.
It is useful to give an example of what Porter means since he is, in effect, highlighting the difference between speciality for a particular sector, and speciality or diversity for a regional economy. For a particular sector, speciality is associated with spatial clustering: For instance, a local cluster of 10,000 jobs may be sufficient—in a given sector—to generate localization economies. However, these 10,000 jobs may, or may not, lead to the host region being specialized. In a region of 1,000,000 jobs, a 10,000-job cluster may go unnoticed. In a region of 100,000 10,000-jobs, the cluster represents 10% of the local economy. Thus, for a region, being specialized in a particular sector may or may not lead to overall regional speciality or diversity.
If the rest of a large region’s economy is diversified, speciality in one small sector will have little effect on the region’s overall level of diversity. An overall regional indicator of speciality (of the sort discussed by Dewhurst & McCann (2002) and Duranton & Puga (2000)) would show a diversified region.
This leads us to argue that localization and urbanization economies should be treated separately. Localization economies (associated with the idea of speciality) are linked to a particular sector and are independent of city size; they are, however, dependent on the size of the sector within the city. Urbanisation economies (associated with the idea of diversity) are dependent on city size to the extent that, ceteris paribus, a larger city will tend to have a wider variety of different economic sectors within it.
Conceptually, the two ideas are linked only to the extent that a larger city can harbour a larger number of industries, each of sufficient size to generate its own localization
5 economies. This, in turn, may lead to wider urbanisation economies as each industry benefits from the others’ localization economies.
ii) City size, history and instability
Smaller cities will tend to be more specialized than larger ones (Quigley, 1998; Glaeser
et al., 1993; Beckstead & Brown, 2003): to use Porter’s (1996) example again, a cluster
that may have little effect on Seattle’s overall economic structure will have a major effect on the structure of a smaller city’s economy.
Cuadrado-Roura & Rubalcaba-Bermejo (1998) discuss the relationship between city size and speciality. They emphasize the vulnerability of over-specialized cities to economic change, and suggest that vulnerable cities will tend to be smaller ones. But they also recognize (as do many writers on resource-based economies (Randall & Ironside, 1996; Gunton, 2003; Stabler, 1999) that short-term advantages can accrue to specialized cities when their speciality is in demand. This should be borne in mind when interpreting empirical results, since it suggests that the benefits of speciality depend on the period for which these benefits are measured. In Canada, for instance, we expect specialization to be correlated with employment stability or growth until the early 1980s, because many single-industry, resource towns were being settled and were growing (Polèse & Shearmur, 2002). Since then, it is probable that speciality has been linked to stagnation or decline.
From a more theoretical perspective, such considerations may explain the unresolved debate between the proponents of Jacobs externalities (Jacobs, 1969; Glaeser, et al., 1992) and those who tend to put forward MAR ones (Henderson, 1997, 2003): there is little doubt that both exist. From a theoretical perspective they can both be explained, and evidence is forthcoming to show that both can – to some extent at least – be measured. However, the evidence is inconsistent. Considerations of city size and time-scale may help to reconcile the seemingly contradictory effects of speciality and diversity on the growth of employment and on the competitiveness of firms.
iii) Localized city systems and borrowed size
The relative geographic position of cities should be considered when analyzing the effects of agglomeration (Phelps & Ozawa, 2003; Plane, 2003). In particular, Phelps & Ozawa (2003) argue that diffuse agglomerations are having an increased effect as we move towards a post-industrial economy: smaller cities benefit from agglomeration economies generated by larger (but nearby) cities. If this is so, then city systems (and particularly the effect of distance between cities) should be analyzed: cities by
themselves may only exhibit partial characteristics of local agglomeration whilst benefiting from more diffuse types of agglomeration.
Phelps et al. (2001) present empirical evidence showing that firms in small cities borrow the size’ of larger cities. They trace the idea of borrowed size to Alonso (1973) who wrote that “the concept of a system of cities has many facets, but one of particular interest … is the concept of borrowed size, whereby a small city or metropolitan area exhibits some of the characteristics of a larger one if it is near other population centres” (p200). This is consistent with the work of Coffey & Shearmur (1996), Polèse & Shearmur (2002) and Plane (2003) who demonstrate that the characteristics of cities and rural areas within about one hour’s drive of a large metropolitan area differ significantly from those located further away.
iv) Discontinuous trends
A number of researchers have emphasized the fact that speciality and diversity co-exist within an urban system. In fact, Duranton & Puga (2000), suggest that “urban systems may … have an innate tendency to create this type of imbalance”.
Likewise, O’Donoghue (2000) shows that there is no simple trend either towards or away from diversity. He analyzes the diversification of 150 British Travel-to-Work areas, which account for nearly 90% of all employment in Britain. Between 1978 and 1991, he detects a weak trend towards convergence in employment structures. However, he also shows that a particular group of cities—the ten largest metropolitan areas— actually diverge over most of the period. Beckstead & Brown (2003) obtain similar results: they show that, in Canada between 1992 and 2002, there is a weak trend towards the diversification of medium-sized cities, and towards the specialization of the largest ones.
2.3 Summary and hypotheses
From our data, we do not propose to investigate the possible existence of localization economies. Rather, by using a regional-level measure of economic diversity, we will seek to establish the extent of urbanization economies: if faster employment growth is systematically associated with high, initial levels of diversity, this will be taken as support for the Jacobs externalities thesis.
We will also distinguish between initial levels of diversity and the process of diversification: although it is problematic to investigate causal relationships between an ongoing process and concurrent employment growth (the two factors being studied cannot be construed as independent), we will attempt to shed some light on this
7 complex issue. Indeed, from a policy perspective, the mere existence of Jacobs externalities is interesting but not of great relevance: policies cannot fundamentally alter a region’s level of diversity, though they may be able to encourage a process of marginal diversification.
We do not expect the link between diversity and employment growth to be straightforward for the following reasons:
1. Trends may be discontinuous, as different types of cities and regions may be moving towards or away from a diverse economic structure.
2. Trends may not be constant over time. At certain periods, diversity may be conducive to growth; at others, it may not be.
3. Behind any discussion of diversity lies the idea of economic structure. For a given level of diversity there can exist a variety of economic structures: certain types of structures may be more conducive to growth than others, even if they share a similar level of diversity2. Furthermore, the move towards or away from a particular
economic structure may, in itself, be linked to employment growth, even if the level of diversity does not change.
With these questions and hypotheses in mind, we can now turn to the empirical analysis.
3. DATA AND METHODOLOGY
3.1 The data
The data are special compilations of census employment data by place of residence for 1971, 1981, 1991, 1996 and 2001. The 1971-to-1996 data are classified according to the 1980 SIC, whereas the 2001 data are classified according to NAICS. Our data are disaggregated at the 2-3-digit level (for the 1980 SIC data), and at the 4-digit level (for the NAICS data). From this level of detail we have been able to reconstitute 18 sectors that cover the whole economy, and that are comparable over the 30-year period (Annex 1). We recognize the subjectivity of this sectoral disaggregation: all analysts of diversity are confronted with such a choice (Randall & Ironside, 1996; Dewhurst & McCann,
2 Shift-share analysis in the context of economic geography is concerned with the effect of industrial structure on growth (of employment or of other indicators). The issue of industrial structure and diversity is often combined in this type of analysis: the effect of diversity is not usually distinguished from that of industrial structure. In this paper, we attempt to distinguish between the effects of structure and those of diversity, with more reference to the literature on diversity and agglomeration economies—structure is introduced as a control variable, and is not analyzed in detail.
2002). These 18 sectors are similar to those used by Coffey & Shearmur (1996) and Polèse & Shearmur (2002).
Despite the theoretical importance of sectoral disaggregation, in practice, our results closely mirror those of Beckstead & Brown (2003) for Canada: they use a more detailed database that covers about 75% of the whole economy and comprises 285 3-digit sectors. The general trends in Canada are also similar to those found in Britain by O’Donoghue (2000) using a 20-sector disaggregation that is very similar to ours. This suggests that, if the classification of jobs is coherent, then the measure of diversification trends across regional economies is fairly robust to the classification choices made; however, further empirical work would be required to verify this.
The geographic coverage of our data is extensive. The whole Canadian territory is covered, and two databases have been used to do this: first, a database covering the 442 Census Divisions (CDs), as defined in 1991; and second, a database covering the 152 urban agglomerations (UAs: 25 CMAs, 115 CAs and 12 CSDs) 3 of over 10,000 people
in 1991: again, the 1991 geographic limits are used.
These two databases have been combined: the CDs have been aggregated until no UA is intersected by a CD boundary. Then, the UA data have been subtracted from the data for the CD in which it is located. Thus for each UA, we have the UA data, and data for the rural area surrounding it. In total, the data comprises 382 regions, 152 UAs and 230 rural areas (RAs).
The rural and the urban areas are of a different nature. Each UA is defined by Statistics Canada to correspond to an integrated labour market. On the whole, these can be treated as areas within which the majority of people both live and work, and that are spatially fairly compact. The rural areas, however, do not meet these criteria. They are areas in which no single settlement is greater than 10,000 people (in 1991). Although, on the whole, most people live and work within the same RA, this is not necessarily the case, particularly for RAs close to metropolitan areas. In addition, the settlement pattern in RAs is not compact; hence agglomeration economies, which depend on proximity between economic actors, are least likely to accrue in these areas unless they are borrowing size from elsewhere.
3.2 Methodology
In order to understand regional patterns of speciality and diversity in Canada, we first analyze a diversity index, which we then disaggregate by region type (urban/ rural/
9 borrowed size) and by broad geographic area (see below). Since our diversity index has an approximately normal distribution for all five years, we have performed an ANOVA test across the five panels of data to establish whether there has been significant evolution during the 30-year period covered.
We then analyze the link between diversity and employment growth, controlling for regional type: within this, we account for city size, but also for proximity to a major metropolitan area (borrowed size) and for the difference between urban and rural areas. To explore the economic restructuring of Canadian regions, and the link between restructuring, diversification and growth, we establish a typology of Canadian regions according to their industrial structure. The movement of regions in and out of the various clusters is analyzed over the 1971-2001 period. This enables us to identify whether or not restructuring is unidirectional, whether regions that restructure tend to diversify, and whether regions that restructure tend to grow faster.
We will briefly describe the techniques used to perform this analysis:
− Speciality or diversity index: each of the 382 regions, and each of the 15 cluster profiles, is more or less diversified. The index used to measure the speciality or diversity of an economic structure is as follows:
+ − =
∑
= 18 1 2 2 ( 100) 18 1 1 1 i i p lq D whereDp = diversity index of profile p
lqi = location quotient of sector i for profile p 4
If Dp = 1 the profile is identical to the base profile used for calculating location quotients: the region’s or the cluster’s profile is identical to Canada’s, and all location quotients are equal to 1002.
The value of Dp tends towards zero as the profile diverges from the Canadian base profile (the more the region or cluster is specialized in one or more of the 18 sectors analyzed).
4 Note that the location quotients referred to in this paper have been multiplied by 100 for ease of presentation (this avoids decimal points). Thus a location quotient of 100 for sector i in region j indicates that the percentage of employment of sector i in region j’s economy is identical to the percentage of employment of sector i in Canada’s economy.
− Typology: to establish a typology of Canadian regions by industrial structure, data for the five census years and for each of the 18 sectors are first transformed into location quotients (based on the employment profile in Canada for each of the five years). In this way, the speciality of each region in each sector is controlled, for the changing structures of the Canadian economy as a whole.
These data are pooled, giving a total of 1910 (382 x 5) observations. Hierarchical cluster analysis is applied to the 1910 18-sector profiles. In order to give the same weight to each of the 18 sectors, and given the extreme values in some sectors (like the primary sector) and the fairly homogeneous values in others (such as retail), the cluster analysis is performed on standardized values of the location quotients.
Fifteen different clusters are retained (Tables 1 and 2). The choice of 15 clusters is dictated by two considerations. First, a number of clusters large enough to capture different industrial structures, but small enough to make the analysis tractable, is required. Second, examination of the loss of variance, explained as clusters are progressively merged, reveals a cut-off point at 15 clusters. The leap from 15 to 14 clusters causes a relatively large drop in the variance explained.
− Classification by broad geographic regions: the 382 regions are divided into six broad geographic areas: Atlantic Canada, Quebec, Ontario, the Prairies and Territories, Alberta, and British Columbia.
− Classification by urban/rural/borrowed size: the 382 regions are divided into 7 different types to reflect characteristics such as urban size and proximity to a metropolitan area (Phelps & Ozawa, 2003; Plane, 2003; Polèse & Shearmur, 2002). 1) AMA: metropolitan areas of over 500,000 people;
2) ACA: cities of 50,000 to 500,000 people, within one hour’s drive of an AMA; 3) ACB: cities of 10,000 to 50,000 people, within one hour’s drive of an AMA; 4) RC: rural areas within one hour’s drive of an AMA;
5) APA: cities of 50,000 to 500,000 people, beyond one hour’s drive of an AMA; 6) APB: cities of 10,000 to 50,000 people, beyond one hour’s drive of an AMA; 7) RP: rural areas beyond one hour’s drive of an AMA.
11 It should be emphasized that it is relative diversity and relative restructuring that are being studied. In other words, diversity is defined as, “having an economic structure similar to that of the Canadian economy as a whole.” Canada’s economic structure has changed between 1971 and 2001: any region that has evolved in the same way as the Canadian economy without evolving relative to it will not—under our definition—have diversified.
The limits of this approach should be noted: our 15 economic profiles correspond to the average profile of all cluster members. Clearly, some members are more strongly attached to the cluster than others, so a move between clusters does not necessarily indicate a major change in structure. The further apart on the cluster tree are the clusters between which a region moves, the more likely it is that a major change has occurred. To account for the inherent fuzziness of our classification of the 382 regions, we analyze groups of regions that move, and groups that stay: unless a detailed analysis of individual regions is performed, the best indicator of structural change we have is the move from one cluster to another.
4. EMPIRICAL RESULTS: DIVERSITY, SPECIALITY AND THE RESTRUCTURING OF REGIONAL ECONOMIES
4.1 The diversification and specialization of Canadian regions
There is no trend towards convergence among Canadian regions. The mean level of diversity amongst Canada’s 382 regions remains almost constant during the 30 years of study (Table 3), and the small changes are not statistically significant.
When the seven region-types are analyzed separately (Table 3), the results are inconclusive: the only clear trend that emerges is for large, non-metropolitan, urban agglomerations, whether located close to a metropolitan area (ACA) or far from one (APA). For these two city types, a statistically significant process of diversification is recorded. For all other region types, notwithstanding some apparent regularity in the way the index has evolved, differences between the years are not significant.
The results are similarly inconclusive when the index’s evolution is studied by broad geographic region. The only clear trend that is statistically significant is for Ontario, where the diversification trend is monotonic (except for slight specialization between 1991 and 1996) and significant at the 95% level. For three other broad regions, weak trends seem to exist (diversification in BC, and specialization in Alberta and the Prairies) but differences between values across the five years of study are not
significant. Despite statistically significant differences between the years for Quebec, there is no discernible trend. No trend is discernible for Atlantic Canada.
This part of the analysis leads to conclusions very similar to those of O’Donoghue (2000) and of Beckstead & Brown (2003). For Canadian cities, there is a very weak tendency for relative diversification to occur, but only in large non-metropolitan cities. Ontario regions also seem to be diversifying slowly. For most other region types, although weak trends can be detected for some, they are not statistically significant.
4.2 Diversity, speciality and employment growth
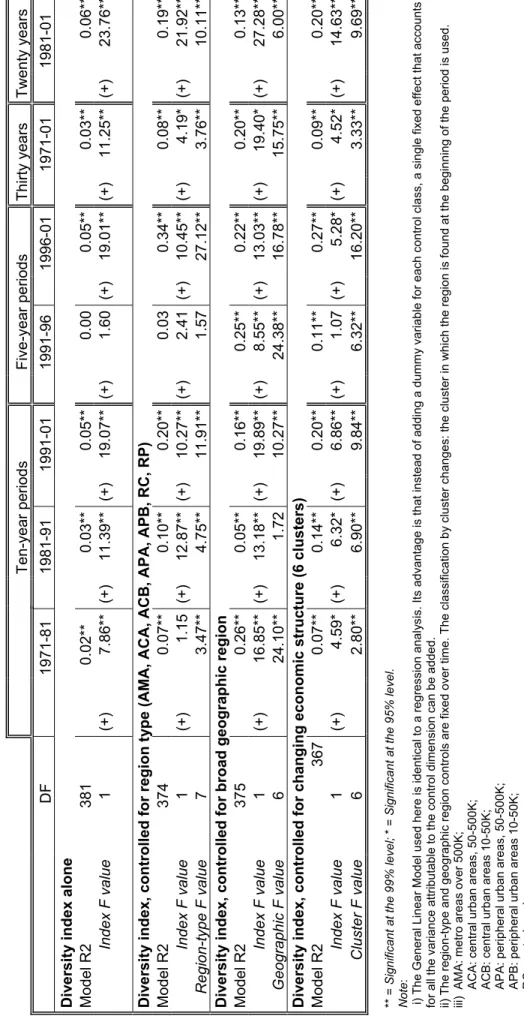
Although there does not appear to be any clear trend of diversification relative to the Canadian economy, this does not mean that diversity does not carry with it the benefits predicted by Jacobs. Indeed, for three of the four, independent, time intervals we can study (1971-1981, 1981-1991, and 1996-2001) there is evidence that the more diversified a city or region is at the beginning of the period, the faster it grows (Table 4). The results are not strong (the coefficient of variation, r2, varies between 0,02 and 0,05) but are statistically significant. The highest r2 is obtained by analyzing the 1981 to 2001 period: over these twenty years we identify the strongest link between initial level of diversity and subsequent employment growth.
These results must be interpreted carefully: we have established (Table 3) that there is considerable variation in diversity across the region types and across broad geographic regions. It is possible that the association between diversity and employment growth merely reflects the association between diversity and region type (in particular between diversity and size). It is also possible that, not only the level of diversity, but also the
type of diversity may have an effect on employment growth.
We therefore repeat the same analysis while controlling for three different factors: i) region type; ii) broad geographic region; iii) initial economic structure.
Whether or not controls are introduced, the link between initial diversity and subsequent growth is always positive. The relationship between diversity and growth (which, according to Jacobs (1969), Quigley (1998) and others, is due to the effect of urbanization economies) is resilient, and does not merely reflect the index serving as a proxy for another variable.
However, the strength of the relationship between diversity and subsequent growth changes, depending on what type of control is used and on the period studied.
13 i) Diversity, employment growth and region type (Table 4): For all periods studied, except 1991-1996, there is a strong connection between region type and employment growth. After controlling for this (which includes a control for size), we can see that the initial diversity of a region remains positively and significantly associated with growth for all periods except 1971-1981 and 1991-1996.
ii) Diversity, employment growth and broad geographic region (Table 4): For all periods studied, except 1981-1991, employment growth is strongly connected to the broad geographic region within which a city or rural area is located. The addition of this control variable highlights the link between diversity and growth: when regional differences in employment growth are controlled for, the association between initial diversity and subsequent growth is emphasized. In particular the diversity index enters the model with a high F value during the 1970s, whereas under all other controls, and when it is analyzed alone, the connection between diversity and growth in the 1970s is weak.
iii) Diversity, employment growth and economic structure (Table 4): As regions diversify or specialize, their economic structure changes. Even regions for which the diversity index remains constant may undergo economic restructuring. After aggregating the 15 clusters into 6 (following the cluster tree5), the cluster variable is
introduced as a control for the effects of diversity. Each cluster corresponds to a particular type of regional economic structure: for each time period, the cluster in which a region finds itself at the beginning of the period is used.
As expected, controlling for economic structure considerably weakens the link between diversity and subsequent employment growth, without abolishing it altogether. The control variable itself enters the model significantly for all periods.
This shows that it is not only the level of diversity, but also the type of diversity that matters. It may seem obvious that specialization in high-order services (for instance) does not lead to the same growth outcome as specialization in traditional manufacturing. This distinction can be overlooked if a diversity index is used without also considering structure. By controlling for economic structure, and by showing that the structure itself has a connection with subsequent growth, that is independent from the level of diversity, we demonstrate the importance of not overlooking this obvious point.
5 For ease of comparison, the 15 clusters are aggregated into 6 for the purpose of this statistical test, following the order of aggregation indicated in the cluster tree (Table 2). Results are very similar when the 15 clusters are used.
4.3 Diversity, employment growth and time
The connection between diversity and subsequent employment growth is not the same over all time periods, as we have seen (Table 4). Jacobs externalities seem to be stronger over some periods than others. Two periods stand out in our analysis. First, the 1971-1981 period is one in which Jacobs externalities seem weak. This period is one during which resource regions in certain parts of Canada were still growing very fast (Polèse & Shearmur, 2002). The fast growth of some single-industry towns is a possible explanation for the weak link between diversity and growth over this period. In other words, fast growth during this period was also occurring in some very specialized regions.
The second period during which Jacobs externalities do not seem evident is the recession and slow recovery of 1991-1996. This was the first recession to hit white-collar workers in urban sectors such as finance, insurance and high-order services. Although neither diversity nor region type is connected with employment growth over the period, there is a strong connection between growth and broad geographic region and between growth and economic structure. Only after controlling for geographic regions can a significant link between diversity and growth be detected. During the most recent five-year period—the recovery period after the early 1990s—a very strong connection exists between diversity and employment growth.
These results suggest two things. On the one hand, diversity does not provide immunity from economic downturns: the strongest immunity seems to be provided by being located in the right region of Canada. On the other hand, diversity may facilitate recovery after an economic downturn.
5. ECONOMIC STRUCTURE AND EMPLOYMENT GROWTH6
The link between diversity and employment growth is persistent throughout the data analyzed, but the strength of this link should not be overstated: in of itself, it is only weakly linked with employment growth. The link strengthens if diversity is controlled across regions and geography: this suggests that Jacobs externalities are conditional and not absolute. The link is weaker if diversity is controlled across economic structure: this suggests that the economic structure of a region may contribute independently to employment growth.
6 We are not proposing to discuss economic structure in detail: rather, different structures are identified merely as a way a classifying regions, and of controlling the correlation between diversity and growth for differences in structure. Our analysis could be combined with a more detailed shift-share analysis to investigate in more detail the interaction between structure and diversity as they relate to employment growth. This is an avenue for extending our work.
15 In this final section, we explore how restructuring has taken place across Canada between 1971 and 2001, and whether or not links can be established between the process of restructuring and employment growth.
The first point to make is that between 1971 and 2001, 236 of the 382 regions under study do not undergo any major structural change relative to the Canadian economy as a whole: over 60% of all regions remain in the same cluster (Table 2). Furthermore, structural changes, when they occur, are not unidirectional: for example, although 10 regions move out the “resource and traditional manufacturing” cluster (cluster 24), 19 regions join it (Table 2).
Only two clusters lose a large number of regions while gaining very few, and they are diametrically opposed in terms of economic structure and in terms of their diversity levels: the “resource” cluster (cluster 15) —which is the most specialized —loses 31 members and gains only 3. The “diversified and high-order service” cluster (cluster 27) —which is the most diversified —loses 6 members and gains none. For all other cluster types, despite dominant flow trends —either in or out —flows occur in both directions (Table 2).
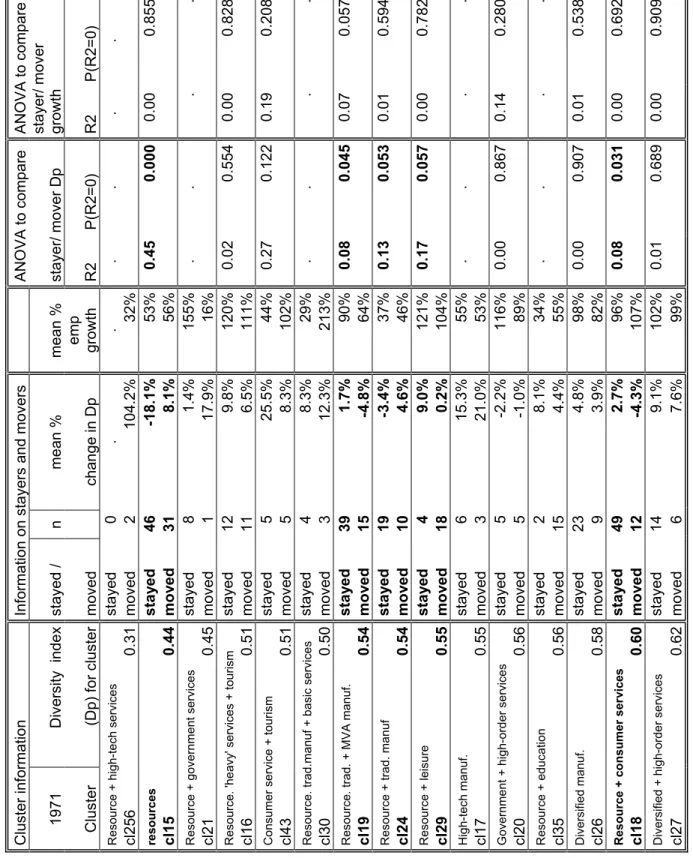
Movement out of a specialized cluster is not necessarily accompanied by diversification (Table 5). This is because the restructuring that takes place is often lateral, in the sense that a region may change the sectors in which it specializes, but remain at the same overall level of speciality. Indeed, whereas regions moving out of the “resource” cluster (cluster 15) and the “resource and traditional manufacturing” cluster (cluster 24) tend to increase their level of diversity relative to those that stay, those moving out of the “resource, traditional and MVA manufacturing” cluster (cluster 19) and the “resource and leisure” cluster (cluster 29) actually decrease their diversity level. In no case does movement out of a particular cluster lead to significantly faster employment growth relative to those that stay.
Regions that move into a cluster do not necessarily diversify faster than those that have not moved (except for the 33 regions that move into the “resource and consumer service” cluster (cluster 18 – Table 6)). Similarly, except for the 36 regions moving into the “resource and traditional manufacturing” cluster (cluster 24), regions that move into a cluster do not grow faster than those that have not moved (Table 6).
However, these two examples provide key information on the overall restructuring of Canadian regions: together, they comprise 69 of the 146 regions that change cluster between 1971 and 2001. From these examples, we can see that the most common type of restructuring that leads to diversification is restructuring towards the “resource and
consumer service” profile (cluster 18): such restructuring does not, however, lead to faster growth than that experienced by those regions already in the cluster. The type of restructuring that is associated with faster growth is movement towards the “resource and traditional manufacturing” profile (cluster 24), but such restructuring is not accompanied by diversification.
This illustrates the complexity of analyzing the process of diversification once one moves beyond the use of an index. Tables 5 and 6, and the previous examples show that some restructuring leads to growth, but is not accompanied by diversification. Likewise, some restructuring leads to diversification, but is not accompanied by growth.
From a policy perspective, this complexity is problematic: despite the link, identified earlier, between initial diversity and subsequent growth, it does not follow that the
process of diversification is linked with employment growth. Jacobs externalities may
exist, as we have shown, but this does not lead to straightforward policy lessons.
6. DISCUSSION:SPECIALIZATION OR DIVERSIFICATION?
6.1 Empirical Results
The majority of regions in Canada did not change their relative economic structure or their level of diversity between 1971 and 2001. This is verified by two results: 1) the stability of the diversity index over this period for all region types except a few non-metropolitan urban areas; and, 2) the fact that 62% of all regions remain in the same cluster over the 30-year period.
This slow pace of relative change does not mean that the diversified regions are not the most dynamic: in Canada, diversified regions grow faster than less diversified ones, even after controlling for city size, metropolitan proximity, geographic region and economic structure. These controls take into account some of the theoretical issues, such as borrowed size, city size and rural-urban differences, that may affect the link between initial diversity and growth. The relationship is quite consistent over time: even during periods when the relationship is weak, it retains a direction consistent with Jacobs’ hypothesis. We therefore conclude that employment growth is partly generated by economic diversity, and that mechanism through which diversity leads to economic growth is urbanization economies. To the extent that larger cities tend to be more diversified than smaller cities or regions, this process has been self-perpetuating in Canada over most of the last 30 years, since a consequence of faster growth is to further increase relative size, and hence diversity.
17 Although initial conditions seem to be associated with subsequent growth, we have also shown that a move towards a diversified economic structure is not necessarily accompanied by growth, and employment growth is not necessarily accompanied by diversification. Furthermore, there tends to be movement both towards and away from economic structures at all levels of diversity7. Thus, even if there is a link between initial diversity and subsequent employment growth, the link between the process of diversification and concurrent employment growth is not certain.
Therefore, although evidence of Jacobs externalities exists, efforts to create such externalities may lead to unexpected results. We have given the example of a large group of regions (those moving towards the diversified “resource and consumer service” cluster) undergoing a process of significant diversification while not growing faster than those regions already in the diversified cluster. Another large group of regions (those moving to the moderately diversified “resource and traditional manufacturing” cluster) are growing fast without diversifying more rapidly than the regions already in the cluster. These dynamic processes have not been fully explored in this paper, and further research is needed to uncover the connections between them. Two other points emerge from our empirical work. Even if there is evidence that Jacobs externalities lead to employment growth, these externalities do not have the same effect over each period: they are weak during a period of fast growth in single-industry towns (the 1970s), and they are weak during a recessionary period (the early 1990s)8. This
calls into question the argument that diversity leads to stability on two counts. On the one hand, speciality clearly benefited some regions and cities during the 1970s: even if there were not enough fast-growing, specialized regions and towns to completely mask the effects of urbanization economies, their existence blunted the statistical effect of urbanization economies across the 382 Canadian regions. On the other hand, diversity did not prevent regions from feeling the downturn of the early 1990s: there is no evidence that the more diversified regions weathered the recession any better than the more specialized ones.
The second point concerns the link between economic structure and employment growth. This link is at least partly independent of diversity: some economic structures are more conducive to growth than others. When a diversity index and an indicator of economic structure are both entered into a GLM model, both are significantly associated with subsequent employment growth.
7 As we have noted, both the most diversified and the most specialized clusters lose members while hardly gaining any. Although trends away from or towards other clusters can be seen (Table 2), all other clusters both gain and lose a significant number of regions relative to their size.
8 Note that only one recessionary period can be studied from our data. Time-series data based on fixed geographic boundaries are needed to explore these hypotheses more thoroughly.
These results are exploratory. However, they open up a series of questions meriting further investigation including, among others, the link between Jacobs externalities and economic cycles, a more precise conceptual separation between the effects of particular economic structure and the effects of general diversity on growth, and an exploration of the link between the process of diversification and employment growth. A final important question to raise is the extent to which these results would hold in countries with larger cities: most cities in Canada are quite small by global standards, so it is feasible that the diseconomies of urban size have not yet been felt here.
6.2 Policy implications
From a policy perspective, our results shed some light on the perceived benefits of diversity.
That these benefits exist is strongly supported by our evidence. That they can be harnessed by policymakers is far less certain. There are two reasons to doubt whether diversification as a policy aim is realistic. First, a majority of regions do not significantly alter their economic structure over a thirty-year period: the level of inertia is great, and it is not certain that there exist policy tools that can overcome it. Second, even if such policy tools could be found, the link between the process of diversification and employment growth is not clear-cut. During some periods, and for some regions,
specialization may be the best growth option. During others periods, a shift in speciality
(a change in structure without diversification or specialization) may be more conducive to growth. Finally, over some periods, all regions, whether diversified or not, fare just as well (or as badly).
A related point is made by Randall & Ironside (1996) when they argue that the dangers inherent to over-specialization (principally the danger of a bust) must be set against the benefits derived from a boom. Cuadrado-Roura & Rubalcaba-Bermejo (1998) make the same point for cities. Provided that the specialty of a region or city is in demand, specialization has a lot to recommend it. But when the demand for a clustered industry’s product, or for a particular resource, drops, the regions that are specialized will suffer. There is sometimes confusion when diversity and speciality are discussed, since they are often seen as alternatives. In this paper we argue that this is not the case, since diversity (and hence urbanization economies) can only be measured at the regional level, and is often associated with region size, whereas speciality (and hence localization economies) are sector-specific and independent of region size. Regional policies premised on the cluster strategy proposed by Porter (1990) and enthusiastically embraced by the OECD can work, but they can also lead to problems if a city or region
19 becomes overreliant on any narrow set of clusters. Likewise, policies based on diversification—no doubt prudent in large metropolitan areas that can be diversified
while at the same time harbouring a large number of specialized clusters—are probably
unrealistic for many smaller cities and regions.
This does not mean that diversification policies are of no use except in large urban areas. All regions that retained the same relative economic structure over the 30-year period have undergone structural change: no region in Canada has been exempt from the structural changes that have affected the whole economy. But for a majority of regions, their evolution has merely mirrored the changing structure of the Canadian economy. The local perception is, quite correctly, that major change has occurred, but our results show that, in most cases, this change only amounts to keeping up with the economy as a whole. This is not an insignificant achievement for many smaller or remote regions. “Diversification” policies may be necessary to ensure that these regions keep up with broader changes. However, the capacity of such policies to generate employment growth and relative “catching up” with other regions should not be overstated.
REFERENCES
Acs, Z. (2002), Innovation and Growth in Cities, Edward Elgar: Northampton (MA).
Acs, Z. and A. Varga (2002), “Geography, Endogenous Growth, and Innovation”, International
Regional Science Review, 25.1: 132-148.
Alonso, W. (1973), “Urban Zero Population Growth”, Daedalus, 102: 191-206.
Beardsell, M. and V. Henderson (1999), “Spatial Evolution of the Computer Industry in the USA”, European Economic Review, 43: 431-456.
Beckstead, D. and M. Brown (2003), From Labrador to Toronto: The Industrial Diversity of
Canadian Cities: 1992-2002, Statistics Canada Micro-economic Analysis Division, paper no.
11-624-MIE.003, Ottawa: Ministry of Industry.
Carrincazeaux, C. (2000), “La notion de distance dans les analyses empiriques des effets de débordement géographique de la connaissance: une revue de la littérature”, Revue
d’économie régionale et urbaine, 2000.4 : 619-642.
Chevassus-Lozza, E. and D. Galliano (2003), “Local Spillovers, Firm and Export Behaviour : Evidence from the French Food Industry”, Regional Studies, 37.2: 147-158.
Coffey.W and R. Shearmur (1996), Employment Growth and Change in the Canadian Urban
System, 1971-1994, Ottawa: Canadian Policy Research Network.
Cuadrado-Roura, J. and L. Rubalcaba-Bermejo (1998), “Specialisation and Competition Amongst European Cities: A New Approach Through Fair and Exhibition Activities”,
Regional Studies, 32.2: 133-147.
Davis, D. and D. Weinstein (2002), “Bones, Bombs, and Break Points: The Geography of Economic Activity”, American Economic Review, December 2002: 1269-1289.
Dewhurst, J. and P. McCann (2002), “A Comparison of Measures of Industrial Specialization for Travel-to-work Areas in Great Britain, 1981-1997”, Regional Studies, 36.5: 541-551.
Dicken, P. and P. Lloyd (1990), Location in Space, New York: Harper & Row.
Duranton.G. and D. Puga (2000), “Diversity and Specialization in Cities: Why, Where and When Does it Matter?”, Urban Studies, 37: 533-555.
Echeverri-Carroll, E. and W. Brennan (1999), “Are Innovation Networks Bounded by Proximity?”, in Innovation, Networks and Localities, eds. Fischer, M., L.Suarez-Villa et M.Steiner, Springer: New-York.
Freel, M. (2000), “External Linkages and Product Innovation in Small Manufacturing Firms”,
Entrepreneurship and Regional Development, 12: 245-266.
Glaeser, E., H. Kallal, J. Scheinkman and A. Shleifer (1992), “Growth in Cities”, Journal of
Political Economy, 100.6: 1126-1152.
Gunton, T. (2003), “Natural Resources and Regional Development: An Assessment of Dependency and Comparative Advantage Paradigms”, Economic Geography, 79.1: 67-94. Hall, P. (1999), Cities in Civilization, Phoenix Giant: London.
Hansen, N. (2001), “Are Very Large Cities Successful? Searching for Dynamic Externalities Versus Evidence from Population Movements”, International Regional Science Journal, 24.3: 344-359.
Henderson, V. (1997), “Medium Sized Cities”, Regional Science and Urban Economics, 27: 583-612.
Henderson, V. (2003), “Marshall’s Scale Economies”, Journal of Urban Economics, 53: 1-28. Jacobs, J. (1969), The Economy of Cities, Vintage: New York.
Markusen, A. (1996), “Interaction Between Regional and Industrial Policies: Evidence from Four Countries”, International Regional Science Review, 19.1 & 2: 49-77 and 91-92.
O’Donoghue, D. (2000), “Some Evidence for the Convergence of Employment Structures in the British Urban System from 1978 to 1991”, Regional Studies, 34.2: 159-167.
Parr, J. (2002), “Missing Elements in the Analysis of Agglomeration Economies”, International
Regional Science Review, 25,2: 151-168.
Phelps, N., R. Fallon and C. Williams (2001), “Small Firms, Borrowed Size and the Urban-Rural Shift”, Regional Studies, 53.7: 613-624.
Phelps, N. and T. Ozawa (2003), “Contrasts in Agglomeration: Proto-industrial, Industrial and Post-industrial Forms Compared”, Progress in Human Geography, 27.5: 583-604.
Plane, D. (2003), “Perplexity, Complexity, Metroplexity, Microplexity: Perspectives for Future Research on Regional Growth and Change”, The Review of Regional Studies, 33.1: 104-120.
Polèse, M. and R. Shearmur (2002), The Periphery in the Knowledge Economy, Montreal: INRS-Urbanisation, Culture et Société and Moncton: Institut Canadien de Recherche sur le Développement Régional.
Porter, M. (1990), The Competitive Advantage of Nations, Free Press: New York.
Porter, M. (1996), “Competitive Advantage, Agglomeration Economies and Regional Policy”,
International Regional Science Review, 19.1 & 2: 85-94 and 93-94.
Quigley, J. (1998), “Urban Diversity and Economic Growth”, Journal of Economic Perspectives, 12: 127-138.
Randall, J. and R. Ironside (1996), “Communities on the Edge: an Economic Geography of Resource-Dependent Communities in Canada”, The Canadian Geographer, 40.1: 17-35. Stabler, J. (1999), “Rural America: A Challenge to Regional Scientists”, The Annals of Regional
Science, 33: 1-14.
Staber, U. (2001b), “Spatial Proximity and Firm Survival in a Declining Industrial District: the Case of Knitwear Firms in Baden-Württemberg”, Regional Studies, 35.4: 329-341.
Suarez-Villa, L. and W. Walrod (1997), “Operational Strategy, R&D and Intra-metropolitan Clustering in a Polycentric Structure: The Advanced Electronic Industries of the Los Angeles Basin”, Urban Studies, 34.9: 1343-1380.
Table 1– Par t 1: The Fi fte en Clus ters – Urba n Bra n ch 14 13 12 11 10 9 8 7 6 5 4 3 2 Clu ster 27: Div ers ifi ed an d h igh -ord er s erv ic e cen tres •
hva, transport, communication,
hi gh-te ch s ervi ces , wholes al e, r eta il , pers on al s erv ic es , f ire , profes si onal s erv ices , he alth and S S • M etro ar eas , l arg e per ipher al ci tie s • All geogr aphic r egions • 20 to 14 Clu ster 20: Gov ern men t an d h igh -ord er s erv ic e c en tres •
HIGH TECH SERVICES,
communication, fir e, p rofess. services, ADMIN • Metro ar
eas and peripher
al cities • All • 10 to 7 Cluster 256: Re
source and high-tech se
rvic es • PRIMARY, HI GH TECH SERVICES, ADMIN . • Peripheral city , peripher al rural area (in 1971) • . • 2 to 0 Clu ster 18: Res ou rce an d con su m er s erv ic e ce nt res • Pr im ar y, wholes ale , r eta il, HOT ELS & RESTA U , professional s ervices, health, educatio n • Central urban , p eripher al urba n, a few periph eral rural • All geogr aphic r egions • 61 to 82 Clu ster 43: Con su m er s ervi ce a nd tou ris m cen tres • RETAIL, HOTE L S & R E STAU, LEISURE, edu cation , h eal th • Small periph eral urban, and
small central urb
an • Quebec, P rair ies • 10 to 7 Clu ster 16: Res ou rce, h eav y s ervic es an d tou ri sm • Pr im ar y, constru ction , tr ansport, HOTELS + R E ST AU, LE IS URE • Central rur al, an d periph eral rur al • British Colum bi a, Ont ario • 23 to 17 Cluste r 26: Dive rs ifie d manufac tur ing ce ntr es • MVA, TM, HT, communication, personal serv ices, fire • Central urban , and cen tral rur al • Ontario, Quebec • 32 to 34 Cluste r 17: High te ch manufactur ing • TM, MVA, HT, wholesale • Central urban • Ontario, Quebec • 9 to 14 TM: traditional m anufacturing; MV A: medium
value added manuf
acturing; HT: high-t ech m anufacturin g; FIRE: finance, insurance and real estate.
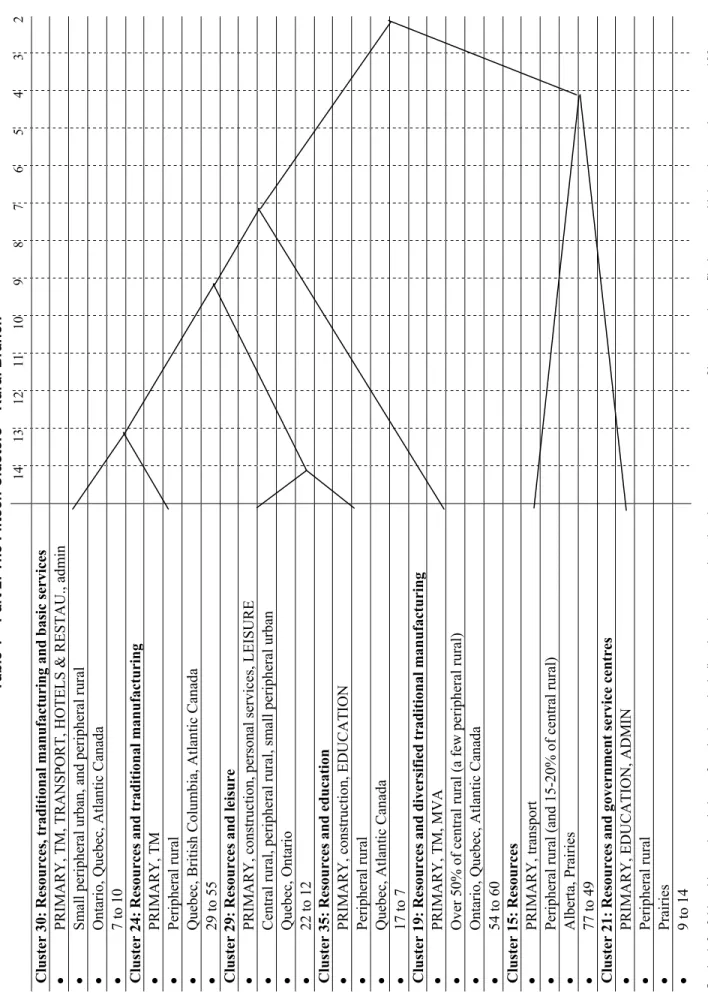
Table 1 – Pa rt 2: Th e Fifteen Clus ter s – Rural Bra n ch 14 13 12 11 10 9 8 7 6 5 4 3 Cluster 30: Resources , traditional manufacturing and basic ser vices • PRIMAR Y, T M , TRANSP ORT, HOTE LS & REST AU., a dm in • Sm al l peri ph er al ur ba n, a nd pe ri ph eral ru ral • On tario , Qu ebec, Atlan tic Can ad a • 7 t o 1 0 Cluster 24: Resources and traditi onal manufacturing • PRIM AR Y, T M • Peripheral rura l • Qu eb ec, British C olu m bia, Atlan tic Can ad a • 29 to 5 5 Cluster 29: Resources and l eisure • PR IM AR Y, c onst ruct io n, per son al ser vi ces, LEIS U R E • Central r ural , p erip heral ru ral, sm all perip her al ur ba n • Que bec, Ontari o • 22 to 1 2 Cluster 35: Resources and education • PRIM AR Y, c onstr uction , E D UCAT IO N • Peripheral rura l • Que bec, At la nt ic C anada • 17 to 7 Cluster 19: Resources and divers ified tr aditional m anufac turing • PRIM AR Y, T M , M V A • Ove r 50 % of c entral r ural (a f ew peri phe ral r ural) • On tario , Qu ebec, Atlan tic Can ad a • 54 to 6 0 Cluster 15: Resources • PRIM AR Y, tra nsp or t • Perip heral r ura l (an d 1 5-20% of central rural ) • Albe rta, Prairi es • 77 to 4 9 Cluster 21: Resources and government s ervice centres • PRIM AR Y, E DUC ATI O N, ADM IN • Peripheral rura l • Prairies • 9 t o 1 4 On the left of t
his table are descrip
tions of each cluster incl
uding the cluster number,
the cluster name,
a summar
y
of its eco
nomic profile (sectors
w
ith
location quotients over 120 or
among the top
3
for the 15 cluster
s are capitalized), the t
ype
of regi
on found in it, the
geographic re
gions it covers, and the
size of the cluster in 1971 and 2001 (
number
of regions in the
cluster). On the
right is the cluster tree:
it describes the
w
a
y in
w
hich clusters join
as o ne moves from 1 5 to 1 cluster. It g ives an indication of ho w simila r or dissim
ilar the clu
sters are
among themselves (the furth
er up the y join the mo re dissimilar the y are).
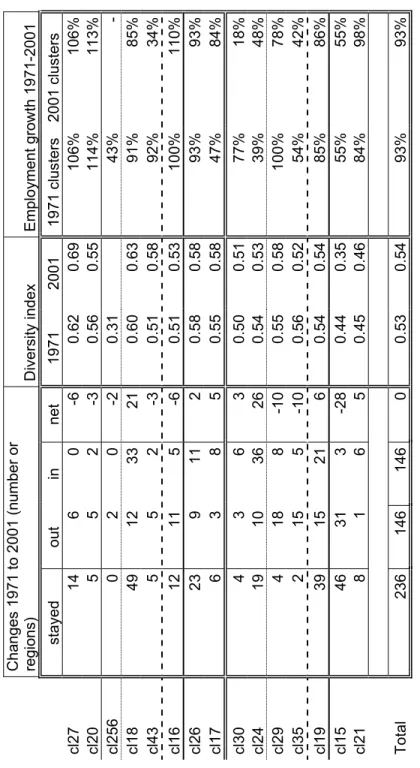
Table 2: Vari ous Sta tistic s Relatin g to the 15 Clu st ers Cha nge s 19 71 to 2001 (n um ber o r regio ns) Diversity inde x Employment gro w th 197 1-2001 stayed out in net 1971 2001 1971 clu sters 2001 clu sters cl27 14 6 0 -6 0.62 0.69 106% 106% cl20 5 5 2 -3 0.56 0.55 114% 113% cl25 6 0 2 0 -2 0.31 43% -cl18 49 12 33 21 0.60 0.63 91% 85% cl43 5 5 2 -3 0.51 0.58 92% 34% cl16 12 11 5 -6 0.51 0.53 100% 110% cl26 23 9 11 2 0.58 0.58 93% 93% cl17 6 3 8 5 0.55 0.58 47% 84% cl30 4 3 6 3 0.50 0.51 77% 18% cl24 19 10 36 26 0.54 0.53 39% 48% cl29 4 18 8 -10 0.55 0.58 100% 78% cl35 2 15 5 -10 0.56 0.52 54% 42% cl19 39 15 21 6 0.54 0.54 85% 86% cl15 46 31 3 -28 0.44 0.35 55% 55% cl21 8 1 6 5 0.45 0.46 84% 98% Total 236 146 146 0 0.53 0.54 93% 93% NB: Emplo yment gro w
th is calculated from total em
pl o yment in each cluster. It is not an average— because the
composition of the clusters changes, empl
o yment gro w th a nd diver sificat
ion are calculated on the bas
is of the 1971 an
d
the 2001 memb
e
rs. The diversification index fo
r 19
71is bas
ed on the 1971 cluster pr
ofile for the 1971
members; the
diversificat
ion index for
2001 is ba
sed on t
he 2001
cluster profile for
the 2001 memb
e
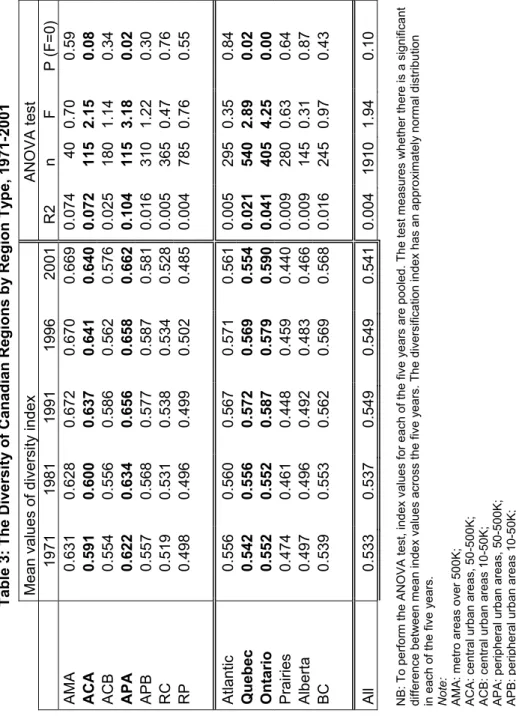
Table 3: Th e Div ersit y of Cana dian Re gions b y Re gion T ype, 1971-200 1 Mean value s of diversity index ANOVA test 1971 1981 1991 1996 2001 R2 n F P (F=0 AMA 0.631 0.628 0.672 0.670 0.669 0.074 40 0.70 0.59 ACA 0.591 0.600 0.637 0.641 0.640 0.072 115 2.15 0.08 ACB 0.554 0.556 0.586 0.562 0.576 0.025 180 1.14 0.34 APA 0.622 0.634 0.656 0.658 0.662 0.104 115 3.18 0.02 APB 0.557 0.568 0.577 0.587 0.581 0.016 310 1.22 0.30 RC 0.519 0.531 0.538 0.534 0.528 0.005 365 0.47 0.76 RP 0.498 0.496 0.499 0.502 0.485 0.004 785 0.76 0.55 Atlantic 0.556 0.560 0.567 0.571 0.561 0.005 295 0.35 0.84 Quebe c 0.542 0.556 0.572 0. 569 0.554 0.021 540 2.89 0.02 Onta rio 0.552 0.552 0.587 0. 579 0.590 0.041 405 4.25 0.00 Prairie s 0.474 0.461 0.448 0.459 0.440 0.009 280 0.63 0.64 Alberta 0.497 0.496 0.492 0. 483 0.466 0.009 145 0.31 0.87 BC 0.539 0.553 0.562 0.569 0.568 0.016 245 0.97 0.43 All 0.533 0.537 0.549 0.549 0.541 0.004 1910 1.94 0.10 NB: To pe rform t he ANOVA test, i
ndex values for e
ach of the fi
ve
ye
ars are pooled.
T he test measures w h ether t here is a signifi difference bet w e en mean inde x values across t he five y ea rs. The diversification inde x has an ap pro ximatel y norm al distribution
in each of the five
ye
a
rs.
Note: AMA: metro ar
ea
s over 500K;
ACA: central urb
an areas, 50
-500
K;
ACB: central urb
an areas 10 -50K; APA: peripheral urban a reas, 50-500K; APB: peripheral urban a reas 10-5 0K; RC: central ru ral areas; RP: peripher al ru ral areas.