HAL Id: hal-01380389
https://hal.archives-ouvertes.fr/hal-01380389
Submitted on 13 Oct 2016
HAL is a multi-disciplinary open access
archive for the deposit and dissemination of
sci-entific research documents, whether they are
pub-lished or not. The documents may come from
teaching and research institutions in France or
abroad, or from public or private research centers.
L’archive ouverte pluridisciplinaire HAL, est
destinée au dépôt et à la diffusion de documents
scientifiques de niveau recherche, publiés ou non,
émanant des établissements d’enseignement et de
recherche français ou étrangers, des laboratoires
publics ou privés.
Geoscope stations
Guilhem Barruol, Walid Ben Ismail
To cite this version:
Guilhem Barruol, Walid Ben Ismail. Upper mantle anisotropy beneath the African IRIS and Geoscope
stations. Geophysical Journal International, Oxford University Press (OUP), 2001, 146 (2),
pp.549-561. �10.1046/j.0956-540x.2001.01481.x�. �hal-01380389�
Upper mantle anisotropy beneath the African IRIS and
Geoscope stations
Guilhem Barruol and Walid Ben Ismail
Laboratoire de Tectonophysique, CNRS, Universite´ Montpellier II, 34095 Montpellier cedex 5, France. E-mail: [email protected]
Accepted 2001 April 7. Received 2001 March 12; in original form 2000 November 10
S U M M A R Y
Upper mantle anisotropy beneath the African IRIS and Geoscope stations is investi-gated through the measurements of splitting of teleseismic shear waves such as SKS, SKKS and PKS phases. Seismic anisotropy data are interesting on their own as a measure of upper mantle active or frozen deformation beneath a given station, but each station is of potential interest since it can be used to retrieve source-side seismic anisotropy at remote sites if one is able to perform station-side anisotropy correction. We performed systematic investigations of teleseismic shear wave splitting at 15 stations from the IRIS and Geoscope global seismic networks, which are located on both the oceanic and the continental parts of the African plate. Anisotropy is generally well observed at continental stations. The patterns we present generally show much more complexity than the results previously published from smaller data sets. Despite this complexity, the splitting parameters generally appear in several places to contain a signature of the regional geodynamic setting (rift structures, Archaean craton, Pan-African belt), although a deeper source of anisotropy (asthenospheric) may be present. At the oceanic stations, anisotropy measurements are much more difficult to perform because the signal is generally of poor quality. MSEY, in the Seychelles (Indian ocean), is the exception and displays a clear correlation of the azimuth of the fast split shear wave with the trend of the absolute plate motion, as defined by hotspot tracks. Key words: anisotropy, asthenosphere, lithosphere deformation, mantle, shear wave splitting, upper mantle.
I N T R O D U C T I O N
Seismic anisotropy in the upper mantle is primarily induced by preferred alignment of crystals, particularly those of olivine, which represents the major upper mantle mineral phase (Nicolas & Christensen 1987; Mainprice et al. 2000). Teleseismic core shear waves such as SKS, SKKS or PKS phases can be used to retrieve the structure and the deformation beneath a given station. These phases, generated from P-to-S conversion at the core–mantle boundary (CMB), have the properties of being initially polarized along the radial direction at the CMB and have lost any information on the anisotropy along the down-going path from the source to the outer core. These phases are affected by the birefringence of the medium during their way up to the Earth’s surface and are split into two perpendicular polarized waves that propagate at different velocities when they enter an anisotropic layer. At the Earth’s surface, the signal recorded by three-component seismic stations can be analysed in order to retrieve the azimuth w of the fast split shear wave and the delay time dt between the two split waves. These para-meters characterize the anisotropy along the vertical direction
beneath the station that reflects upper mantle pervasive structures (Mainprice & Silver 1993) and tectonic processes (Silver & Chan 1988). The magnitude of dt depends on both the thickness and the magnitude of the medium anisotropy, and the orientation w of the polarization plane of the fast split shear wave is related to the pervasive orientation of the structure.
On the way from the CMB to the Earth’s surface, no evidence of anisotropy has yet been found in the lower mantle
except in its lowermost part, in the Da layer (Garnero & Lay
1997; Kendall & Silver 1998). Although the Da anisotropy
seems to be transversally isotropic with a vertical axis of sym-metry and therefore mostly sensitive to horizontally propagating shear waves and isotropic for vertically propagating shear waves, some discrepancies between SKS and SKKS splitting sometimes observed on the same records could be explained by
Da structure. Some anisotropy has been locally described in the
upper mantle transition zone (Montagner 1998; Vinnik et al. 1998; Mainprice et al. 2000) but it is broadly accepted that most of the anisotropy lies in the olivine stability field, that is, in the uppermost 400 km of the Earth. Crustal anisotropy related to upper crustal microfracturing and/or to lower crustal pervasive
fabric may contribute to a few tenths of a second (e.g. Barruol & Mainprice 1993; Herquel et al. 1995) in the splitting of SKS waves, which is 1 s on average (Silver 1996).
The SKS splitting technique has a poor vertical resolution since the delay time can be acquired anywhere between the CMB and the surface and therefore tectonic interpretations are open to question (Savage 1999). Some interpretations have been advanced, however: the anisotropy could be generated by present-day upper mantle flow such as the asthenospheric deformation beneath a rigid moving plate (e.g. Vinnik et al. 1992; Tommasi et al. 1996) or beneath a rift zone (e.g. Gao et al. 1997). Alternatively, seismic anisotropy could be induced by frozen lithospheric deformation acquired during past tectonic processes (Silver 1996; Barruol et al. 1998) or pervasive structures related to the build-up of the lithosphere by accretion of various microplates around a pre-subducted oceanic plate (Babuska et al. 1993).
Although the number of anisotropy measurements obtained from permanent stations or temporary experiments is increasing worldwide, their global distribution is extremely heterogeneous and most of the data originate from North America and Eurasia (Silver 1996). Compared to the other continents, the coverage of the African plate by permanent stations is sparse. Although several temporary experiments have been deployed during the
last decade to investigate regional upper mantle structures, the deep structures of this continent are largely unknown. These experiments focused on the East African rift (Achauer et al. 1994; Gao et al. 1997; Nyblade et al. 1998), the South African craton (Vinnik et al. 1995; James et al. 2001 ; Silver et al. 2001), the Central African shear zone (Plomerova et al. 1993) or the Hoggar (Ayadi et al. 2000). At larger scale, surface wave studies have given some insights into the large-scale pattern of the azimuthal anisotropy of the African continent (Hadiouche et al. 1989) and more recently a shear velocity model of the African upper mantle gave more details on the deep structures of the plate (Ritsema & van Heijst 2000).
By using the few permanent seismic stations located on the African plate (see location Table 1 and Fig. 1), we went through the whole set of available data and systematically determined the anisotropy parameters corresponding to the upper mantle deformation beneath the stations. We updated the database at sites where measurements were already published. We pre-sent in this paper new measurements performed at the IRIS permanent stations on events covering the period 1994–1999 and we update for the period 1996–1999 the measurements for the Geoscope stations already published by Barruol & Hoffmann (1999) for the period 1990–1996. In this way, we provide an updated view of SKS anisotropy beneath the
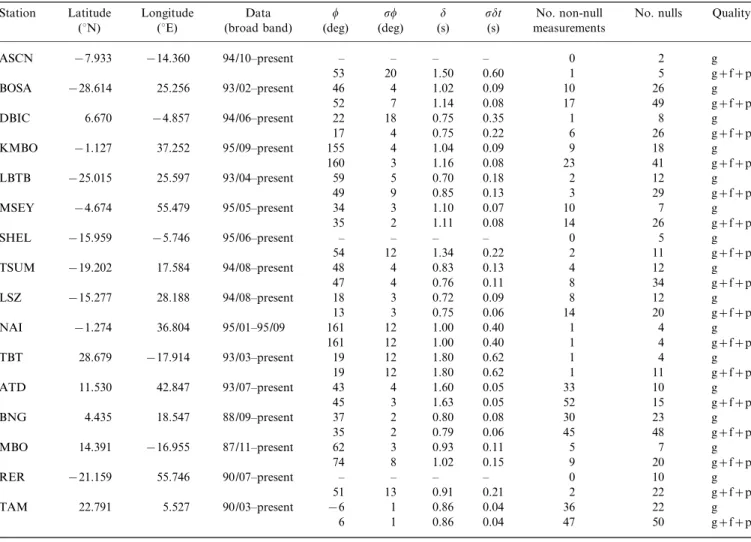
Table 1. Station locations and mean splitting parameters with the corresponding 1s error bars. The number and quality of individual splitting measurements from which the average values are calculated is also tabulated. The number of nulls is also indicated for each station.
Station Latitude (uN) Longitude (uE) Data (broad band) w (deg) sw (deg) d (s) sdt (s) No. non-null measurements
No. nulls Quality
ASCN x7.933 x14.360 94/10–present – 53 – 20 – 1.50 – 0.60 0 1 2 5 g g+f+p BOSA x28.614 25.256 93/02–present 46 52 4 7 1.02 1.14 0.09 0.08 10 17 26 49 g g+f+p DBIC 6.670 x4.857 94/06–present 22 17 18 4 0.75 0.75 0.35 0.22 1 6 8 26 g g+f+p KMBO x1.127 37.252 95/09–present 155 160 4 3 1.04 1.16 0.09 0.08 9 23 18 41 g g+f+p LBTB x25.015 25.597 93/04–present 59 49 5 9 0.70 0.85 0.18 0.13 2 3 12 29 g g+f+p MSEY x4.674 55.479 95/05–present 34 35 3 2 1.10 1.11 0.07 0.08 10 14 7 26 g g+f+p SHEL x15.959 x5.746 95/06–present – 54 – 12 – 1.34 – 0.22 0 2 5 11 g g+f+p TSUM x19.202 17.584 94/08–present 48 47 4 4 0.83 0.76 0.13 0.11 4 8 12 34 g g+f+p LSZ x15.277 28.188 94/08–present 18 13 3 3 0.72 0.75 0.09 0.06 8 14 12 20 g g+f+p NAI x1.274 36.804 95/01–95/09 161 161 12 12 1.00 1.00 0.40 0.40 1 1 4 4 g g+f+p TBT 28.679 x17.914 93/03–present 19 19 12 12 1.80 1.80 0.62 0.62 1 1 4 11 g g+f+p ATD 11.530 42.847 93/07–present 43 45 4 3 1.60 1.63 0.05 0.05 33 52 10 15 g g+f+p BNG 4.435 18.547 88/09–present 37 35 2 2 0.80 0.79 0.08 0.06 30 45 23 48 g g+f+p MBO 14.391 x16.955 87/11–present 62 74 3 8 0.93 1.02 0.11 0.15 5 9 7 20 g g+f+p RER x21.159 55.746 90/07–present – 51 – 13 – 0.91 – 0.21 0 2 10 22 g g+f+p TAM 22.791 5.527 90/03–present x6 6 1 1 0.86 0.86 0.04 0.04 36 47 22 50 g g+f+p
permanent stations of the African plate. The data set we present covers both the oceanic and continental parts of the African plate and also various geodynamic settings. Before discussing some possible tectonic interpretations of the anisotropy at various sites, we first present the data selection procedure and the method of shear wave splitting measurements and we analyse the anisotropy results.
D A T A , M E T H O D A N D R E S U L T S
We selected data for splitting measurements on the basis of both their magnitude (generally larger than 6.0 Mb) and their
distance to the station (larger than 85u and generally lower than
120u) for the period 1994–1999 for the IRIS stations and for the
period 1996–1999 for the Geoscope stations. The event origins and locations (Table 2, available in the online version of the journal at http://www.blackwell-synergy.com) are derived from the USGS Preliminary Determination of Epicentres, and the phase arrivals are computed using the IASP91 earth reference model (Kennett 1995). From the whole set of events obtained at each station, a visual inspection and a rough filtering allowed us to keep about 500 events for which the seismic signal was clearly above the noise level (typically with a signal-to-noise ratio above 5) and for which an SKS and/or SKKS phase was clearly identified. From these 500 events, we performed about 680 individual splitting measurements at the permanent stations, the results of which may be found in Table 3 (available in the online version of the journal at http://www.blackwell-synergy.com).
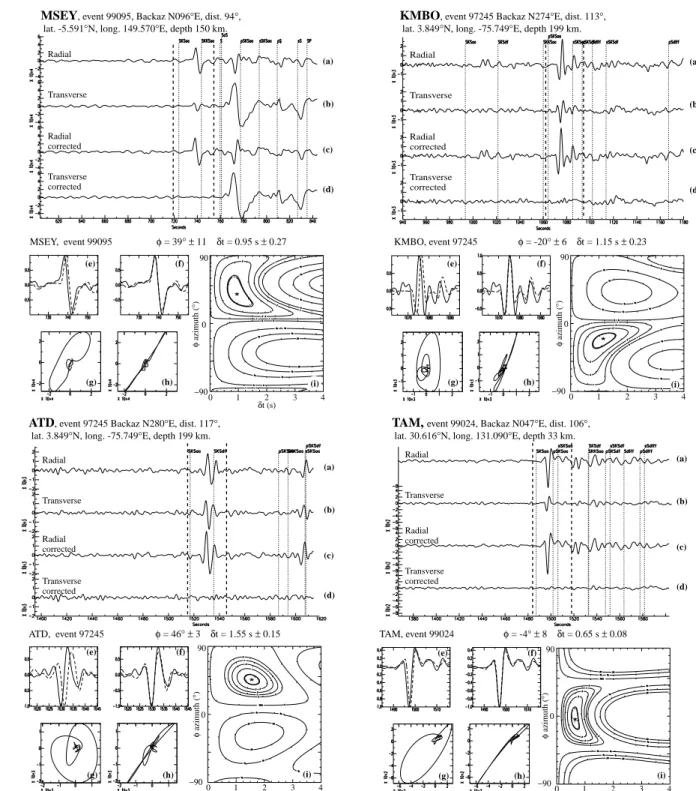
The shear wave splitting measurements were obtained using the algorithm of Silver & Chan (1991). This method determines the anisotropy parameters w and dt that best remove energy on the transverse component of the seismogram for a selected time window. In order to characterize the upper mantle anisotropy, SKS phases are generally used but splitting of SKKS or PKS phases is also of potential interest. A few examples of splitting measurements are shown in Fig. 2 for stations MSEY in the Indian Ocean, KMBO in the Kenya rift, ATD in Afar, TAM in the Hoggar, TBT in the Canary Islands, TSUM in Namibia, LSZ in Zambia and DBIC in Cote d’Ivoire. Many ‘nulls’ characterized by the absence of signal on the transverse com-ponent are also observed at each site. They indicate either the absence of anisotropy beneath the station or that the initial polarization direction of the SKS wave is parallel to the fast or slow direction in the anisotropic layer. The results of the individual splitting parameters are presented in Table 3 (online) together with their 95 per cent confidence intervals. We also
ascribe a quality factor (g=good, f=fair, p=poor) to each
individual splitting measurement depending on the signal-to-noise ratio of the initial phase, the rectilinear polarization of the particle motion in the horizontal plane after anisotropy correction, and the waveform correlation between the fast and slow split shear waves. Table 1 summarizes the number of null and non-null measurements depending on their quality. Statistically, null measurements may represent at some stations more than two-thirds of the individual measurements. Fair and poor measurements also represent generally more than two-thirds of the measurements. In summary, despite the apparently
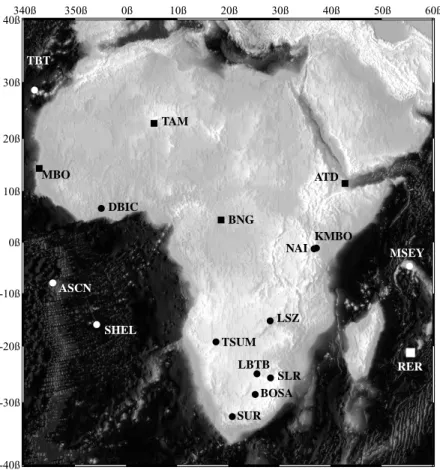
340ß 350ß 0ß 10ß 20ß 30ß 40ß 50ß 60ß -40ß -30ß -20ß -10ß 0ß 10ß 20ß 30ß 40ß DBIC MBO TAM BNG ATD KMBO MSEY RER SHEL ASCN TBT NAI LSZ TSUM LBTB SLR BOSA SUR
ATD, event 97245 φ = 46°± 3 δt = 1.55 s ± 0.15
MSEY, event 99095 φ = 39°± 11 δt = 0.95 s ± 0.27 KMBO, event 97245 φ = -20°± 6 δt = 1.15 s ± 0.23
TAM, event 99024 φ = -4°± 8 δt = 0.65 s ± 0.08
MSEY, event 99095, Backaz N096°E, dist. 94°, lat. -5.591°N, long. 149.570°E, depth 150 km.
TAM, event 99024, Backaz N047°E, dist. 106°, lat. 30.616°N, long. 131.090°E, depth 33 km. Radial Transverse Radial corrected Transverse corrected Radial Transverse Radial corrected Transverse corrected Radial Transverse Radial corrected Transverse corrected Radial Transverse Radial corrected Transverse corrected
KMBO, event 97245 Backaz N274°E, dist. 113°, lat. 3.849°N, long. -75.749°E, depth 199 km.
δt (s) δt (s) 0 1 2 3 4 φ azimuth ( ° ) 0 90 −90 0 1 2 3 4 δt (s) φ azimuth ( ° ) 0 90 −90 (a) (b) (c) (d) (a) (b) (c) (d) (a) (b) (c) (d) (e) (f) (g) (h) (i) (a) (b) (c) (d) (e) (f) (g) (h) (i) (e) (f) (g) (h) (i)
ATD, event 97245 Backaz N280°E, dist. 117°, lat. 3.849°N, long. -75.749°E, depth 199 km.
0 1 2 3 4 φ azimuth ( ° ) 0 90 −90 0 1 2 3 4 φ azimuth ( ° ) 0 90 −90 (e) (f) (g) (h) (i)
Figure 2. Examples of splitting measurements at eight stations covering various continental and oceanic geodynamic settings: SKS phase for event 99095 (05/04/99 at 11:08:04.0) recorded at stations MSEY SKKS phase for event 97245 (02/09/97 at 12:13:22.9) recorded at KMBO, Kenya, in the East African rift, SKS phase for the same event 97245 at ATD, SKS phase for event 99024 (24/01/99 at 08:00:08.5) recorded at TAM, SKS phase recorded at DBIC for event 98091 (01/04/98 at 17:56:23.3), SKS phase recorded at TSUM for event 98093 (03/04/98 at 22:01:48.2), SKS phase for event 94281 (08/10/94 at 21:44:09.1) at LSZ and SKS+SKKS phases for event 95147 (27/05/95 at 13:03:55.6) recorded at TBT. For each station we show two upper traces: the initial radial (a) and transverse (b) components (note the energy on the transverse component). Two lower traces (c and d): the same traces corrected for anisotropy (there is no longer energy on the transverse component). The vertical thin dashed lines represent the predicted phase arrival times from the IASP91 earth model. The vertical thick dashed lines give the time window on which the splitting measurement is made. The four diagrams on the lower left represent the plots of the fast and slow components (dashed and continuous lines, respectively) of the split shear waves, raw (e) and corrected (f) for the best calculated delay time. Particle motions in the horizontal plane are shown below, also uncorrected (g) and corrected (h) for the anisotropy: the elliptical particle motion becomes rectilinear when the anisotropy is corrected. The lower right diagrams (i) represent the contour plot of energy on the transverse component as a function of the delay time dt (seconds) and the polarization angle w (degrees) of the fast split shear wave. The double contour represents the 95 per cent confidence interval.
large data set used in this study, the careful data selection and the strict sorting of the individual measurements based on their quality generally leaves us with fewer than five non-null splitting measurements of good quality each year.
When necessary, seismograms were band-pass filtered (Butterworth filter with corners typically around 0.01 and 0.3 Hz) in order to remove long-period signals and high-frequency noise that would impede the splitting measurement. Since the apparent anisotropy parameters measured at the surface could be sensitive to short-scale heterogeneities beneath
the station (Marson-Pidgeon & Savage 1997), we try to charac-terize the dependence of the anisotropy parameters on the main period of the signal. For a few events at each station, we measured the splitting parameters on band-pass filtered seismo-grams with dominant periods of around 5, 10, 15 and 20 s. These tests do not show any clear dependence of the splitting parameters on the main period of the signal. In some examples, however, higher dt were observed at longer periods, but generally accompanied by larger error bars that render them fully com-patible with the unfiltered measurements. These tests therefore
DBIC, event 98091 φ = 14°± 13 δt = 0.85 s ± 0.26 TSUM, event 98093 φ = 40°± 13 δt = 0.85 s ± 0.20
TBT, event 95147 φ = 19°± 8 δt = 1.80 s ± 0.53 LSZ, event 94281 φ = 15°± 11 δt = 0.95 s ± 0.33 δt (s) 0 1 2 3 4 φ azimuth ( ° ) 0 90 −90 δt (s) 0 1 2 3 4 φ azimuth ( ° ) 0 90 −90 δt (s) 0 1 2 3 4 φ azimuth ( ° ) 0 90 −90 δt (s) 0 1 2 3 4 φ azimuth ( ° ) 0 90 −90
DBIC, event 98091, Backaz N89°E, dist. 104°, lat. -0.544°N, long. 99.261°E, depth 56 km.
TSUM, event 98093, Backaz N262°E, dist. 89°, lat. -8.148°N, long. -74.238°E, depth 165 km.
LSZ, event 94281, Backaz N094°E, dist. 99°, lat. -1.222°N, long. 127.990°E, depth 31 km.
TBT, event 95147, Backaz N012°E, dist. 97°, lat. 52.563°N, long. 142.810°E, depth 33 km.
Radial Transverse Radial corrected Transverse corrected Radial Transverse Radial corrected Transverse corrected Radial Transverse Radial corrected Transverse corrected Radial Transverse Radial corrected Transverse corrected (a) (b) (c) (d) (a) (b) (c) (d) (a) (b) (c) (d) (a) (b) (c) (d) (e) (f) (g) (h) (i) (e) (f) (g) (h) (i) (e) (f) (g) (h) (i) (e) (f) (g) (h) (i) Figure 2. (Continued.)
did not show evidence of clear frequency-dependent aniso-tropy but showed instead that the best results are generally obtained for unfiltered data or data band-pass filtered to remove
long-period (>100 s) and high-frequency (>5 Hz) noise, if any.
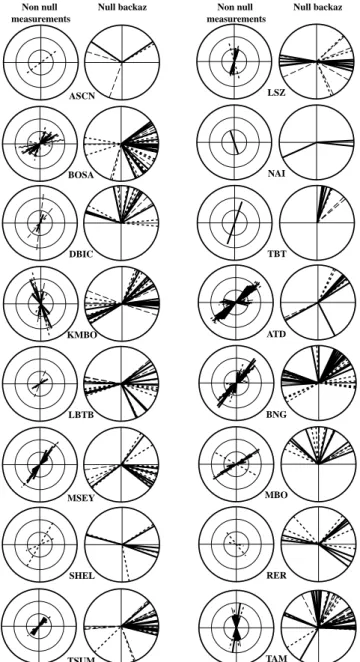
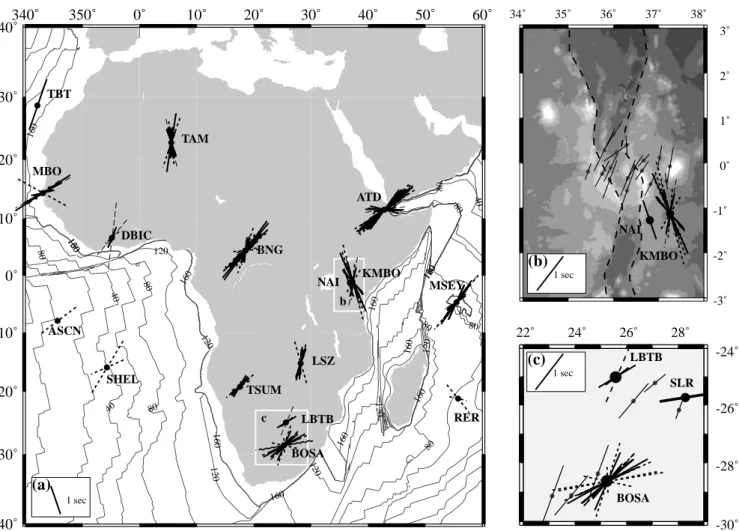
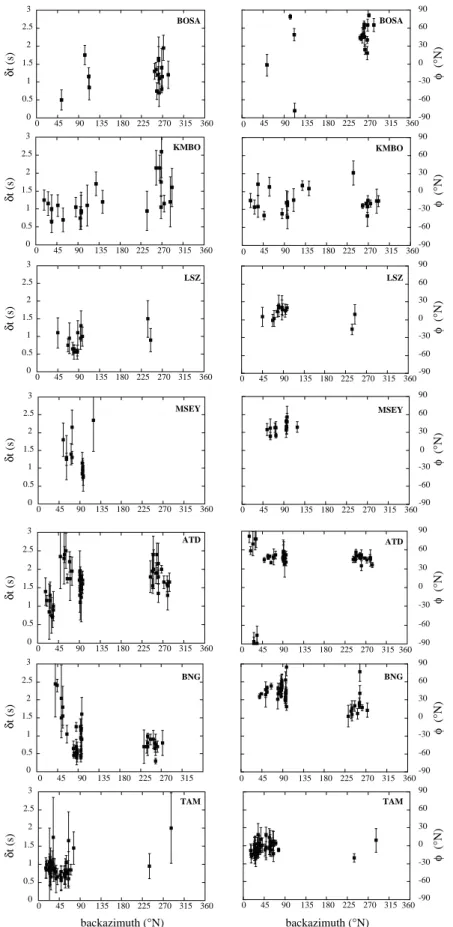
Fig. 3 summarizes the individual splitting results at the IRIS and Geoscope African stations. For each station, the left diagram indicates the measured splitting parameters (w, dt) and the right diagram shows the backazimuth of the events for
which no anisotropy was detected (i.e. the null directions). The number of splitting measurements and null measurements are summarized in Table 1 to give the reader some idea of the size of the data set used in this study and therefore of the confidence in the results. Fig. 3, together with Table 3 (online), shows that the number of data and also the number of splitting measurements are not homogeneous from station to station. In particular, it is noted that it is difficult to obtain clear signals at some oceanic stations: at ASCN, SHEL and TBT, we only kept, respectively, 6, 13 and 12 events. From these events, only one good non-null splitting measurement has been per-formed at TBT (see Fig. 2). This is mainly because oceanic stations are generally much more noisy than continental stations. Surprisingly, this is not the case at MSEY, which provides a larger set of events (about 40 events selected) that allow about 10 splitting measurements of high quality. Fig. 4 shows the same splitting results in their geographical locations, with two closer regional views of the Kenya rift area and the Kaapvaal craton in South Africa.
Comparisons with previously published data were made by Barruol & Hoffmann (1999) for the anisotropy beneath the Geoscope stations for the period 1989–1996. The two or three supplementary years of data included in the present study induced only minor changes in the average (generally less than
5u in azimuth and less than 0.1 s in delay time) that do not
require us to compare our results again with the previously published ones.
Under the assumption that anisotropy is located within a single horizontal layer beneath the station, only a small amount of variation of the splitting parameters (w, dt) due to statistical noise is expected as a function of the event backazimuths. Silver & Savage (1994) have shown that splitting measurements are still valid in the case of structures more complex than a single anisotropic layer, but that apparent variations in the aniso-tropy parameters are to be expected. These parameters (w, dt) should theoretically vary with a p/2 periodicity of the back-azimuth in the case of two horizontal layers and with a p periodicity of the backazimuth in the case of a dipping layer. In order to test the presence of such structures beneath the stations, we try to detect possible backazimuthal dependence of the splitting parameters. In our data set, a first group of stations is characterized by not enough non-null measurements to continue the process further (ASCN, DBIC, LBTB, SHEL, NAI, TBT, MBO, RER). We present in Fig. 5 the splitting parameters measured at the other stations as a function of the backazimuth of the event. This figure illustrates well the lack in backazimuthal coverage that strongly limits this investi-gation, but departures from the simplest one-layer model may, however, be detected. At ATD, the results are generally well
grouped around values of w of about N050uE and of dt ranging
between 1.5 and 2.0 s, except for waves arriving with a
back-azimuth around N030uE, which give an anisotropy oriented
E–W and a much lower delay time around 1.0 s. The absence of clear periodicity suggests that the waves arriving from this
N030uE backazimuth sample a different structure and
there-fore favour the presence of lateral heterogeneities in the upper mantle beneath this station. Similarly, at BNG we also observe different anisotropy parameters from two groups of
back-azimuths: waves arriving with backazimuths between N045uE
and N090uE are characterized by dt in the range 0.5–2.0 s and
by w in the range N030uE–N060uE, whereas waves arriving
between N225uE and N270uE are characterized by smaller dt
ASCN BOSA DBIC KMBO LBTB MSEY SHEL TSUM LSZ NAI TBT TAM RER MBO BNG ATD Non null measurements
Null backaz Non null measurements
Null backaz
Figure 3. Summary of splitting (left) and null (right) measurements at each IRIS and Geoscope station. For the latter, the new results (data covering the period 1996–1999) are plotted together with the previously published SKS splitting (Barruol & Hoffmann 1999). Left: the lines in each diagram represent w (the azimuth of the fast split shear wave) and their lengths are proportional to the delay time dt (up to 3.0 s, each circle representing a dt of 1.0 s). Black lines correspond to well-constrained results, thick dashed lines to fair and thin dashed lines to poorly constrained results (as reported in Table 3 online). Right: for null measurements we show the backazimuth (radial direction) of the unsplit events.
(0.5–1.0 s) and w between N–S and N030uE. There is no evidence of p periodicity since the strong decrease in dt for the
back-azimuths between N030uE and N090uE should also be visible for
waves arriving at backazimuths between N225uE and N270uE,
which is not observed. This also favours the presence of lateral structure variations in the upper mantle beneath BNG instead of dipping structures. These lateral variations may explain some
discrepancies between our mean results (dt=0.79, w=35u) and
the results recently obtained by Chevrot (2000) (dt=0.74
and w=17u) with a technique assuming small lateral variation.
At TAM, Barruol & Hoffmann (1999) detected some slight backazimuthal variations in the anisotropy parameters that could be consistent with a two-layer model with a lower fast direction trending parallel to the motion of the plate (around
N045uE; Gripp & Gordon 1990) and an upper fast direction
oriented roughly N–S. Including three more years of data does not contradict this model. The IRIS stations LSZ and MSEY do not show evidence of backazimuthal control of the aniso-tropy parameters. At BOSA, a large scatter in the measured anisotropy parameters occurs in a small backazimuthal window.
Events arriving with backazimuths between 250u and 280u
show variations in dt ranging from 0.7 to 2.0 s and in w from
N020uE to N070uE. No internal coherence appears on this
diagram, suggesting that such scatter could be induced by local or small-scale heterogeneities and perhaps enhanced by the rather high noise level observed at this site. The backazimuthal coverage is much better at KMBO. The periodicity of the dt variations is, however, not of p: the small dt observed at a
backazimuth of about N050uE should be present at N230uE,
and the large dt observed at N270uE should be present at
N090uE, which is not the case. This suggests a much more
complex structure that could involve the presence of several anisotropic layers, dipping anisotropies, heterogeneities and/or simultaneous origins of anisotropy such as frozen and active mantle flow and the presence of partial melt in anisometric pockets (e.g. Vauchez et al. 2000). We present in Fig. 6 some simple models of two anisotropic layers that can explain parts of our observations and we discuss in the next section some possible structures beneath this area.
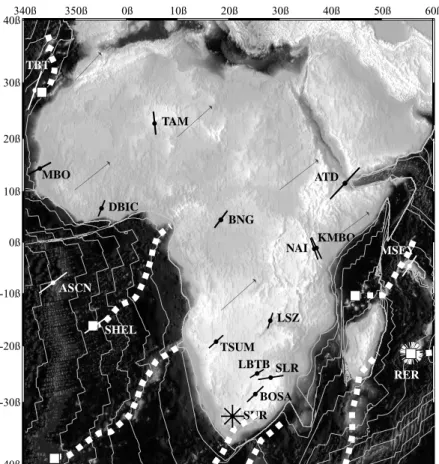
In order to provide a coherent set of upper mantle aniso-tropy observations, we present in the map in Fig. 7 the mean anisotropy values of teleseismic shear wave splitting reported in Table 1, together with the hotspot tracks, the absolute motion vectors and the age contours in the oceans.
340˚
350˚
0˚
10˚
20˚
30˚
40˚
50˚
60˚
-40˚
-30˚
-20˚
-10˚
0˚
10˚
20˚
30˚
40˚
40 40 40 80 80 80 80 80 80 80 80 120 120 120 120 120 120 120 120 160 160 160 160 160 160 160 160 160 160 34˚ 35˚ 36˚ 37˚ 38˚ -3˚ -2˚ -1˚ 0˚ 1˚ 2˚ 3˚ 22˚ 24˚ 26˚ 28˚ -30˚ -28˚ -26˚ -24˚ 1 sec 1 sec 1 sec(a)
(c)
BOSA LBTB SLR NAI KMBO(b)
b c DBIC MBO TAM BNG ATD KMBO MSEY RER SHEL ASCN TBT NAI LSZ TSUM LBTB BOSAFigure 4. Splitting measurements carried out in this study reported in their geographical locations. Note that the two southern Atlantic stations ASCN and SHEL only show ‘fair’ measurements and that MSEY in the Indian ocean has well-defined splitting parameters. Fig. 4(b) is a close-up view around KMBO and NAI in the east African rift with the splitting measurements performed by Gao et al. (1997). Dashed lines show the trend of the rift. We report in Fig. 4(c) our measurements at BOSA and LBTB on the Kaapvaal craton together with the measurements performed by Vinnik et al. (1995).
0 0.5 1 1.5 2 2.5 3 0 45 90 135 180 225 270 315 360 backazimuth (°N) backazimuth (°N) -90 -60 -30 0 30 60 90 0 45 90 135 180 225 270 315 360 φ ( ° N) φ ( ° N) φ ( ° N) φ ( ° N) φ ( ° N) φ ( ° N) φ ( ° N) 0 0.5 1 1.5 2 2.5 3 0 45 90 135 180 225 270 315 360 -90 -60 -30 0 30 60 90 45 90 135 180 225 270 315 360 360 360 δ t (s) δ t (s) δ t (s) δ t (s) δ t (s) δ t (s) δ t (s) KMBO KMBO BOSA TAM MSEY LSZ MSEY ATD ATD BNG BNG LSZ TAM BOSA 0 0 0.5 1 1.5 2 2.5 3 0 45 90 135 180 225 270 315 360 -90 -60 -30 0 30 60 90 0 45 90 135 180 225 270 315 0 0.5 1 1.5 2 2.5 3 0 45 90 135 180 225 270 315 360 -90 -60 -30 0 30 60 90 0 45 90 135 180 225 270 315 0 0.5 1 1.5 2 2.5 3 0 45 90 135 180 225 270 315 -90 -60 -30 0 30 60 90 0 45 90 135 180 225 270 315 360 0 0.5 1 1.5 2 2.5 3 0 45 90 135 180 225 270 315 360 -90 -60 -30 0 30 60 90 0 45 90 135 180 225 270 315 360 0 0.5 1 1.5 2 2.5 3 0 45 90 135 180 225 270 315 360 -90 -60 -30 0 30 60 90 0 45 90 135 180 225 270 315 360
Figure 5. Anisotropy parameters (w and dt) as a function of the backazimuth of the events performed at IRIS stations BOSA, KMBO, LSZ and MSEY and at the Geoscope stations ATD, BNG and TAM. Only these stations have enough data to discuss a potential dependence of the splitting parameters on the event backazimuth.
0 0.5 1 1.5 2 2.5 0 60 120 180 240 300 360 Dtapp (phi2=-20.) Dtapp (phi2=-10.) Dtapp (phi2= 0.) Dtapp (phi2= 10.) Dtapp (phi2= 20.) observed dt δ tapp (s) Backazimuth (°N) Backazimuth (°N) -90 -60 -30 0 30 60 90 0 60 120 180 240 300 360 Phiapp (phi2=-20.) Phiapp (phi2=-10.) Phiapp (phi2= 0.) Phiapp (phi2= 10.) Phiapp (phi2= 20.) observed phi φ app ( ° N)
Figure 6. A simple model consisting of two anisotropic layers that could explain apparent variations of the anisotropy parameters w and dt at KMBO. We plot the apparent variations of the observed delay time (dtapp, left) and azimuth of the fast split shear wave (wapp, right) as a function of
the backazimuth of the wave crossing this two-layered structure. The curves represent the predicted variations of the apparent w and dt in the case of two anisotropic layers of hexagonal symmetry with horizontal axes of symmetry. Our observations are superimposed, together with their error bars. In this model the anisotropy parameters of the lower layer are fixed (w1=N045uE and dt1=0.5 s), together with the upper layer delay time (dt2=0.8 s);
w1is fixed parallel to the absolute plate motion. The best-fitting w2in the upper layer is oriented close to N–S and could correspond to asthenospheric
flow channelled within the rift and/or to melt pockets aligned parallel to the rift.
340ß 350ß 0ß 10ß 20ß 30ß 40ß 50ß 60ß -40ß -30ß -20ß -10ß 0ß 10ß 20ß 30ß 40ß DBIC MBO TAM BNG ATD KMBO MSEY RER SHEL ASCN TBT NAI LSZ TSUM LBTB SLR BOSA SUR
Figure 7. Mean SKS splitting results (see values in Table 1) observed at the permanent IRIS and Geoscope stations located on the African plate. Together with these new measurements, we present SKS splitting results observed at SUR and SLR in South Africa (Helffrich et al. 1994). The white squares represent the hotspots and the broad white dashed lines represent the hotspot tracks (Duncan & Richards 1991). Thin arrows represent the absolute plate motion vector (Gripp & Gordon 1990).
D I S C U S S I O N
Upper mantle flow beneath the Kenya rift
KMBO is characterized by a large scatter of the results (see Fig. 4), but the mean anisotropy parameters (Table 1) are very similar to the single good measurement made at NAI. Our measurements are consistent with the measurements published by Gao et al. (1997) in the same area and plotted in Fig. 4(b). From a small set of events (one event used at 13 stations, two events at three stations and four events at one station), Gao et al. (1997) found a fast direction of anisotropy trending N–S
to N030uE. Although our mean value of w at KMBO is 20u–40u
away from their observations, some of our individual
measure-ments are, however, oriented between N010uE and N030u and
are therefore consistent with their results. In a first approxi-mation, the average fast split shear waves we observe at KMBO and NAI are polarized in a plane oriented parallel to the rift. Such a parallelism suggests that the anisotropy beneath these stations could be related to deep rift structures and to rifting processes. As suggested by Gao et al. (1997), the parallelism of
wto the trend of the rift can be related to the preferred
align-ment of melt-filled pockets, with a long axis oriented parallel to the maximum compressive direction and a short axis oriented parallel to the minimum compressive (or extension) direction. On the other hand, as evidenced by Nicolas et al. (1994) and more recently by Vauchez et al. (1999), strong olivine lattice preferred orientations can develop under asthenospheric con-ditions (Nicolas & Christensen 1987) and could therefore participate in the total upper mantle anisotropy. Since the East African rift appears to be a relatively narrow structure cutting the African lithosphere (Achauer et al. 1994), a significant source of anisotropy may be induced by a flow of asthenospheric material channelled between the two steeply dipping lithospheric walls, i.e. parallel to the rift. Vauchez et al. (2000) recently showed that both sources of anisotropy (olivine crystals and melt pocket preferred orientations) may be present and that their signals may add together.
At KMBO, our data set shows a large scatter of the results (Fig. 4b) that could be induced by the presence of a structure more complex than a single anisotropic layer beneath this area. Following the approach developed by Silver & Savage (1994), we performed direct modelling of two horizontally layered structures beneath KMBO and compared the predicted back-azimuthal variations of the anisotropy parameters with our observations. This direct modelling approach obviously does not investigate all possible structures, but interestingly shows that our observations can be consistent with more complex models than a single anisotropic layer. In the model presented in Fig. 6, we assumed that anisotropy in the bottom layer was related to the asthenospheric deformation induced by the plate motion and we fixed the fast polarization direction in this layer
(w1) parallel to the absolute plate motion (APM) defined by the
hotspot tracks, i.e. around N045uE (Duncan & Richards 1991).
The dt are fixed a priori in the lower (dt1) and upper layers (dt2),
but several values were tested, generally ranging from 0.5 to 1.0 s. For each model, we calculated the apparent w and dt
variations (wapp and dtapp) as a function of the event
back-azimuth for the whole range of possible lithospheric anisotropy
directions (w2), from N090uW to N090uE. We present in Fig. 6
some models that can explain part of our splitting observations at KMBO. The best fits are found for a lower anisotropic layer
trending N045uE and a rather small dt (about 0.5 s) underlying
an upper anisotropic layer trending from N020uW to N020uE
and with a dt of 0.8 s. These models are obviously not unique but explain the small dt obtained from events arriving with
backazimuths ranging between N020uE and N060uE and
the much larger dt deduced from events arriving with
back-azimuths between N240uE and N280uE. On the other hand,
these models do not explain the scattering of dt observed from the events arriving from the west. This leads us to suggest that the structure beneath KMBO is more complex than a two-layered structure, particularly because 3-D heterogeneities, dipping structures and lithospheric anisotropies could also give some imprint on the anisotropy signature.
Oceanic anisotropy, hotspots and absolute plate motion Despite the high noise level generally observed at oceanic island stations (see e.g. Kuo & Forsyth 1992), we have detected seismic anisotropy beneath most of the stations lying on the oceanic lithosphere of the African plate. MSEY is the best-constrained oceanic station in our data set. SKS splitting measurements at this station display homogeneous results (see Fig. 3) that suggest the presence of a single and rather homogeneous layer of anisotropy. Surprisingly, anisotropy measurements found at MSEY contrast with the anisotropy measurements made at the other Geoscope stations located in the Indian ocean (RER on the African plate, and also CRZF and PAF on the Antarctic plate and AIS on the Australian/Antarctic ridge) that do not show any clear evidence of anisotropy (Barruol & Hoffmann 1999). At stations SHEL and ASCN in the southern Atlantic, no high-quality measurements were made, but a few results of fair quality show strong similarities for splitting parameters at the two sites. At TBT in the Canaries, a single good non-null measurement (see Fig. 2) has been obtained and is fully com-patible with the event’s backazimuths for which no anisotropy was detected (Fig. 3).
The azimuth of the fast split shear wave polarization planes
observed at MSEY in the Indian ocean (N034uE) is very close
to the trend of the tracks of the Comores and La Re´union hotspots (Duncan & Richards 1991; Mu¨ller et al. 1993), which
are oriented roughly N030uE (Fig. 7). At ASCN and SHEL
in the south Atlantic, w (around N050uE) is closer to the trend
of the hotspot-related seamount alignments formed by the Tristan da Cunha and the St Helen hotspots (respectively the Walvis
ridge and the Cameroon line trending roughly N040uE–N050uE)
(Duncan & Richards 1991; Mu¨ller et al. 1993) than to the trend
of the transform faults (oriented N080uE) that froze the relative
Africa–South America plate motion at the South Atlantic ridge. At TBT, w is normal to the azimuth of the transforms. The African plate motion in the hotspot reference frame calcu-lated for the last 69 Myr by Duncan (1984) shows a particularly
good parallelism with the observed w (MSEY: w=N034uE,
APM=N035uE; ASCN: w=N053uE, APM=N062uE; SHEL:
w= N054uE, APM = N058uE; TBT: w = N019uE, APM =
N024uE). Although the database is unfortunately marginal
at the Atlantic stations, this coherence suggests that seismic anisotropy recorded at these oceanic stations could be related to mantle deformation beneath the lithosphere, that is, to the plate drag and to the gradual freezing of asthenospheric flow at the bottom of the lithosphere, as already suggested by other observations in the southwest Pacific (Russo & Okal 1998; Wolfe & Silver 1998) and tested by numerical modelling (Tommasi
et al. 1996; Tommasi 1998). The observed delay times do not show clear correlation to the plate velocity (Duncan 1984) as expected by simple numerical modelling (Tommasi et al. 1996). For instance, at TBT, the plate velocity calculated for the last
69 Myr is expected to be the smallest (15 mm yrx1; Duncan
1984) and we observed (from a single event) a rather high dt of 1.8 s. Alternatively, MSEY should be characterized by the
highest dt since it moved at 45 mm yrx1for the last 69 Myr
(Duncan 1984) but has a dt of 1.1 s, which is not the largest in our data set. The small number of measurements does not allow us to discuss these points further, but this absence of correlation suggests either other sources of anisotropy or that strain may not be homogeneously distributed along a vertical ray beneath a station, depending on the local geotherm and obviously on the local perturbation generated by the hotspot.
Anisotropy in cratonic roots
BOSA and LBTB are located on the Kaapvaal craton. The anisotropies observed at these sites (Table 1) are consistent with observations performed at SLR by Vinnik et al. (1992) and Helffrich et al. (1994) and during temporary experiments deployed in the Kaapvaal craton (Vinnik et al. 1995; Silver et al. 1999, 2001). Our results are plotted with Vinnik’s observations in Fig. 4(c). Interpretation of mantle structures from only these two stations is clearly ambiguous since both the plate motion vector and the crustal structures are rather close to the SW–NE direction. The 1997–1999 deployments of temporary seismic stations on the Kaapvaal craton (Silver et al. 2001) add new data to this discussion. The presence of deep lithospheric roots beneath the craton seen by body wave tomography (James et al. 2001), and the good correlation of w with the crustal structures (deWitt et al. 1992) led Silver et al. (1999, 2001) to propose that a major part of the observed teleseismic shear wave splitting could result from upper mantle structures frozen within the lithospheric root since Archaean times. This interpretation is consistent with petrophysical data that show weak but ubiquitous anisotropy in upper mantle xenoliths brought up to the surface by kimberlite eruptions (Mainprice & Silver 1993; Silver et al. 1999; Long & Christensen 2000; Ben Ismail et al. 2001).
Station DBIC lies on the southern edge of the West African craton. In this area, crustal structures are of early Proterozoic age (Boher et al. 1992; Kouamelan et al. 1997) and trend roughly
N030uE (Milesi 1989). Anisotropy at this site is not strong but
is well defined (Table 1), suggesting a rather simple anisotropic structure in the mantle beneath this area. This anisotropy may, however, be the combination of several tectonic events: astheno-spheric flow (the APM is oriented SW–NE), pervasive structures frozen within the lithospheric mantle and related to the trend
of the 2.0 Gyr old crustal lineaments trending N030uE in this
area, and deformation related to the Atlantic transform faults such as the Romanche transform that locally reworked crustal structures in Cretaceous times.
Anisotropy beneath Pan-African orogenic belts
Station TSUM in Namibia is characterized by well defined anisotropy parameters (Table 1). This anisotropy trends parallel to the Pan-African crustal structures of the Damara belt (Trompette 1994), and also parallel to the absolute motion of
the plate (Fig. 7), inducing ambiguities in the interpretations. The Geoscope station TAM is a good example in our data set for which a large part of seismic anisotropy can be related to Pan-African structure frozen in the lithosphere. The N–S-trending anisotropy observed at TAM by Barruol & Hoffmann (1999) is fully confirmed with three more years of data and consistent with the presence of a large-scale N–S corridor of strike-slip deformation, composed of numerous strike-slip shear zones, several thousands of kilometres long and several hundreds of kilometres wide (Boullier 1986; Black et al. 1994). The aniso-tropy parameters show slight backazimuthal variations of the w direction (Fig. 5). As already shown by Barruol & Hoffmann (1999), these variations are compatible with a two-layered structure, with a lower anisotropic layer trending NE–SW and an upper anisotropic layer trending N–S. Such structure could represent present-day asthenospheric deformation beneath the plate and a N–S-trending lithospheric structure frozen since Pan-African times. This N–S-trending anisotropy that appears to dominate the signal suggests that despite the motion of the plate and the recent asthenospheric upwelling that generated the Hoggar volcanism and uplift, pervasive structures could be preserved from Pan-African times within the lithosphere.
C O N C L U S I O N S
We present in this paper an updated view of the upper mantle anisotropy beneath the African IRIS and Geoscope stations. Seismic anisotropy deduced from SKS splitting has been detected at most stations. The measurements generally suggest that the upper mantle structure beneath the stations may be rather com-plex, implying several layers of anisotropy, dipping anisotropies or lateral heterogeneities.
Although the database is relatively sparse due to the high noise level in the data, our measurements for the oceanic island stations show a parallelism of the azimuths of the anisotropy to the trend of the absolute plate motion, suggesting that the anisotropy could be induced by the asthenospheric plastic deformation beneath the moving plate.
In the Kenya rift, anisotropy is roughly parallel to the rift and could be controlled by the rift structures. Rather strong variations in the anisotropy parameters, however, suggest the presence of several origins of the anisotropy, such as astheno-spheric flow parallel to the rift and/or the presence of partial melt, perhaps underlain by an asthenospheric flow related to the plate motion and the possible influence of lithospheric structures and small-scale heterogeneities. On the South African and West African cratons, our measurements are compatible with astheno-spheric anisotropy beneath the lithosphere if one assumes the lithosphere is isotropic. These measurements can also be inter-preted in terms of lithospheric structures frozen in the upper mantle roots of these cratons. This is consistent with new tomo-graphic images that show cratonic roots down to at least 200 km beneath these areas and with petrophysical data that suggest a weak but ubiquitous anisotropy within the Kaapvaal litho-sphere. Pan-African structures also appear to have pervasively modified the upper mantle structure. Geoscope station TAM in the Hoggar is the best example at which the anisotropy is extremely well constrained and shows a parallelism to the N–S-trending Pan-African transpression zone.
The African IRIS and Geoscope stations give information on a complete set of geodynamic environments. Interestingly,
seismic anisotropy observed at these 15 stations is related to extremely different processes. Very old pervasive structures appear to be frozen at some places in the upper mantle since Archaean or Pan-African times and not reactivated by any sub-sequent event. At other sites, seismic anisotropy seems to be related to present-day mantle flow and present-day tectonic pro-cesses, such as the asthenospheric flow and/or the presence of partial melt in the Kenya rift or the asthenospheric deformation beneath the oceans, related to plate drag.
A C K N O W L E D G M E N T S
Many thanks to both the IRIS and the GEOSCOPE manage-ment groups for the quality and the coherence of the data and for the service offered. We are grateful to P. Silver for allowing us to use his splitting analysis program. The geological inter-pretation has been greatly improved through discussions with Alain Vauchez and Renaud Caby. WBI’s postdoctoral research was supported by La Socie´te´ de Secours des Amis des Sciences. This paper benefited from constructive comments made by M. Savage, J. Plomerova and T. Plenefisch. Maps were made using GMT (Wessel & Smith 1995).
R E F E R E N C E S
Achauer, U. et al., 1994. New ideas on the Kenya rift based on the inversion of the combined dataset of the 1985 and 1989/90 seismic tomography experiment, Tectonophysics, 236, 305–329.
Ayadi, A., Dorbath, C., Lesquer, A. & Bezzeghoud, M., 2000. Crustal and upper mantle velocity structure of the Hoggar swell (Central Sahara, Algeria), Phys. Earth planet. Inter., 118, 111–123. Babuska, V., Plomerova, J. & Sileny, J., 1993. Models of seismic
anisotropy in the deep continental lithosphere, Phys. Earth planet. Inter., 78, 167–191.
Barruol, G. & Hoffmann, R., 1999. Seismic anisotropy beneath the Geoscope stations from SKS splitting, J. geophys. Res., 104, 10 757–10 774.
Barruol, G. & Mainprice, D., 1993. A quantitative evaluation of the contribution of crustal rocks to the shear wave splitting of teleseismic SKS waves, Phys. Earth planet. Inter., 78, 281–300.
Barruol, G., Souriau, A., Vauchez, A., Diaz, J., Gallart, J., Tubia, J. & Cuevas, J., 1998. Lithospheric anisotropy beneath the Pyrenees from shear wave splitting, J. geophys. Res., 103, 30 039–30 054. Ben Ismail, W., Barruol, G. & Mainprice, D., 2001, The Kaapvaal
craton seismic anisotropy, petrophysical analyses of upper mantle kimberlite nodules, Geophys. Res. Lett., in press.
Black, R., Latouche, L., Lie´geois, J.P., Caby, R. & Bertrand, J.M., 1994. Pan-African displaced terranes in the Tuareg shield (Central Sahara), Geology, 22, 641–644.
Boher, M., Abouchami, W., Michard, A., Albarede, F. & Arndt, N.T., 1992. Crustal growth in West Africa at 2.1 Ga, J. geophys. Res., 97, 345–369.
Boullier, A.M., 1986. Sense of shear and displacement estimates in the Abeibara-Rarhous late Pan-African shear zone, Adrar des Iforas, Mali, J. struct. Geol., 8, 47–58.
Chevrot, S., 2000. Multichannel analysis of shear wave splitting, J. geophys. Res., 105, 21 579–21 590.
deWitt, M.J. et al., 1992. Formation of an Archean continent, Nature, 357, 553–562.
Duncan, R.A., 1984. Age progressive volcanism in the New England seamounts and the opening of the central Atlantic Ocean, J. geophys. Res., 89, 9980–9990.
Duncan, R.A. & Richards, M.A., 1991. Hotspots, mantle plumes, flood basalts, and true polar wander, Rev. Geophys., 29, 31–50.
Gao, S. et al., 1997. SKS splitting beneath continental rift zones, J. geophys. Res., 102, 22 781–22 797.
Garnero, E.J. & Lay, T., 1997. Lateral variations in lowermost mantle shear wave anisotropy beneath the north Pacific and Alaska, J. geophys. Res., 102, 8121–8135.
Gripp, A.E. & Gordon, R.G., 1990. Current plate velocities relative to the hotspots incorporating the Nuvel-1 global plate motion model, Geophys. Res. Lett., 17, 1109–1112.
Hadiouche, O., Jobert, N. & Montagner, J.P., 1989. Anisotropy of the African continent inferred from surface waves, Phys. Earth planet. Inter., 58, 61–81.
Helffrich, G., Silver, P.G. & Given, H., 1994. Shear wave splitting variation over short spatial scales on continents, Geophys. J. Int., 119, 561–573.
Herquel, G., Wittlinger, G. & Guilbert, J., 1995. Anisotropy and crustal thickness of northern Tibet: new constraints for tectonic models, Geophys. Res. Lett., 22:, 1925–28.
James, D.E., Fouch, M.J., VanDecar, J.C. & Van der Lee, S., 2001. Seismic tomography of the Kaapvaal craton, Geophys. Res. Lett., in press.
Kendall, J.M. & Silver, P.G., 1998. Investigating causes of Da anisotropy, in The Core–Mantle Boundary Region, pp. 97–118, eds Gurnis, M., Wyssession, M.E., Knittle, E. & Buffet, B.A., AGU, Washington, DC.
Kennett, B.L.N., 1995. Seismic traveltime tables, in Global Earth Physics, A Handbook of Physical Constants, pp. 126–143, ed. Ahrens, T.J., AGU, Washington, DC.
Kouamelan, A.N., Delor, C. & peucat, J.J., 1997. Geochronological evidence for reworking of Archean terrains during the early Proterozoic (2.1 Ga) in the western Cote d’Ivoire (Man Rise— West African Craton), Precamb. Res., 86, 177–199.
Kuo, B.Y. & Forsyth, D.W., 1992. A search for split SKS waveforms in the North Atlantic, Geophys. J. Int., 108, 557–574.
Long, C. & Christensen, N.I., 2000. Seismic anisotropy of the South African upper mantle xenoliths, Earth planet. Sci. Lett., 179, 551–565. Mainprice, D. & Silver, P.G., 1993. Interpretation of SKS-waves using samples from the subcontinental lithosphere, Phys. Earth planet. Inter., 78, 257–280.
Mainprice, D., Barruol, G. & Ben Ismail, W., 2000. The seismic anisotropy of the Earth’s mantle: from single crystal to polycrystal, in Earth’s Deep Interior: Mineral Physics and Tomography from the Atomic to the Global Scale, pp. 237–264, ed. Karato, S.I., AGU, Washington, DC.
Marson-Pidgeon, M. & Savage, M.K., 1997. Frequency-dependent anisotropy in Wellington, New Zealand, Geophys. Res. Lett., 24, 3297–3300.
Milesi, J.P., 1989. Les mine´ralisations aurife`res de l’Afrique de l’Ouest— leurs relations avec l’e´volution lithostructurale au Proterozoic infe´rieur, Chron. Rech. Min., 497, 3–98.
Montagner, J.P., 1998. Where can seismic anisotropy be detected in the Earth’s mantle? In boundary layers . . . , Pure appl. Geophys., 151, 223–256.
Mu¨ller, R.D., Royer, J.Y. & Lawyer, L.A., 1993. Revised plate motions relative to the hotspots from combined Atlantic and Indian hotspot tracks, Geology, 21, 275–278.
Nicolas, A. & Christensen, N.I., 1987. Formation of anisotropy in upper mantle peridotites—a review, in Composition, Structure and Dynamics of the Lithosphere–Asthenosphere System, pp. 111–123, eds Fuchs, K. & Froidevaux, C., AGU, Washington, DC.
Nicolas, A., Achauer, U. & Daignieres, M., 1994. Rift initiation by lithospheric rupture, Earth planet. Sci. Lett., 123, 281–298. Nyblade, A.A., Battenhouse, T., Ritsema, J., Owens, T.J., Gurrola, H.
& Langston, C., 1998. A plume origin for uplift, rifting and volcanism in East Africa: evidence from broadband seismic data, EOS, Trans. Am. geophys. Un., 79, F574.
Plomerova, J., Babuska, V., Dorbath, C., Dorbath, L. & Lillie, R.J., 1993. Deep lithosphere structure across the Central African shear zone in Cameroon, Geophys. J. Int., 115, 381–390.
Ritsema, J. & van Heijst, H., 2000. New seismic model of the upper mantle beneath Africa, Geology, 28, 63–66.
Russo, R. & Okal, E., 1998. Shear wave splitting and upper mantle deformation in French Polynesia: evidence for small-scale heterogeneity related to the Society hotspot, J. geophys. Res., 103, 15 089–15 107.
Savage, M.K., 1999. Seismic anisotropy and mantle deformation: what have we learned from shear wave splitting?, Rev. Geophys., 37, 65–106.
Silver, P.G., 1996. Seismic anisotropy beneath the continents, Probing the depths of geology, Ann. Rev. Earth planet. Sci., 24, 385–432. Silver, P.G. & Chan, W.W., 1988. Implications for continental structure
and evolution from seismic anisotropy, Nature, 335, 34–39. Silver, P.G. & Chan, W.W., 1991. Shear wave splitting and
sub-continental mantle deformation, J. geophys. Res., 96, 16 429–16 454. Silver, P.G. & Savage, M.K., 1994. The interpretation of shear-wave splitting parameters in the presence of two anisotropic layers, Geophys. J. Int., 119, 949–963.
Silver, P.G., Mainprice, D., Ben Ismail, W., Tommasi, A. & Barruol, G., 1999. Mantle structural geology from seismic aniso-tropy, in Mantle Petrology: Field Observations and High Pressure Experimentation: a Tribute to Francis R. (Joe) Boyd, pp, 79–103, eds Fei, Y., Bertka, C. & Mysen, B., the Geochemical Society, Spec. Publ. 6, Stony Brooks, NY.
Silver, P.G. et al., 2001. Mantle deformation beneath southern Africa, Geophys. Res. Lett., in press.
Tommasi, A., 1998. Forward modeling of the development of seismic anisotropy in the upper mantle, Earth planet. Sci. Lett., 160, 1–13.
Tommasi, A., Vauchez, A. & Russo, R., 1996. Seismic anisotropy in oceanic basins: resistive drag of the sublithospheric mantle?, Geophys. Res. Lett., 23, 2991–2994.
Trompette, R., 1994. Geology of Western Gondwana (2000–500 Ma), Balkema, Rotterdam.
Vauchez, A., Barruol, G. & Nicolas, A., 1999. Comment on ‘SKS splitting beneath rift zones’, J. geophys. Res., 104, 10 787–10 789. Vauchez, A., Tommasi, A., Barruol, G. & Maumus, J., 2000. Upper
mantle deformation and seismic anisotropy in continental rifts, Phys. Chem. Earth, 25, 111–117.
Vinnik, L., Chevrot, S. & Montagner, J.P., 1998. Seismic evidence of flow at the base of the upper mantle, Geophys. Res. Lett., 25, 1995–1998. Vinnik, L.P., Makeyeva, L.I., Milev, A. & Usenko, A.Y., 1992. Global patterns of azimuthal anisotropy and deformations in the continental mantle, Geophys. J. Int., 111, 433–437.
Vinnik, L.P., Green, R.W.E. & Nicolaysen, L.O., 1995. Recent deformation of the deep continental root beneath southern Africa, Nature, 375, 50–52.
Wessel, P. & Smith, H.F., 1995. New version of the Generic Mapping Tools released, EOS, Trans. Am. geophys. Un., 76, 329.
Wolfe, C. & Silver, P.G., 1998. Seismic anisotropy of oceanic upper mantle: shear wave splitting methodologies and observations, J. geophys. Res., 103, 749–771.