DEVELOPMENT OF NAVAL DIESEL ENGINE DUTY CYCLES FOR AIR EXHAUST EMISSION ENVIRONMENTAL IMPACT ANALYSIS
by
Stephen Paul Markle
B.S., Environmental and Resource Engineering State University of New York College of Environmental
Science and Forestry (1983)
Submitted to the Department of Ocean Engineering and Department of Mechanical Engineering in Partial Fulfillment of the Requirements for the Degrees of
NAVAL ENGINEER and
MASTER OF SCIENCE IN MECHANICAL ENGINEERING
at the
Massachusetts Institute of Technology May 1994
© 1994 Stephen Paul Markle. All rights reserved.
The author hereby grants to MIT, the United States Government and its agencies permission to reproduce and to distribute public paper and electronic copies of this thesis document in whole or in part.
// /
//
/
/
Signature of Author Certified by Certified by Accepted by Accepted byf
._ /i•Department of Ocean Engineering
29 April 1994
Professor Alan J. Brown
Thesis Advisor
Victor W. Wong, Ph.D.
Thesis Advisor ' A
7 Professor A. Douglas Carmichael
-"w""-" hairman, Graduate Commitee in Engineering r Ain A. Sonin ate Commitee II Engineering Eng. AU
- 0
21994
Development of Naval Diesel Engine Duty Cycles for Air Exhaust Emission Environmental Impact Analysis
by
Stephen Paul Markle
Submitted to the Department of Ocean Engineering
in Partial Fulfillment of the Requirements for the Degrees of Naval Engineer and Master of Science in Mechanical Engineering
ABSTRACT
A strategy for testing naval diesel engines for exhaust emissions was developed. A survey of existing international and national standard diesel engine duty cycles was conducted. All were found to be inadequate for testing and certification of engine exhaust emissions from naval diesel powered ships. Naval ship data covering 11,500 hours of engine operation of four U.S. Navy LSD 41 Class amphibious ships was analyzed to develop a 27 point class operating profile. A procedure combining ship hull form characteristics, ship propulsion plant parameters, and ship operating profile was detailed to derive an
11-Mode duty cycle representative for testing LSD 41 Class propulsion diesel
engines. A similar procedure was followed for ship service diesel engines. Comparisons with industry accepted duty cycles were conducted using exhaust emission contour plots for the Colt-Pielstick PC-4B diesel engines. Results showed the 11-Mode LSD 41 Class Duty Cycle best predicted ship propulsion engine emissions compared to the 27 point operating profile propeller curve. The procedure was applied to T-AO 187 Class with similar results. The
application of civilian industry standards to measure naval diesel ship propulsion engine exhaust emissions was found to be inadequate. Engine exhaust flow chemistry post turbocharger was investigated using the SANDIA Lab computer tool CHEMKIN. Results showed oxidation and reduction reactions within
exhaust gases are quenched in the exhaust stack. Since the exhaust stream in the stack is unreactive, emission sampling may be performed where most
convenient. A proposed emission measurement scheme for LSD 41 Class ships was presented.
Thesis Supervisor: Dr. Alan J. Brown Title:
ACKNOWLEDGEMENTS
My sincere appreciation to Patricia S.M. Markle, my best friend, editor, sounding board and person most responsible for helping me to keep this project in the proper perspective.
The guidance and direction of Professor Alan J. Brown and Dr. Victor W. Wong throughout this past year were critical in determining both topic and
content for this thesis. I genuinely appreciate their support in encouraging me to develop this thesis as a tool for use by ship and engine designers and builders.
My gratitude also to Mr. Gurpreet Singh and Mr. Pete Grotsky of NAVSEA for their comment and critique of various elements of the duty cycle
development. Thanks to Raida Abachi of the California Air Resources Board for her assistance in sorting through the cumbersome legislative and regulatory regimes naval ships may be subject to in future years.
Acknowledgements also go to Mr. Dan Fauvell and Mr. Richard Moore from Puget Sound Naval Shipyard Detachment Boston, and Ms. Sara Fidd of
NAVSEA, for background information on the LSD 41 Class. Thanks to Ms. Gail Monahan of Coltech Industries for her help in providing specifications on Colt-Pielstick diesel engines.
My special thanks to the commanding officers ships who graciously provided access to their logs, and welcomed me into their wardrooms on my visits to compile the class operating profile: Commander C.F. Webber (USS
FORT McHENRY (LSD 43)), Commander J.R. Poplar III (USS RUSHMORE (LSD 47)), Commander M.P. Nowakowski (USS GUNSTON HALL (LSD44)), and
Commander S. Gilmore (USS TORTUGA (LSD 46)).
Finally, thanks to the United States Navy for its' generosity and foresight in enabling me to attend Massachusetts Institute of Technology. The knowledge
I have acquired and the experience I have gained is immeasurable. It is my ambition to utilize this expertise to benefit the United States Navy throughout my career. I would also like to recognize my fellow 13A student officers from the U.S. Navy, U.S. Coast Guard, Canadian Navy and Hellenic Navy whose friendship, camaraderie and advise enhanced my three years at MIT.
TABLE OF CONTENTS
Title Page Abstract
Acknowledgements Table of Contents List of Figures & Tables Chapter 1: Introduction
1.1 Naval Diesel Engine Background 1.2 LSD 41 Class
1.3 Pollutants of Interest
1.4 Legislative Initiatives
1.5 Regulatory Strategy
1.6 Diesel Engine Duty Cycles
1.6.1 DEMA Duty Cycle
1.6.2 ICOMIA Standard No. 36-88
1.6.3 EPA 13-Mode Duty Cycle
1.6.4 Japanese Heavy-Duty Diesel Duty Cycle
1.6.5 U.S. Navy Endurance Test
1.6.6 ISO 8178-4 Duty Cycles
1.6.7 CARB 8-Mode Duty Cycle
1.7 Thesis Methodology and Scope
Chapter 2: LSD 41 Class Operating Profile Development
2.1 LSD 41 Class Naval Architecture
2.1.1 Hull Naval Architecture Description
2.1.2 Propulsion Plant Description
2.1.3 Ship Service Diesel Generator Description 2.2 Ship Powering
2.3 Characteristics of Ship Operation 2.3.1 Ship Logs
2.3.2 Operator Preference 2.3.3 Underway Ship Operations
2.4 LSD 41 Class MPE and SSDG Operating Profile 2.5 Operating Profile Coastal Variation
Naval Diesel Engine Duty Cycle Development
9 9 12 12 19 27 30 33 34 35 36 37 38 40 42 43 43 43 45 47 49 55 55 58 59 64 72
Chapter 4: 4.1 4.2 4.3 4.4 4.5 Chapter 5: 5.1 5.2 5.3
Duty Cycle Comparison Comparison Methodology
LSD 41 Class MPE Duty Cycle Emission Prediction MPE Duty Cycle Comparison
SSDG Duty Cycle Comparison
Duty Cycle Conclusions and Applications Stack Emission Measurement
LSD 41 Class Stack Description Exhaust Gas Constituent Analysis Ship Emission Measurement
Chapter 6: Conclusions and Recommendations References
Appendices
A: Sample Ship Log Sheets B: Ship Visit Summaries
B.1 USS FORT McHENRY (LSD 43) B.2 USS GUNSTON HALL (LSD 44) B.3 USS TORTUGA (LSD 46)
B.4 USS RUSHMORE (LSD 47)
B.5 Ship Visit Summary
B.5.1 East vs. West Coast
B.5.2 Composite Ship Operations C: MPE Emission Prediction Data
C.1 Colt-Pielstick PC4-2B Emission Data C.2 Emission Calculation Spreadsheet C.3 Duty Cycle Emission Plots
D: Exhaust Stack Emission CHEMKIN Data
87 87 90 96 101 104 108 108 111 117 119 122 127 130 132 135 138 141 144 144 148 151 152 155 159 169
LIST OF FIGURES & TABLES
Figure 1 Particulate - NOx Trade Off 17
Figure 2 California Coastal Water Air Basins 23
Figure 3 Japanese NOx 25
Figure 4 NOx and PM Heavy Duty Engine Standards 28
Figure 5 USS WHIDBEY ISLAND (LSD 41) 43
Figure 6 LSD 41 Class Body Plan 44
Figure 7 Ship Speed Ahead vs. RPM 52
Figure 8 Ship Speed Astern vs. RPM 52
Figure 9 LSD 41 Class Speed Power Curve 54
Figure 10 Southern California (SOCAL) Operating Area 62
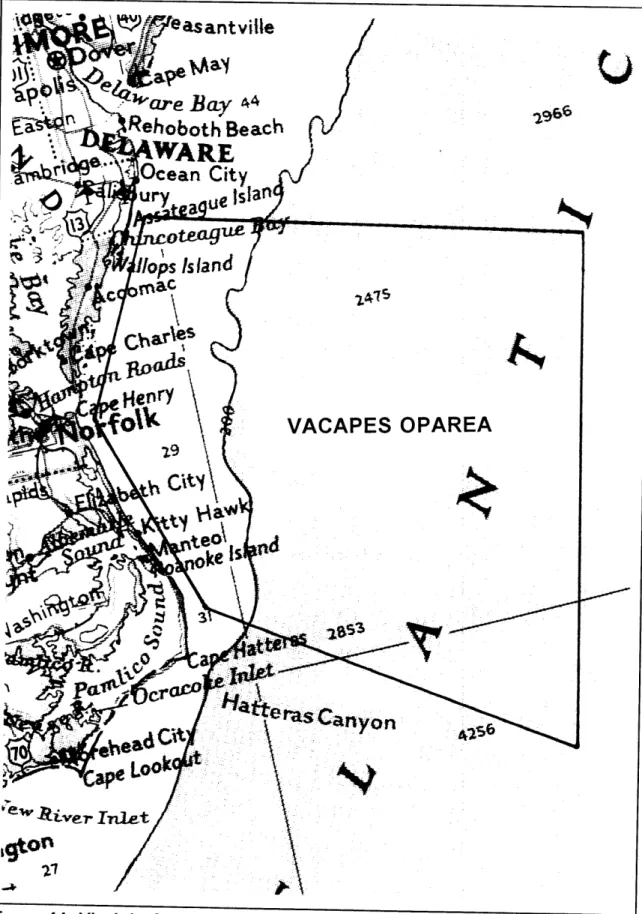
Figure 11 Virginia Capes (VACAPES) Operating Area 63
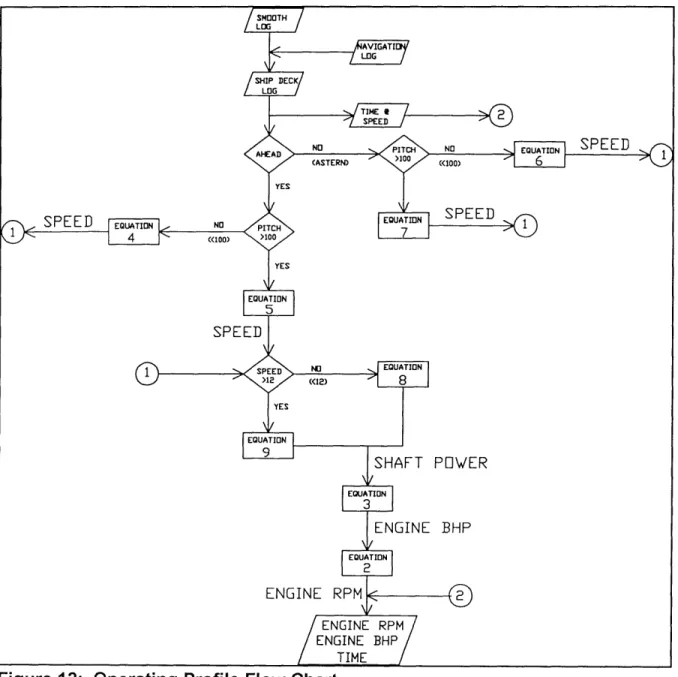
Figure 12 Operating Profile Flow Chart 66
Figure 13 LSD 41 Class Composite Speed Operating Profile 68
Figure 14 LSD 41 Class Composite SSDG Operating Profile 72
Figure 15 Ship Operating Profile Cumulative Time Factor Comparison 73
Figure 16 Operating Profile Time Factor Comparison by Coast 74
Figure 17 Power Normalized to Weight versus Weight 78
Figure 18 Naval Ship Duty Cycle Determination 81
Figure 19 NOx Emission Contour Map (g/bhp-hr) 88
Figure 20 CO Emission Contour Map (g/bhp-hr) 88
Figure 21 HC Emission Contour Map (g/bhp-hr) 89
Figure 22 CO2 Emission Contour Map (g/bhp-hr) 89
Figure 23 LSD 41 MPE NOx Emission Contour Map (g/bhp-hr) 91
Figure 24 LSD 41 MPE CO Emission Contour Map (g/bhp-hr) 91
Figure 25 LSD 41 MPE HC Emission Contour Map (g/bhp-hr) 92
Figure 26 LSD 41 MPE CO2 Emission Contour Map (g/bhp-hr) 92
Figure 27 LSD 41 Class Speed vs. NOx Emissions 93
Figure 28 LSD 41 Class Speed vs. CO Emissions 93
Figure 29 LSD 41 Class Speed vs. HC Emissions 94
Figure 30 LSD 41 Class Speed vs. CO2 Emissions 94
Figure 31 Duty Cycle Speed/Power Points 96
Figure 32 MPE NOx Prediction Comparison (g/bhp-hr) 98
Figure 33 MPE Japanese NOx Prediction Comparison (g/bhp-hr) 98
Figure 34 MPE CO Prediction Comparison (g/bhp-hr) 99
Figure 35 MPE HC Prediction Comparison (g/bhp-hr) 99
Figure 36 MPE CO2 Prediction Comparison (g/bhp-hr) 100
Figure 42 LSD 41 Class Starboard MPE Exhaust Stack - Plan View 109
Figure 43 LSD 41 Class Starboard MPE Exhaust Stack - Profile View 110
Figure 44 CHEMKIN Exhaust Stack Model 117
Figure A-1 Ships Deck Log Sheet 127
Figure A-2 Engineering Smooth Log Sheet 128
Figure A-3 Engine Operating Log Data Sheet 129
Figure B-1 LSD 43 Individual MPE Operating Profiles 133
Figure B-2 LSD 43 Composite Operating Profile 134
Figure B-3 LSD 44 Individual MPE Operating Profiles 136
Figure B-4 LSD 44 Composite Operating Profile 137
Figure B-5 LSD 46 Individual MPE Operating Profiles 139
Figure B-6 LSD 46 Composite Operating Profile 140
Figure B-7 LSD 47 Individual MPE Operating Profiles 142
Figure B-8 LSD 47 Composite Operating Profile 143
Figure B-9 East Coast Ship MPE Operating Profiles 145
Figure B-10 West Coast Ship MPE Operating Profiles 146
Figure B-11 East versus West Coast MPE Ship Operating Profiles 147
Figure B-12 Individual Ship MPE Operating Profile 149
Figure B-13 LSD 41 Class Composite Ship Operating Profile 150
Figure C-1 LSD 41 Class 11-Mode Duty Cycle Emission Contour Plots 159
Figure C-2 ISO 8178-4 E3 Emission Contour Plots 160
Figure C-3 ISO 8178-4 El Emission Contour Plots 161
Figure C-4 U.S.N. Endurance Test Emission Contour Plots 162
Figure C-5 ICOMIA 36-88 Emission Contour Plots 163
Figure C-6 Japanese Heavy-Duty Diesel Emission Contour Plots 164
Figure C-7 U.S. EPA 13-Mode Duty Cycle Emission Contour Plots 165
Figure C-8 CARB 8-Mode Duty Cycle Emission Contour Plots 166
Figure C-9 T-AO 187 Class 6-Mode Duty Cycle Emission Contour Plots 167
Figure C-10 T-AO 187 Class Propeller Curve Emission Contour Plots 168
Table 1-1 Marine Vessels Versus Other Sources (tons/day) 15
Table 1-2 Marine Vessel Emissions by Vessel Type (% Contribution) 16
Table 1-3 Marine Vessel Emissions by Vessel Location (tons/day) 16
Table 1-4 National Ambient Air Quality Standards 21
Table 1-5 EPA Heavy-Duty Diesel Emission Standards (g/bhp-hr) 28
Table 1-6 CARB 1995 Marine Vessel Proposed NOx Standards 30
Table 1-7 DEMA Duty Cycle 34
Table 1-8 ICOMIA Marine Engine Duty Cycle (Standard No. 36-88) 34
Table 1-9 EPA 13-Mode Duty Cycle 35
Table 1-10 Nonroad Weighing Factors v. EPA 13-Mode Duty Cycle 36
Table 1-11 Japanese Heavy-Duty Diesel Cycle 37
Table 1-12 U.S. Navy Medium Speed Diesel Engine Endurance Test 38
Table 1-14 ISO 8178 Duty Cycle Definitions 40
Table 1-15 CARB 8-Mode Duty Cycle 41
Table 2-1 LSD 41 Class Principle Hull Dimensions 45
Table 2-2 Main Propulsion Diesel Engine Parameters 47
Table 2-3 Ship Service Diesel Engine Parameters 48
Table 2-4 Standardization Trial Results 51
Table 2-5 Ahead Bells 56
Table 2-6 Backing Bells 57
Table 2-7 LSD 41 Class Ship Data Summary 65
Table 2-8 LSD 41 Class Composite Operating Profile Time Factors 67
Table 2-9 Composite MPE Operation Points (0-9 knots) 69
Table 2-10 Composite MPE Operation Points (10-24 knots) 70
Table 2-11 Composite SSDG Engine Operating Profile Time Factors 71
Table 3-1 Horsepower to Displacement Coefficients 79
Table 3-2 Consolidated Naval Ship Operating Profile 82
Table 3-3 LSD 41 Class MPE Duty Cycle 83
Table 3-4 T-AO 187 Class Propulsion Plant Data 84
Table 3-5 T-AO 187 Class MPE Duty Cycle 85
Table 3-6 LSD 41 Class Ship Service Diesel Engine Duty Cycle 85
Table 4-1 LSD 41 Class MPE Emission Predictions (g/bhp-hr) 95
Table 4-2 MPE Duty Cycle Emission Prediction Summary (g/bhp-hr) 97
Table 4-3 T-AO 187 Class MPE Emission Predictions (g/bhp-hr) 101
Table 4-4 SSDG Duty Cycle Emission Prediction Summary (g/bhp-hr) 102
Table 5-1 Exhaust Stack Flow Parameters 111
Table 5-2 Colt-Pielstick 16 PC-2.5 Emissions at Rated Conditions 111
Table 5-3 Exhaust Gaseous Hydrocarbon Constituents 112
Table B-1 LSD 41 Class Ship Data Summary 130
Table B-2 USS FORT McHENRY (LSD 43) MPE Data Summary 132
Table B-3 USS GUNSTON HALL (LSD 44) MPE Data Summary 135
Table B-4 USS TORTUGA (LSD 46) MPE Data Summary 138
Table B-5 USS RUSHMORE (LSD 47) MPE Data Summary 141
Table B-6 MPE Data Time Factor Summary by Coast 144
CHAPTER 1: INTRODUCTION
1.1 Naval Diesel Engine Background
Heat engines have been in practical use as prime movers for ship propulsion for the last 210 years. During the late eighteenth century the first steam powered ships were built. Although several operative steam powered ships were built during that time period, the PYROSCAPHE, built by Claude de Jouffroy d'Abbans in 1783 at Lyons, France, is generally accepted as the first successful application of steam-powered propulsion to ships.' These early steam plants burned a coal-gas air mixture at atmospheric pressure. Over the next 100 years the efficiency of the steam engine increased; gradually steam replaced wind power for ship propulsion.
By the late 1800's liquid fuels had gained in popularity. The efficiency of existing heat engine designs which used liquid fuels was limited. Spark ignition gasoline fueled engines were the predominate internal combustion engine in use up to this time. Auto-ignition combustion (knock) of the fuel limited the
compression ratios of these engines and, therefore, their efficiency. In these engines, fuel was mixed with the intake air before entry into the engine cylinder. As the mixture was compressed in the cylinder auto-ignition of the fuel, prior to spark discharge, occurred in engines with higher compression ratios.
In 1892 Rudolf Diesel, a German engineer, patented a new type of high pressure reciprocating heat engine. In 1905 J.R. Buchi, a Swiss engineer, laid 'Thomas C. Gillmer, Modern Ship Design, p. 115.
the foundation for modern exhaust gas turbocharging. In 1910 James
McKechnie, an English engineer, obtained a British patent for high pressure fuel injection. These three technologies combined to make the diesel engine of today. In this engine auto-ignition became a benefit. Fuel was introduced after the in-cylinder compression of the air charge. The heat generated by the gas compression initiated combustion after fuel injection. With this engine design, higher compression ratios were possible. The amount of work available per unit of fuel burned increased, raising efficiency. The diesel engine designs of today retain efficiency advantages over both spark ignition and gas turbine internal combustion engines.
In the summer of 1913 two civilians from the New York Navy Yard, Albert Kloppenberg, a draftsman, and Ernest Delbose, an engineer, together with a US Naval Officer, Lieutenant Chester W. Nimitz, were sent to Germany. They went to observe German large diesel design, construction and ship installation techniques. Prior to this time, the U.S. Navy had only limited experience with small diesel engines used in submarines. As a result of their study, the first U.S. Navy surface ship to be powered by diesel engines, the USS MAUMEE, was commissioned on October 23, 1916. The hull of the ship, a new 14,500 ton oiler, had been built on the west coast of the United States and towed to the New York Navy Yard in Brooklyn, New York. There, twin 2,600-horsepower diesel engines
design of MAUMEE borrowed heavily from German technology.2
In the past thirty years diesel engines have replaced steam plants as the propulsion plant of choice for many commercial ships. Most U.S. Navy ships are equipped with diesel generators for emergency electrical power. Some use diesel generators for ships service electric load; a smaller number (69) have diesel main propulsion.3
Diesel engines procured for the navy must successfully pass the 1,000 hour durability test outlined in Military Specification MIL-E-21260D Engines,
Diesel Marine, Propulsion and Auxiliary, Medium Speed, of March 1976. No
procedure is currently specified by the Navy to test diesel engines for exhaust emissions during the procurement process, or when operational with the fleet. The goal of this thesis is to develop naval diesel engine exhaust air emission test procedures.
The cargo variant of the LSD 41 Class of ships is still under construction for the U.S. Navy. This ship class is the most modern diesel ship in the U.S.
Navy fleet. It features an automated engine bell recording system, automated diesel trend analysis collection, and has achieved a very high engine reliability rating. For these reasons it was selected for study in this thesis.
2E.B.
Potter, NIMITZ, p. 125.
3Naval Sea Systems Command, "Internal Combustion Engine Exhaust Emission Study," 1991, p. 7-18.
1.2 LSD 41 Class
The twelve ships of the LSD 41, WHIDBEY ISLAND, Class have four medium speed Colt SEMT-Pielstick 16 PC2.5 V400 diesels, each rated at 8,500 brake horsepower for main propulsion. Two diesels are connected by clutch to a mechanical reduction gear which drives the 13.5 foot diameter controllable
reversible pitch propellers through a propulsion shaft. The combined 34,000 brake horsepower (33,000 shaft horsepower) propels the two shafts and powers the 15,745 ton ship to a maximum speed of approximately 22 knots. Ships service electrical power is provided by four Fairbanks Morse 38ND8-1/8 opposed piston diesel engine driven 1300 kW electrical generators.
The LSD 41 Class is comprised of eight ships of landing-ship-dock configuration and four cargo carrying variants. The mission of this ship class is to provide amphibious assault capability to 450 troops and four air cushion landing craft. This ship is designed and built to operate within visual range of shore and has been recently deployed in support of United Nations initiatives in Iraq, Somalia, and Haiti.
1.3 Pollutants of Interest
Since the beginning of human of civilization the benifit of increased industrialization has brought with it the price of pollution. In our modern world
from wind powered sailing ships, and horse drawn vehicles has come an increase in anthropogenic atmospheric chemicals. These pollutants have degraded the quality of life of our civilization by endangering public health, degrading the public welfare in decreased visibility and by damaging our
buildings and natural world.
Like all internal combustion engines, diesel engines intake fresh air, burn a fuel/air mixture, produce work and exhaust gases. Currently, the diesel cycle
is the most efficient of the heat engine cycles widely used. However, processes such as incomplete fuel combustion, engine friction, and heat loses all reduce efficiency. The complete stoichiometric combustion of diesel fuel is given by
equation (1):
C,1 H7+14. 25 (C +3 .771 ) =10Cq +8. 5-20+15.76N (1)
Complete stoichiometric combustion is rarely achieved because of nonuniform mixing of air and fuel. Diesel engines are operated with excess air (lean) to enhance the combustion process. Within the cylinder of a typical diesel engine, combustion takes place under different regimes. In those areas where
stoichiometric conditions exist, complete combustion occurs. These areas are typified by high temperature leading to oxidation of atmospheric nitrogen and production of nitric oxide (NO) and nitrogen dioxide (NO2). Oxides of nitrogen (NOx) are comprised of NO (80-90%) and NO2 (10-20%).
The fuel lean regions are typified by lower temperatures and complete fuel combustion due to an excess of oxygen and the dilutive effect of excess air. The fuel rich regions have incomplete combustion due to a shortage of oxygen. In these areas carbon monoxide (CO) and pyrolized and unpyrolized fuel
hydrocarbons (HC) are produced. Since diesel engines are normally operated fuel lean CO and HC products are not a substantial problem. Carbon dioxide
(CO2) and water (H20) are the ultimate products of complete fossil fuel
combustion. The rate of CO2 production increases with combustion efficiency.
Optimization of the combustion process leads to an increase in CO2 production, a gas generally accepted as contributing to global warming by the green house effect.
Normal engine operation encompasses both steady state and transient conditions. Transient conditions occur during acceleration and deceleration between steady state conditions. During transients the fuel-to-air ratio changes, engine responsiveness is limited by the air intake system. The result is fuel rich combustion. Transient conditions are characterized by decreased NOx and
increased CO, HC and PM levels in the exhaust.
Diesel fuel contains a small (1-5%) amount of sulfur which combines with oxygen in the combustion chamber to form sulfur oxides (SOx). Sulfur oxides have been shown to contribute to acid rain, degrade visibility and increase
The State of California has completed several air quality studies. These indicate marine vessels substantially contribute to pollutants in the ambient air inventory. Table 1-1 provides a comparison of marine vessel emissions versus other sources for the state of California in 1987. Contained in the study are emissions from all vessels, including diesel, gas turbine, and steam powered vessels. The vast majority of the approximately 22,500 vessels which operated in California waters during 1987 were diesel powered. Economic pressures forced the conversion of most steam and gas turbine commercial ships to more
efficient diesel power during the 1970's and 80's. However, this trend has had a negative impact on ambient air quality as diesel engines produce about 10 times
more NOx than steam boilers.4 The percent contribution of NOx and SOx by
marine vessels is primarily due to lack of emission regulation compared to other
Table 1-1: Marine Vessels Versus Other Sources (tons/day)5
Source
HC
CO
NO
SO
PM
Stationary 5,300 6,000 970 210 11,000 On-Road 1,600 11,000 1,900 130 270 Off-Road 341 4,005 789 50 58 Marine Vessels 29 57 412 226 28 Total 7,270 21,062 4,071 616 11,356 % Marine 0.40 0.27 10.1 36.7 0.25 4State of California Air Resources Board, "Public Meeting to Consider a Plan for the Control of Emissions from Marine Vessels," p. 2, 1991.
more numerous sources, and the high sulfur content of fuels used for
commercial diesel powered ships. Marine vessel emissions are further broken down by vessel type (Table 1-2) and location (Table 1-3).
Table 1-2: Marine Vessel Emissions by Vessel Type (% Contribution)6
Vessel
Type
Number
NO,
SOx
Ocean-Going 15,491 74 % 69 %
Harbor 268 2% 15%
Commercial Fishing 6,807 24 % 16 %
Table 1-3: Marine Vessel Emissions by Vessel Location (tons I/day)7
Vessel Location NOS SO=
In-port 74 (18%) 34 (15%)
At-sea 238 (58%) 155 (69%)
Commercial Fishing 100 (24%) 37 (16%)
Total 412 (100%) 226 (100%)
Marine diesel pollutants of prime importance for future regulation are NOx and particulate soot (PM) which is comprised of carbon and imbedded
hydrocarbons. A relationship has been determined to exist between NOx and PM. Engine in cylinder design changes to reduce NOx generally correspond to an increase in PM production. Therefore, diesel engine designers trade off fuel efficiency and reduced NOx against increased PM. Figure 1 demonstrates that
the rate of PM emissions trade-off tends to increase exponentially as the NOx
emission level gets lower.8 The curve of Figure 1 represents the technology
average for on-highway heavy-duty engines produced between 1988 and 1990.
Figure 1: Particulate - NOx Trade Off
Engine exhaust emissions from ships present a more complex analytic problem than non marine sources. Unlike trucks and locomotives, marine diesel engines are connected to a long exhaust pipe (uptake). The LSD 41 Class has two exhaust stacks, each of which contain the uptakes of two main propulsion
8"Control of Air Pollution: Emissions of Oxides of Nitrogen and Smoke From New
Nonroad Compression-Ignition Engines at Above 50 Horsepower," Federal Register, Volume 58, No. 93, 17 May 1993, p. 28836.
and two ship service diesel engines. Within the uptake, gases may continue to react with each other and ambient air, oxidation and reduction processes
continue driven by temperature. Therefore, emissions from the engine exhaust valve may be different than what ultimately exits the stack. After treatment schemes such as selective catalytic reduction (SCR) take advantage of exhaust gas stream chemistry to reduce NOx levels. Since ambient air quality is directly affected by stack emissions, regulatory action should be stack (or uptake) based rather than engine based. However, the diversity of diesel engines and uptake designs would complicate traditional command and control regulation if applied to ships. For this reason, the chemical processes occurring within the uptake must be well understood to equate engine to stack (or uptake) emissions over the spectrum of engine speed and power combinations. Complicating the stack (or uptake) gas measurement scheme is the distribution of exhaust gases across the uptake diameter. The turbulent nature of the gas stream makes prediction of gas levels at distinct locations very difficult due to associated velocity, pressure, and temperature gradients. Continued degradation of urban ambient air quality has resulted in increasingly tougher legislative and regulative initiatives to reduce the emission of diesel generated NOx, CO, SOx and PM. Current understanding of uptake gas chemistry does not allow accurate emission prediction at the stack exit. As regulations drive emissions downward, reliance
exit monitoring for certification and compliance will give the U.S. Navy the best means for conforming to emission standards.
1.4 Legislative Initiatives
The International Maritime Organization (IMO) has acknowledged that national and regional legislation to limit engine exhaust emissions from ships is inevitable. In response, the IMO's Marine Environmental Protection Committee (MEPC) is currently working on standards for the prevention of air pollutants from ships. Specifically targeted is the reduction of NOx and SOx without an increase in other air pollutants. IMO has agreed to formulate a new annex to the International Convention for the Prevention of Pollution from Ships (MARPOL) 73/78. The new annex, Annex 6, will apply to new diesel engines over 100 kilowatts, and to non-public vessels over 500 gross tons. Proposed SOx
reduction of 50 percent of 1992 levels by 2000 is to be accomplished by a global cap of 3-4 percent fuel sulfur content and a limit of fuel sulfur of 1.5 percent on a regional basis in special areas. For new engines, 70 percent reduction of 1992 levels by 2000 for NOx have been proposed. IMO anticipates completing work on Annex 6 by the end of 1994. Although the U.S. Coast Guard has participated in the development of Annex 6 as the official representative of the U.S.
government, ratification by the U.S. Congress would be required to make Annex
6 law. Even though Annex 6 will likely exempt public vessels, it is probable that
the U.S. Congress will mandate public vessel compliance upon ratification. Congress did just that when it ratified Annex 5 to MARPOL 73/78 in 1987
requiring public vessels to comply with the commercial standards. Regardless of what occurs in the international arena, control of emissions has been a priority of all levels of government within the United States.
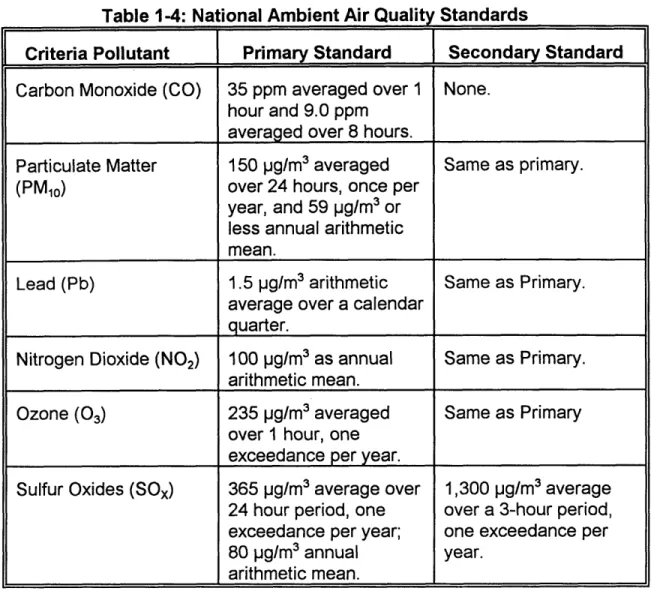
The U.S. Congress enacted the Clean Air Act (CAA) in 1970. The central theme of the CAA is a cooperative federal-state scheme to achieve nationwide acceptable air quality. Section 108 and 109 of CAA require the Administrator of the Environmental Protection Agency (EPA) to establish national ambient air quality standards (NAAQS) for criteria pollutants. The six primary and
secondary NAAQS that have been designated by the Administrator appear in Table 1-4. Primary standards are set to protect the public health with an adequate margin of safety. Secondary standards have been established to protect the public welfare from any known or anticipated adverse effect associated with the presence of such air pollutant in the ambient air.
Section 110 of CAA requires each state to develop State Implementation
Plans (SIP's) to achieve the federally mandated primary and secondary NAAQS. In SIP development a state must include enforceable emission limitations and other control measures. The amendments of 1990 added the requirement for states with areas not in attainment to establish vehicle monitoring programs to
ensure continued compliance with tailpipe standards.
Table 1-4: National Ambient Air Quality Standards
Criteria Pollutant Primary Standard Secondary Standard
Carbon Monoxide (CO) 35 ppm averaged over 1 None. hour and 9.0 ppm
averaged over 8 hours.
Particulate Matter 150 pg/m3 averaged Same as primary.
(PM10) over 24 hours, once per
year, and 59 pg/m3 or
less annual arithmetic mean.
Lead (Pb) 1.5 pg/m3 arithmetic Same as Primary.
average over a calendar
quarter.
Nitrogen Dioxide (NO2) 100 pg/m3 as annual Same as Primary.
arithmetic mean.
Ozone (03) 235 pg/m3 averaged Same as Primary over 1 hour, one
exceedance per year.
Sulfur Oxides (SOx) 365 pg/m3 average over 1,300 pg/m3 average 24 hour period, one over a 3-hour period,
exceedance per year; one exceedance per 80 pg/m3 annual year.
arithmetic mean.
Section 213 of the act tasked the administrator to conduct a study of emissions from nonroad engines and nonroad vehicles to determine if such emissions cause, or significantly contribute to, air pollution which may
reasonably be anticipated to endanger public health or welfare. Further, this section required the administrator to issue emission standards for the nonroad source if it is found to endanger public health or welfare. Section 209(e)(2)(A) authorizes the state of California to adopt and enforce standards and other requirements relating to the control of emissions from nonroad engines or
vehicles not covered elsewhere in the act. Marine vessels and engines are subject to regulation under this section.
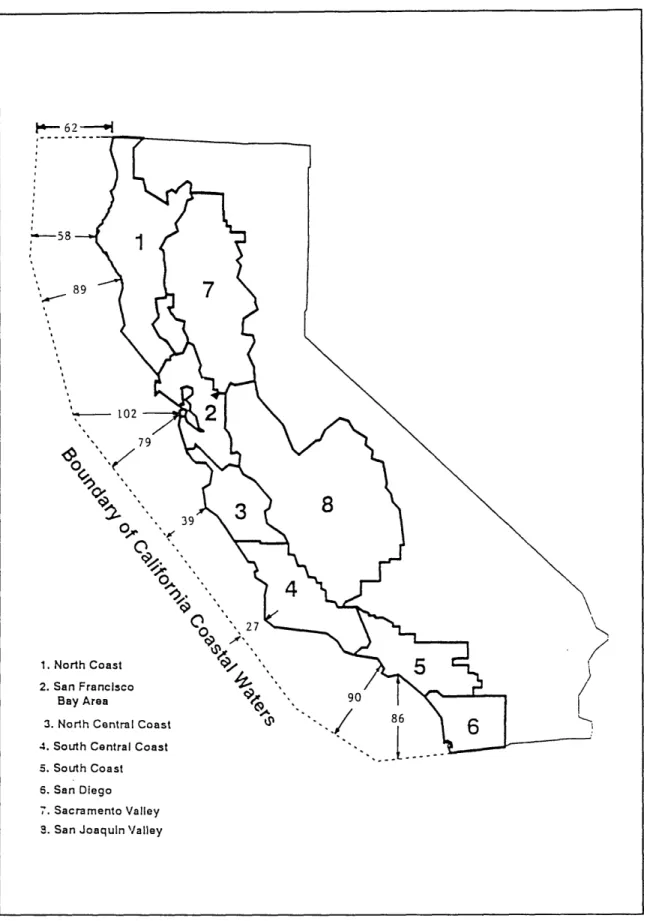
The State of California Legislature enacted the California Clean Air Act (CCAA) in 1988 to fulfill its unique status under the federal CAA to pioneer air quality improvement initiatives. Under this act, the California Air Resources Board (CARB) was required to consider controlling emissions from several previously unregulated nonroad mobile sources. Marine vessels and engines were included in the act for CARB regulation. CARB has proposed regulation of vessels operating within a zone defined as "California Coastal Waters". This area parallels the California coast and is within 27 miles off Point Conception, and as far as 100 miles off the San Francisco Bay Area. The distances were developed based on meteorological and modeling data showing emissions off the coast affect coastal land areas. Information supplied to CARB by the U.S. Coast Guard indicates all commercial shipping calling at California Ports transits within 20 miles of shore. The U.S. Navy conducts extensive amphibious assault training exercises off the coast of the Camp Pendelton Marine Base in San
Diego County, an area within the coastal waters zone. Figure 1 gives a chart of the designated California Coastal Waters. Figure 1 was taken from page 12 of the report commissioned by CARB entitled "Regulatory Strategies for Reducing Emissions from Marine Vessels in California Waters," which was prepared by
t- 62-0 1. Sh 2. S 3. 1 4. S 5. South Coast 6. San Diego 7. Sacramento Valley
S. San Joaquin Valley
Figure 2: California Coastal Water Air Basins - Distances in Miles
23 I"' I I I I r I
On 24 February 1994, the Administrator of the EPA signed the California Federal Implementation Plan (CFIP). The CFIP was developed by EPA since California had not developed SIP's for each of their AQMD's as it was required to do under CAA. The CFIP maintains the basic elements of the CARB
proposed plan and adds an emission fee system.
The fee system proposed in the CFIP significantly impacts frequent users of California ports and high emitters. The basic fee of $10,000 per U.S. ton NOx emitted will apply to commercial shipping. Table 1-1 indicates that commercial ships operating in the California Coastal Waters zone emit 412 tons/day NOx. At this emission rate, $4,120,000 in fees would be collected daily. Incentives within the fee collection system reward reductions in NOx. These incentives are as follows:
- 90 percent fee reduction for 80 percent NOx reduction. Possible methods for accomplishment are through use of selective catalytic reduction (SCR) or shift to gas turbine or diesel propulsion plants.
- 50 percent fee reduction for 30 to 80 percent NOx reduction. Suggested alternatives for acomplishement are: injection timing retard, engine fine tuning, exhaust gas recirculation (EGR), water emulsification, selective non-catalytic reduction, and reduced ship speed.
The fee system is expected to encourage the development of shipboard emission control systems and provide incentives for more efficient operation and use of shore power inport (cold-ironing). Each commercial vessel operating in California coastal waters must report hours of operation and rated power for each engine on board.
Four basic assumptions have been made in developing the fee model:
1. Cruising: 3 - 100 miles from port. Assume 80 percent of rated engine output
2. Maneuvering/Hotelling: <3 miles from port. Assume 25 percent rated output.
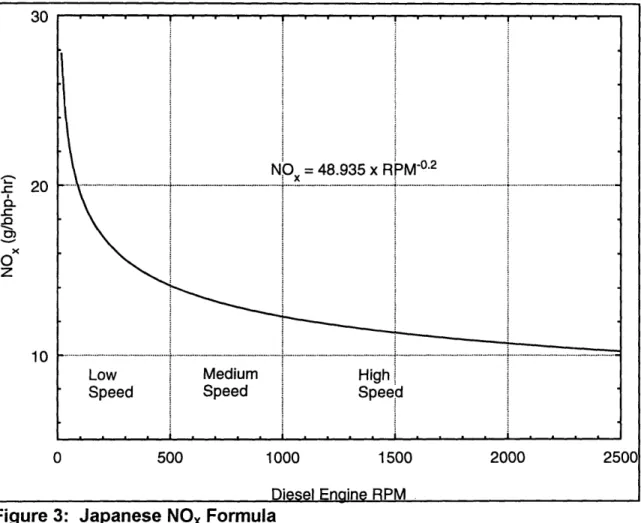
3. Auxiliary Engines: Assume 50 percent rated engine output. 4. Baseline emissions from main engines determined from modified engine speed emission model from Japan. This model equates NOx to RPM and is based upon engine research conducted in Scandinavia and Japan. Figure 3 illustrates this relation.9
9Larry N. Hottenstein, "International Impact of California's Engine Emissions
Regulations," presentation to ASNE Maritime Environmental Symposium '94, 23 February 1994.
30 NO = 48.935 x RPM-0 .2 x
. 20
.
.
z 10 .Low Medium High
Speed Speed Speed
0 500 1000 1500 2000 2500
Diesel Enaine RPM
Figure 3: Japanese NOx Formula
The CFIP presents a clear shift in regulatory strategy. The impact of its
full implementation on the work of the IMO and international trade has not been fully assessed. The reliance upon a model equating NOx to RPM without regard for engine torque or cylinder pressures indicates that the regulatory environment is shifting from analysis to action, but not necessarily the prudent action.
1.5 Regulatory Strategy
The U.S. Congress and EPA have adopted a pareto regulation strategy. To date standards have been established for stationary sources, and light-duty vehicles (automobiles and light-duty trucks). This practice regulates those air pollution sources where the greatest cost/benefit ratio can be had. The
emphasis for new regulation in the 1990's will be for the more numerous smaller stationary and mobile sources.
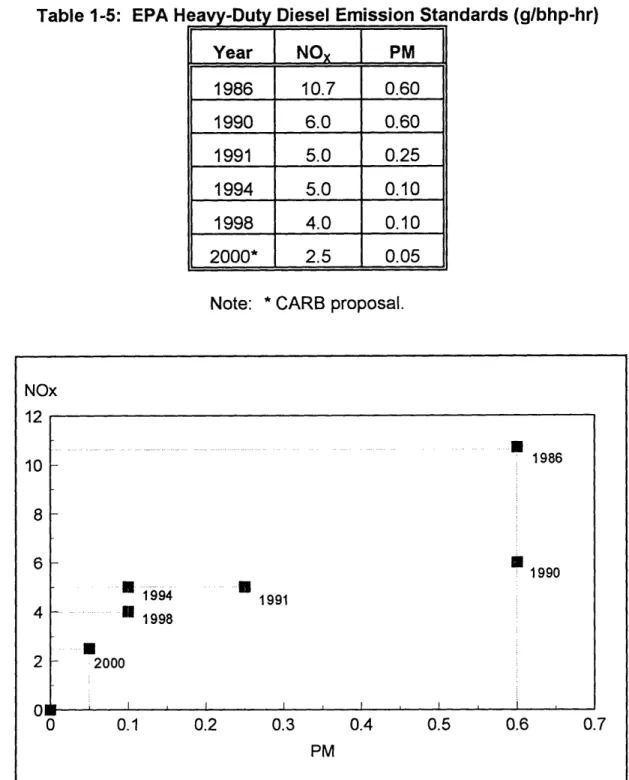
The EPA has broad authority to study, propose, enact, and enforce regulations of mobile nonroad emission sources. The Administrator has periodically published emission controls for heavy duty diesel engines under transient conditions, Table 1-5. Although not binding on marine vessels, these
standards offer a preview of probable future marine diesel standards. The trend seen in Figure 4 illustrates the gradual decrease in allowable emissions. EPA has universally defined heavy-duty diesel engines as those installed in a vehicle/vessel of over 33,000 pounds gross vehicle weight.10 This definition applies to the propulsion and auxiliary engines of large trucks, earth moving equipment, locomotives, and marine vessels. Interestingly, the EPA has adopted a vehicle derived engine classification, instead of one based on horsepower, useful life, etc...
10PHONECON with Mr. John Roach, EPA Air Quality Division, Boston, MA, of 17
November 1993.
Table 1-5: EPA Heavy-Duty Diesel Emission Standards (g/bhp-hr) Year NOx PM 1986 10.7 0.60 1990 6.0 0.60 1991 5.0 0.25 1994 5.0 0.10 1998 4.0 0.10 2000* 2.5 0.05
Note: * CARB proposal.
Figure 4: NOx and PM Heavy Duty Engine Standards NOx -1/ 10 8 6 4 2
01
0 0.1 0.2 0.3 0.4 0.5 0.6 0.7 PM 1986 -m 1990 1994 1991 I- 1998 .2000 i I I I Iheavy duty diesel emission standards of 6.9 g/bhp-hr NOx and proposed smoke opacity standard of 20% during acceleration, 15% on lug mode, and 50% peak opacity on either the acceleration or lug mode. EPA did not issue proposed emission standards for HC, CO and PM. Available test procedures had not been demonstrated capable of predicting these pollutant emissions from nonroad sources. Specifically excluded from these proposed regulations are engines used for main propulsion and auxiliary power in marine vessels. Marine vessel engines were not included for two reasons. First, marine engines are currently subject to safety regulations by the U.S. Coast Guard. EPA must first analyze these current Coast Guard safety requirements, then determine the best method for regulating emissions, consistent with Coast Guard regulations. Second, information was unavailable verifying existing test procedures as applicable to marine engines. EPA must determine a suitable test procedure for marine
vessels. Although U.S. Navy vessels are not subject to U.S. Coast Guard safety regulations, the EPA has recognized that existing test procedures may not be adequate for predicting marine diesel engine emissions."
Regardless of EPA action, CARB has proposed new marine vessel engine emission standards, in-use marine vessel engine emission standards, new and existing source permit requirements, and a broad market based
strategy aimed at reducing vessel exhaust emissions effective in 1995. Table 1-6 provides these new proposed NOx standards applicable to marine diesel
"Federal Register, Vol. 58, No. 93, p. 28816.
engines.
Effective 01 October 1993 highway diesel fuel must comply with a maximum sulfur content standard of 0.05 percent by weight. California has extended the EPA low sulfur requirement to include fuel sold for marine applications. The sulfur problem should be substantially resolved by specification for low sulfur fuel.
Table 1-6: CARB 1995 Marine Vessel Proposed Diesel NO, Emission Standards (ppm)12
Application Load Baseline Proposed % Reduction
New Engines Main Propulsion > 25% 650-1,200 130 78-89 Main Propulsion < 25% * 450 * Auxiliaries * 600-1,200 600 0-50 Existing Engines Main Propulsion * 600-1,680 600 0-64 Auxiliaries * 650-1,200 750 0-38
The development of a marine test procedure is vital for providing repeatable emission data. Several duty cycles have been proposed to
accomplish this. However, the unique operation of U.S. Naval ships has not yet been properly modeled.
governments, the relationship between the operation of marine vessels and ambient air quality must be understood. Section 206 of the CAA requires the administrator of the EPA to test new engines for compliance with existing emission standards. Although marine engines are not currently regulated by EPA, duty cycles have been developed for marine vessels and are being evaluated for EPA certification.
Certified duty cycles have been developed for both highway and nonroad applications. These tests provide repeatability, wide applicability, and simplicity in modeling engine operating profiles. There are two distinct types of duty cycles; constant volume sampling (CVS) used for transient testing, and mode testing used for steady state. The CVS test uses a bag collection device. Mode testing relies upon raw gas stream measurement.
The contribution of transient operation to total emission levels is currently being investigated. Information to date suggests that transients may not be critical in most emission measurement schemes. EPA analysis of their own and industry test data during normal engine operation has shown that NOx emission levels remain relatively consistent over a range of steady state to transient operation.13 In developing a duty cycle for recreational marine engines, the
International Council of Marine Industry Associations (ICOMIA) provided
evidence that transient operation encompasses only a small fraction (1-2%) of total operating time. This was interpreted as a result of a small number of
13Federal Register, Volume 58, No. 93, p. 28820.
throttle changes.14 The data analyzed for this thesis agrees with the ICOMIA
data. One is led to the conclusion that understanding steady-state conditions is far more important than transient conditions in duty cycle development and testing.
Acceleration transient testing conducted on the U.S. Coast Guard Cutter
POINT TURNER in the fall of 1993, indicated that maximum NOx and CO levels
are not that much different than the steady state condition at the higher power level. In this testing the engines were accelerated from the clutched mode (180 shaft rpm, 5 horsepower), to 650 shaft rpm and roughly 580 horsepower. During the transient, NOx, as measured in pprnv at 1 second intervals with a ENERAC model 2000E Portable Emissions Analyzer, was found to first decrease
substantially before building up to the steady state value. CO was found to first increase at a fast rate, then gradually to attain the steady state value. The results observed are consistent with transition from steady state while clutched, to fuel rich during the first part of acceleration, and restoration of the steady state fuel/air ratio at the end of the transient event.
The results of emission testing may be reported either as a maximum single-point or as a weighted average over an operating profile. Maximum single-point measurements indicate worse case operation. This point may be measured outside of the normal operating range of the engine tested. The
proposed marine emission levels described in Table 1-6 are of the maximum single-point type. These levels are reported based on volumetric flow rate (ppmv), maximum brake specific mass level, or as the emission index given in grams per kilogram of fuel. The weighted average method tests the engine over a profile of varying loads and speeds. This method obtains a more accurate estimation of engine emissions as a function of power produced (g/bhp-hr). An accurate engine operating profile is required for the weighted average method. The weighted average method is preferred since it provides an indication of
emissions over the actual operating range of the engine.
Several duty cycles have been proposed for marine vessels. Each duty cycle specifies speed/power combinations with factors indicating time
percentage at that combination. Duty cycles are classified as T'-Mode; T'
indicates the number of combinations tested. Duty cycles with a greater number of combinations (') provide greater emission/efficiency detail. However, the selection of speed/power and time in mode must be done carefully so as to accurately reflect actual operation. If poorly performed, data will not be representative of actual operating conditions.
1.6.1 DEMA Duty Cycle
The predecessor of the Engine Manufactures Association (EMA), the Diesel Engine Manufactures Association (DEMA), published a 3 mode duty cycle in 1974. Although no longer supported by EMA, the duty cycle provided an early attempt to model a generator engine operating profile. This duty cycle assumes
constant speed operation and is provided in Table 1-7.
Table 1-7: DEMA Duty Cycle's
Cycle Point Specified Load, % Time Factor
1 50 0.2
2 75 0.4
3 100 0.4
1.6.2 ICOMIA Standard No. 36-88
ICOMIA Standard Number 36-88, Marine Engine Duty Cycle, provides a 5-mode duty cycle for recreational and commercial marine engines. Table 1-8 gives this duty cycle. This cycle emphasizes low speed/torque operation which may be applicable to U.S. Navy ships maneuvering in a harbor or when
conducting on-station duties just over the horizon from shore.
Table 1-8: ICOMIA Marine Engine Duty Cycle (Standard No. 36-88 16
Mode Engine Speed* Engine Torque* Time Factor
1 Idle 0 0.40
2 0.4 0.253 0.25
3 0.6 0.465 0.15
4 0.8 0.716 0.14
5 1.00 1.000 0.06
1.6.3 EPA 13-Mode Duty Cycle
The 13-Mode EPA Duty Cycle has been used for several years for
standardized steady state heavy-duty diesel engine emission testing. Table 1-9
gives the EPA 13-Mode Duty Cycle.
Table 1-9: EPA 13-Mode Duty Cycle'7
Mode
Engine Speed
Engine
Time
in Mode
Time
Torque* Min. Max. Factor
1 Idle 0 4.5 6 0.067 2 Intermediate 2 4.5 6 0.08 3 Intermediate 25 4.5 6 0.08 4 Intermediate 50 4.5 6 0.08 5 Intermediate 75 4.5 6 0.08 6 Intermediate 100 4.5 6 0.08 7 Idle 0 4.5 6 0.067 8 Rated 100 4.5 6 0.08 9 Rated 75 4.5 6 0.08 10 Rated 50 4.5 6 0.08 11 Rated 25 4.5 6 0.08 12 Rated 2 4.5 6 0.08 13 Idle 0 4.5 6 0.067
Note: *Percent of Maximum Observed
The EMA and Economic Commission for Europe (ECE) have proposed alternatives to the weighting (time) factors for the standard U.S. EPA 13-Mode
Duty Cycle for nonroad applications. Table 1-10 provides this comparison.
Table 1-10: Nonroad Weighting Factors v. EPA 13-Mode Duty Cycle'8
Mode
Time Factors
(%)
U.S. EPA
ECE 49
EMA
1 20/3 25/3 15 2 8 8 (10% Load) 0 3 8 8 0 4 8 8 10 5 8 8 10 6 8 0 10 7 20/3 25/2 0 8 8 8 15 9 8 8 15 10 8 8 15 11 8 8 0 12 8 8 (10% Load) 10 (10% Load) 13 20/3 25/3 0 1.6.4 Japanese Heavy-Duty [
Japan has established itself a
engine research and development. for engine testing, Table 1-11. This and heavier loading conditions than
)iesel Duty Cycle
3s a major contributor in heavy-duty diesel They have developed a six mode duty cycle duty cycle emphasizes higher engine speed the standard EPA 13-Mode. It does not test
Table 1-11: Japanese Heavy-Duty Diesel Duty Cycle19
Mode Engine Speed Engine Load Time Factor (%)
(% of Rated) (% of Rated) 1 Idle 0 3.5 2 40 or 1000 rpm 100 7.1 3 40 or 1000 rpm 25 5.9 4 60 100 10.7 5 60 25 12.2 6 80 75 28.6
1.6.5 U.S. Navy Endurance Test
The U.S. Navy procures medium speed heavy-duty diesels subsequent to successful completion of the 1,000 hour endurance test, comprised of 125 eight hour cycles. Although emission measurements are not taken concurrent with this test, steady state readings could be made. The data would not reflect inservice emission levels unless the durability test were modified to conform to the individual ship application operating profile. Table 1-12 gives the U.S. Navy durability test cycle (8 hour).
. Navy S.U Medium Speed D i20
Note: *For main propulsion engines, for constant speed engines (SSDG)
50% load at rated speed in the forward direction.
1.6.6 ISO 8178-4 Duty Cycles
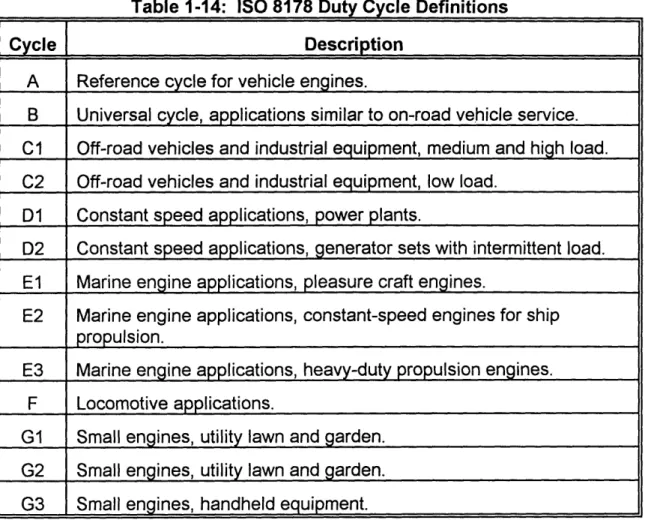
The International Organization for Standardization (ISO) published its draft proposal "Reciprocating Internal Combustion (RIC) Engines - Exhaust Emission Measurement", ISO 8178, in May of 1992. ISO 8178 is a five part procedure designed to standardize engine exhaust measurement. Part four provides 13 duty cycles for different engine applications. The EPA is currently evaluating ISO 8178 for use in the United States. Table 1-13 gives the 13 duty
Table
1-12:
- `--- ,- - `-, . . . # .. -- . ~ . I~ . . .- -. . . -. . '• ... . . .. . . . . .. . . . .
Mode Time Time Engine Load Engine Speed
(minutes) Factor (% of Rated) (% of Rated)
1 120 0.250 100 100 2 60 0.125 85 100 3 10 0.021 0 Idle 4 110 0.229 100 100 5 10 0.021 0 Idle 6* 30 0.063 50 75 (Reverse) 7 10 0.021 0 Idle 8 10 0.021 85 100 9 110 0.229 110 100 10 10 0.021 0 Shutdown
Table 13: ISO 8178-4 RIC Duty Cycles2 1
T Idle 60 Percent of Rated Speed Rated Speed
E
1S
Percent Load TF0
10 25 50 75 100 10 25 50 75 100 A 0.25 0.08 0.08 0.08 0.08 0.25 0.02 0.02 0.02 0.02 0.10 B 0.25 0.08 0.08 0.08 0.08 0.25 0.02 0.02 0.02 0.02 0.10 C1 0.15 * * 0.10 0.10 0.10 0.10 * 0.15 0.15 0.15 C2 0.25 * 0.38 * * 0.07 0.23 * * * 0.07 D1 * * * * * * * * 0.20 0.50 0.30 D2 * * * * * * 0.10 0.30 0.30 0.25 0.05 F 0.60 * * 0.15 * * * * * * 0.25 G1 0.05 0.07 0.30 0.29 0.20 0.09 * * * * * G2 * * * * * * 0.07 0.30 0.29 0.20 0.09 G3 0.10 * * * * * * * * * 0.90 El 0.40 * 0.25 0.15 0.14 * * * * * 0.06 E2 * * * * * * * 0.15 0.15 0.5 0.2 E3 % Speed/ 63/25/0.15 80/50/0.15 91/75/0.50 100/100/ % Load/ Weight 0.20The series E duty cycles have been proposed for marine application. Cycles E2 and E3 are applicable to U.S. Navy ships with diesel main propulsion engines. Both are four mode tests that do not adequately cover the light loading condition common to near land operation. Cycle D1, a three mode duty cycle, applicable to power generation plants, does not cover the low load ranges that
211SO
8178-4, and Naval Sea Systems Command, p. 6-15. 39
Table 1-14: ISO 8178 Duty Cycle Definitions
Cycle Description
A Reference cycle for vehicle engines.
B Universal cycle, applications similar to on-road vehicle service.
C1 Off-road vehicles and industrial equipment, medium and high load. C2 Off-road vehicles and industrial equipment, low load.
D1 Constant speed applications, power plants.
D2 Constant speed applications, generator sets with intermittent load. El Marine engine applications, pleasure craft engines.
E2 Marine engine applications, constant-speed engines for ship
propulsion.
E3 Marine engine applications, heavy-duty propulsion engines. F Locomotive applications.
G1 Small engines, utility lawn and garden.
G2 Small engines, utility lawn and garden.
G3 Small engines, handheld equipment.
typify shipboard SSDG lineups for maximum redundancy/reliability. ISO 8178 has attempted to cover the entire spectrum of RIC engines in use throughout the world. However, what may be applicable for commercial shipping is not valid for military vessels. Therefore, a need exists for additional duty cycles that provide a reliable naval warship operating profile.
1.6.7 CARB 8-Mode Duty Cycle
between points to stabilize the next condition. This duty cycle provided a good indication of engine emissions under steady state and high load conditions.
Table 1-15 gives the CARB duty cycle.
Table 1-15: CARB 8-Mode Duty Cycle22
Mode Engine Speed Engine Load Time Factor
(% of Rated) 1 Idle 0.00 0.05 2 Rated 0.75 0.15 3 Rated 0.50 0.15 4 Idle 0.00 0.05 5 Max. Torque 1.00 0.15 6 Max. Torque 0.75 0.15 7 Max. Torque 0.50 0.15 8 Max. Torque 0.30 0.15
The time factors listed in Table 1-15 are esitmates based upon the ISO
8178-4 C1 Duty Cycle which superceded the CARB 8-Mode Duty Cycle. The
CARB time factors were not available for inclusion in this thesis. CARB is in the
process of evaluating the ISO 8178-4 Duty Cycles for adoption into the CARB
program. Evaluation is expected to be completed in 1995 with rule making expected shortly thereafter.
22Paul Stiglic, et. al., "Emission Testing of Two Heavy Duty Diesel Engines
Equipped with Exhaust Aftertreatment," SAE Paper 900919, 1990, p. 5. 41
1.7 Thesis Methodology and Scope
This thesis developed alternative diesel engine duty cycles for naval ships based upon the LSD 41 Class. Duty cycles were devised for both main propulsion engines and ship service diesel generator engines. Of the eight landing-ship-dock variant ships of the LSD 41 Class currently in commission, four were visited for the purpose of log review. Appendix B gives the details of the ship visits conducted for data collection.
Each ship maintains Deck Logs (general ship operation), Engineering Smooth Logs (engineering plant general operation), Engineering Bell Logs (speed change), and Diesel Engine Operating Logs for up to three years. From the information contained in these logs, a ship operating profile was developed. Together with the operating profile, additional information in the form of
meteorological, tidal, hull powering requirements, operator preference, scheduled maintenance, inspection reports, and ship specifications was
synthesized to generate the two naval diesel duty cycles. Once the duty cycles were written, comparisons were made using data available in the literature describing diesel engine exhaust emissions as a function of speed and power.
After completing the duty cycle portion of this thesis, a study was
performed resulting in a recommended stack emission testing methodology. In this work, the ambiguities resulting from turbulent gas flow were accounted for
CHAPTER 2: LSD 41 CLASS OPERATING PROFILE DEVELOPMENT
2.1 LSD 41 Class Description
2.1.1 Hull Naval Architecture Description
The LSD 41 Class design is based on the earlier ANCHORAGE Class
(LSD 36) of ships. Figure 5 is a port bow view of the USS WHIDBEY ISLAND
(LSD 41) at sea. Figure 6 provides the LSD 41 Class body plan, which consists
of two half transverse elevations or end views of the ship; both have a common
Figure 5: USS WHIDBEY ISLAND (LSD 41)
vertical centerline. The right-hand side of Figure 6 represents the ship as seen
from ahead, the left-hand side as seen from the stern. The body plan indicates the cross sectional shape of the ship. This shape directly impacts wetted
surface area and, therefore, ship powering requirements. Principle dimensions of the LSD 41 Class are provided in Table 2-1.
Table 2-1: LSD 41 Class Principle Hull Dimensions
Design Displacement 15,745 Itons
Length Overall 609.58 ft
Length Between Perpendiculars 580 ft
Extreme Beam 84 ft
Design Draft 19 ft
Prismatic Coefficient (Cp) 0.612
Maximum Midship Section Coefficient (Cx) 0.945
Block Coefficient (CB) 0.578
Waterplane Area Coefficient (Cw) 0.779
Wetted Surface Area 50,100 ft2
2.1.2 Propulsion Plant Description
The LSD Class has two shafts. Each shaft is powered by two Colt-Pielstick 16PC2.5V four stroke, turbocharged, intercooled, non-reversing diesel engines. Each diesel must be connected to the Philadelphia Gear reduction gear via pneumatic clutch in order to transmit power. The reduction gear is a locked train single reduction gear with two drive pinions, each clutched to a main propulsion diesel engine. The reduction gear reduction ratio (A) is given by equation (2). Power is transmitted into the water via twin 5-bladed, 13.5 foot diameter Bird-Johnson controllable-reversible pitch propellers.
RPM,
A= M 3.1515 (2)
RPMShaft
The Colt Pielstick 16PC2.5V design output is 10,400 brake horsepower (bhp) at air inlet temperature of 510 Celsius. As part of the naval qualification
process diesel engines must produce rated power over a wide temperature range. U.S. Navy specifications call for an operating temperature range of -840
to 600 Celsius. Qualification for U.S. Navy shipboard application required derating the engine by 18% to 8,500 bhp at 520 revolutions per minute (RPM). The shaft torque limits of 262,000 ft-lbs for single engine, and 525,000 ft-lbs for dual engine operation are not exceeded at rated engine operation. The ship is torque limited since at rated RPM rated power is not achieved. To achieve rated power, propeller pitch is adjusted to approximately 70 percent pitch. Basic engine parameters are given in Table 2-2.
Power is lost due to component friction where power is transmitted from the prime mover to the propeller. Mechanical efficiency (i MECH) iS the relation between shaft horsepower (shp) measured at the propeller and brake
horsepower measured at the prime mover output shaft. Equation (3) provides this relation for the LSD 41 Class.
SHP 33,000
11 MECH- -= =0.971 (3)
Table 2-2: Main Propulsion Diesel Engine Parameters
Model Colt-Pielstick, PC V
Type Non-Reversing
Cycle Four Cycle, Turbocharged
Rated Load 8,500 BHP
Rated RPM 520
Minimum Engine Idle 200 RPM
Bore and Stroke - mm 400 x 460
Number of Cylinders 16
Piston Displacement 57.8 Liters Combustion Chamber Volume 5.51 Liters
Compression Ratio 11.5:1
Equivalence Ratio @ Rated 0.38
bmep @ Rated Conditions 1,934.7 kPa
Piston Speed @ Rated RPM 7.98 m/sec
2.1.3 Ship Service Diesel Generator Description
Ship service electrical power is provided by four 1,300 kW generators, each driven by a Fairbanks Morse 38ND8-1/8 opposed piston diesel engine. These engines are constant speed of 720 RPM. Basic ship service diesel engine parameters are given in Table 2-3.
When underway the ship electric plant is in a parallel configuration, normally with two diesel generators running. Nominal underway ships electric load is approximately 1,300 kW at 1,500 amps. The average load on each machine, with two engines running, gives a load of about 50 percent of rated capacity. Operation of cranes, anchor windlass, and ballast compressor motors
often requires starting an additional diesel generator to provide starting surge capacity. Starting surges are significant, the highest surges are those of the ballast air compressors at 400 amps. Low loading causes glazing of the cylinder liners and build up of carbon deposits. As a result, the diesel prime movers are maintenance intensive.
Table 2-3: Ship Service Diesel Engine Parameters
Model Fairbanks Morse 38ND8-1/8
Type Opposed Piston
Cycle Two Cycle, Turbocharged
Engine Rated Load 1,837 BHP (@ 0.8 p.f.)
Rated Generator Capacity 1,300 kW
Rated RPM 720
Minimum Engine Idle 525 RPM
Bore and Stroke - mm 206.4 x 254
Number of Cylinders 12
Piston Displacement 17.0 Liters Compression Ratio 16.1:1
Equivalence Ratio @ Rated 0.35 bmep @ Rated Conditions 559.9 kPa Piston Speed @ Rated RPM 6.10 m/sec
2.2 Ship Powering
The ship propulsion plant must provide sufficient power to overcome the resistance to forward motion. This resistance, or drag, is composed of two primary flow mechanisms; frictional resistance and residuary resistance. Frictional resistance is the largest single contributor to total ship resistance. Experiments have shown it accounts for 80 to 85 percent of total resistance in slow-speed ships and 50 percent in high-speed ships.23 Air resistance created by the above water portion of the ship also creates drag. Environmental effects in the form of wind, waves, currents, biologic fouling of the hull, and corrosion of the hull magnify the effect of frictional resistance, increasing the power required for a given speed.
Residuary resistance is made up of wave making resistance and eddy resistance. As a ship moves through the water a surface wave system is created. The energy expended by the ship in producing this wave system is called wave making resistance. Eddy resistance refers to the energy that is lost as vortices are produced and shed from appendages such as: propeller shafts, shaft struts, rudders, and ship stern.
At slow ship speeds frictional resistance predominates. At higher speeds the effect of residuary resistance becomes most important. Frictional resistance and residuary resistance are additive. For speed-to-length ratios of less than
23Principles of Naval Architecture Volume II
- Resistance, Propulsion and
Vibration, SNAME 1988, p. 7.
about 0.6, frictional resistance is dominant; above 0.6, wave making becomes dominant. For the LSD 41 Class this corresponds to a ship speed of about
12-14 knots. In the frictional regime, viscous forces dominate and resistance is proportional to velocity squared. In the residuary regime, inertial forces dominate and resistance is proportional to velocity cubed.
Ship powering requirements are determined by scale model tests and through analytic procedures. Scale model tests are conducted in both still water, and rough water to simulate heavy seas. In calculating the required installed power, predictions are made for the effect of sea state, wind, currents and other
environmental effects. Once the ship has been built, it is taken to sea for a
series of trials to test the performance of each installed system under actual operating conditions. One trial tests the performance of the propulsion plant. Propulsion plant Standardization Trials of USS WHIDBEY ISLAND (LSD 41)
were conducted from 28 March to 1 April 1985 off the coast of La Jolla,
California. Standardization Trials establish the relation between ship speed and propulsion plant parameters. Table 2-4 gives a summary of the important
Standardization Trial parameters averaged over three runs at each speed. Frictional resistance is related to the amount of wetted surface area of the hull. Ships are operated at various conditions of loading which effect the
Table 2-4: Standardization Trial Results24
Speed Shaft RPM Torque Power
(knots) (Ibf-ft) (hp) 11.4 81.6 232,900 3,620 14.0 100.8 332,200 6,380 16.6 121.1 477,000 11,000 19.2 140.7 638,200 17,100 19.6 142.1 673,200 19,590 20.1 150.0 721,300 20,600 21.2 159.4 811,500 24,630 21.8 165.8 885,900 27,960
The LSD 41 Class operates over two distinct speed ranges. At speeds below 10 knots the ship speed is controlled by propeller pitch. At
speeds above 10 knots ship speed is controlled by shaft RPM. In the pitch
controlled regime the shaft is operated at a constant 64 RPM and speed is varied by changing the pitch of the propeller. Above 10 knots propeller pitch is set at 100 percent and speed is varied by shaft RPM. The data points presented in Table 2-4 are at 100 percent propeller pitch. Within the two regimes a mostly linear relation between pitch/rpm and speed exists. Figure 7 gives the relation in the ahead direction, and Figure 8 in the astern direction.
24Everett I. Woo and Michael L. Klitsch, "USS
WHIDBEY ISLAND (LSD 41)
Standardization, Trailed and Locked Shaft Trials," David W. Taylor Naval Ship Research and Development Center, December 1985, p. 26.