DETERMINATION OF NAVAL MEDIUM SPEED DIESEL ENGINE AIR EXHAUST EMISSIONS AMD VALIDATION OF A PROPOSED ESTIMATION MODEL
by
Agnes M. Mayeaux
B.S. Ocean Engineering, United States Naval Academy (1986)
Submitted to the Department of Ocean Engineering and Department of Mechanical Engineering in Partial Fulfillment of the Requirements for the Degrees of
NAVAL ENGINEER and
MASTER OF SCIENCE IN MECHANICAL ENGINEERING at the
Massachusetts Institute of Technology May 1995
0 1995 Aggie Mayeaux. All rights reserved.
The author hereby grants to MIT, the United States Government and its agencies permission to
reproduce and to distribute publicaly paper and electronic copies of this thesis document in whole or in part.
Signature of Author.
" --Department of Ocean Engineering
Certified by
Professor Alan J. Brown Thesis Advisor Certified by
SVictor
W. Wong, Ph.D.Thesis Advisor Accepted by
•-Profesr- A. Douglas Carmichael Chairman, Graduate Commitee Department of Ocean Engineering Accepted by
MASSACHUSETTS INS'LfU'TE
OF TECHNOLOGY
Professor Ain A. Sonin Chairman, Graduate Commitee Department of Mechanical Engineering
JUL
2
81995
LIBRARIES
Barker iEo -4
Determination of Naval Medium Speed Diesel Engine Air Exhaust Emissions and Validation of a Proposed Estimation Model
by
Agnes Mae Mayeaux
Submitted to the Department of Ocean Engineering
in Partial Fulfillment of the Requirements for the Degrees of Naval Engineer and Masters of Science in Mechanical Engineering
ABSTRACT
Steady state marine diesel engine exhaust emissions are being reviewed by the Environmental Protection Agency for possible regulation. In anticipation of future regulation, the United States Navy is developing appropriate emissions models for naval vessels. Actual
emissions data from a U.S. Navy ship is necessary to provide checkpoints for the models. A procedure for collecting this data from an U.S. Navy ship with medium speed main propulsion diesels is presented. It is based on similar testing conducted by the U.S. Coast Guard for measuring patrol boat diesel engine emissions and International Standards Organization
methodology. The primary challenge of the experiment design was to minimize interference with the engineering plant as the assigned ship was concurrently tasked for other operations. Data gathered allowed calculation of engine rpm, engine load, exhaust gas flow rate and determination of pollutant amounts. The tests were conducted at a series of predetermined speeds to reflect an 11-Mode duty cycle developed previously for the LSD 41 Class propulsion diesel engines. The results add to a growing data base of marine emissions and offer insight into the into the effects of secondary control factors such as sea conditions, maneuvering and continued reactions in the stack.
Additional work is included which models an appropriate duty cycle for U.S. Navy high speed propulsion diesel engines found on the MCM-1 Class Mine Countermeasure Ship. The results indicate that not only are the duty cycles developed fro commercial ship operations inadequate for modeling of naval ship operations, but that the naval duty cycles will vary greatly by mission.
Thesis Supervisor: Dr. Alan J. Brown
Title: Professor
Department of Ocean Engineering Thesis Supervisor: Dr. Victor W. Wong
Title: Lecturer
Manager, Sloan Automotive Laboratory Department of Mechanical Engineering
Acknowledgements
On a professional level, there were a large number of people without who's assistance this thesis could not have been completed. I am not certain I can adequately cover the extensive roll and apologize to those who deserve much credit but are missed in the following list. Special thanks to:
My advisors, Captain Alan Brown and Dr. Victor Wong.
Dr. Bentz and Dr. Allen of the Coast Guard R&D Center, who shared the woes of planning and executing the testing of a LSD-41 Class ship. Also thanks to Doug Griggs (NSWC, Carderock) and Mike Iacovelli (NAVSSES) for their good humor, advice and cough drops.
Ed Merry, Ed Epperly and the SUPSHIP Portsmouth crew who assisted in arranging instrumentation for the ship testing.
The entire crew of the USS ASHLAND, LSD-48 for their warm hospitality and willing co-operation during sea trials in February of 1995. A special acknowledgement to LT Billie Walden, a dedicated and talented officer who serves as a role-model for all fortunate enough to sail with her. And a personal note for CDR Mike Hlywiak: the next time we sail together again, I hope the length of the boat is only 36 feet.
Thank-you members of the Mine Warfare Command in Ingleside, Texas. With your help and that of the crews of USS ARDENT, USS WARRIOR and USS
GLADIATOR, I quickly and effortlessly gathered seventy pounds of raw data from which to develop the MCM-1 Class operating profile. Tony, your hospitality and insight was especially appreciated.
LCDR Al Gaiser of RESUPSHIP, Ingleside provided excellent information
regarding the operation of and future developments in design of the Isotta Fraschini diesel
engine. MMI Dole, the token Machinist Mate of the command, also deserves a round of
applause for his unselfish co-operation.
On the personal side, there are numerous names which come to mind. Special
thanks to Tim McCoy and Melissa Smoot, for sanity checks and timely advice. Melissa,
an excellent hostess as always, also performed wonderfully as the most effective gopher I
ever had Oust kiddin'). She is a wonderful friend.
To Grainne and Theresa for relieving long hours of tedium.
I must mention my constant companions during the writing of this work: Matou
and Chicot. While short on conversation, they did help curb the depression of loneliness.
Conversation was forced onto two unfortunate souls: my sister Alice (better
known as Leroy) and Jennifer. Thank-you for your patience and understanding. And, of course, Michael...
TABLE OF CONTENTS
ABSTRACT . ACKNOWLEDGEMENTS ... TABLE OF CONTENTS ... LIST OF FIGURES ... LIST OF TABLES . ... Chapter 1 Introduction ... 1.1 Purpose ...1.2 Current Regulatory Stance ... 1.3 M otivation ...
1.4 Thesis Outline ...
SECTION 1: MCM-1 CLASS OPERATING PROFILE Chapter 2 MCM-1 Class Description and Operat
2.1 Hull and Propulsion Plant Description 2.2 Ship Powering Curve ... 2.3 Standard Bell Order Table ... 2.4 MCM-1 Class Ship operation ... Chapter 3 MCM-1 Class Duty Cycle and Compa
3.1 MCM- 1 Class Duty Cycles ... 3.2 MPDE Duty Cycle Comparisons .... 3.3 SSDG Duty Cycle Comparisons .... 3.4 Duty Cycle Conclusions ... SECTION 2: LSD-41 CLASS EMISSIONS MEA Chapter 4 Experimental Set-up ...
4.1 Discussion of Previous Work ... 4.2 Experimental Goals ... 4.3 Experimental Constraints ... ing Profile ... .. . .. . . . . . .. trison ... S. U ...MENT . . . . . . . . . . .. SUREMENT 20 20 24 26 30 39 39 43 49 52
Chapter 5 Analysis and Results ... 70
5.1 Analysis Approach ... 70
5.2 Discussion of Results ... 75
Chapter 6 Conclusions and Recommendations ... 86
REFERENCES ... 89
Appendix A Sample Logs ... 93
Appendix B Log Review Summaries ... 95
Appendix C MPDE and SSDG Emission Prediction Data ... 110
Appendix D Experimental Instrumentation ... 125
Appendix E Test Plan ... 149
Appendix F Trial Report ... . ... 162
Figure 1 Figure 2 Figure 3 Figure 4 Figure 5 Figure 6 Figure 7 Figure 8 Figure 9 Figure 10 Figure 11 Figure 12 Figure 13 Figure 14 Figure 15 Figure 16 Figure 17 Figure 18 Figure 19 Figure 20 Figure 21 Figure 22 Figure 23 Figure 24 Figure 25 Figure 26 Figure 27 Figure 28 Figure 29 Figure 30 Figure 31 Figure 32 Figure 33 Figure 34 Figure 35 Figure 36 Figure 37 Figure A- 1 Figure A-2 Figure B-I Figure B-2
List of Figures:
Breakdown of Nonroad Sources of NO,
Maximum Allowable NOx Emissions for Marine Diesel Engines USS SCOUT (MCM-8), Port Bow View
MCM-1 Class Body Plan
Isotta Fraschini SS6 V-AM, Right Front View MCM-1 Class Powering Curve
Ship Speed Ahead verses RPM and Pitch Operating Profile Analysis Flow Chart MCM-1 Class Composite Operating Profile LSD-41 Class Composite Speed Operating Profile
Composite Operating Profile Cumulative Time Factor Comparison MCM-1 Class SSDG Operating Profile
Naval Ship Duty Cycle Determination Duty Cycle Engine Speed and Power Points
Pielstick PA4-200-VGA NO. Emission Contour Map Pielstick PA-4-200-VGA CO Emission Contour Map
Pielstick PA-4-200-VGA Gaseous HC Eission Contour Map MPDE NOx Prediction Comparison (g/bhp-hr)
MPDE CO Prediction Comparison (g/bhp-hr)
MPDE Gaseous HC Prediction Comparison (g/bhp-hr) SSDG NOx Prediction Comparison (g/bhp-hr)
SSDG CO Prediction Comparison (g/bhp-hr)
SSDG Gaseous HC Prediction Comparison (g/bhp-hr) Lloyd's Register CO Results
Lloyd's Register NO. Results Coast Guard Normalized NOx Data
Sketch of Intake Air Piping in Uptake Room Volumetric Air Flow Rate versus Engine Load Specific Emissions Analysis Flowpath
Equivalence Ratio versus Engine Load
NOx (ppm) versus Engine BMEP CO (ppm) versus Engine BMEP NO, (g/Kg fuel) versus Engine Load
Lloyd's Register NOx Results for Engines with MCR>4000 kW CO (g/Kg fuel) versus Engine Load
Lloyd's Register CO Results for Engines with MCR>4000 kW NOx Specific Emissions versus Engine Load
Ship Deck Log Sheet Engineering Log Sheet
Comparison of Results from USS ARDENT and ARDENT (x) USS GLADIATOR MPDE Time Factors
Figure B-3 Figure B-4 Figure B-5 Figure B-6 Figure B-7 Figure B-8 Figure B-9 Figure C- I Figure C-2 Figure C-3 Figure C-4 Figure C-5 Figure C-6 Figure C-7 Figure C-8 Figure C-9 Figure C-10 Figure C-11 Figue D- 1 Figure D-2 Figure D-3 Figure D-4 Figure D-5 Figure D-6 Figure D-7 Figure D-8 Figure D-9 Figure D- 10 Figure D- 11 Figure D-12 Figure D-13 Figure D- 14 Figure D- 15 Figure D- 16 Figure D- 17 Figure G-1 Figure G-2 Figure G-3 Figure G-4 Figure G-5
USS GLADIATOR Summary MPDE Composite Operating Profile USS ARDENT MPDE Time Factors
USS ARDENT Summary MPDE Composite Operating Profile USS WARRIOR MPDE Time Factors
USS WARRIOR Summary MPDE Composite Operating Profile Comparison Plot ofMCM-l Class MPDE Operating Profiles Comparison Plot of MCM-1 Class MPDE Time Factors MCM-1 Operating Profile (One Engine Per Shaft) MCM-1 Operating Profile (Two Engines per Shaft) MCM-1 MPDE Duty Cycle
ISO 8178 Duty Cycle E-5 ISO 8178 Duty Cycle E3 CARB 8-Mode Duty Cycle
ICOMIA Heavy-Duty Diesel Duty Cycle MCM-1 SSDG Operating Points
ISO 8178 Duty Cycle D2 ISO 8178 Duty Cycle C-i MCM-1 SSDG Duty Cycle
Machinery Room #1 Instrumentation Layout Uptake Space Instrumentation Layout ACCUTUBE Installation
Distant View of Fuel Flow Meter (MPDE 1A Supply)
Close View of Fuel Flow Meters (MPDE lA Supply and IB Return) Uptake Space Entry (From Inside Space)
Mounting Board with Pressure Transducers, Meters and Power Supplies Near and Distant Views of Pitot Views (MPDE 1B Intake)
Thermocouple and Pressure Transducer Tubing (MPDE lA Intake) Automated Data Collection Station (Main Control)
Valve and ECOM Probe Being Positioned (MPDE IB Exhaust Piping) Pressure Transducer Calibration Curve
Pressure Transducer Calibration Set-up ECTRON Amplifier Calibration Curves
Thermocouple Calibration Curves
Engine 1A Supply and Return Fuel Flow Meter Calibration Plot Engine IB Supply and Return Fuel Flow Meter Calibration Plot Engine BHP Correlation
Volumetric Fuel Flow Rate versus Engine Load NOx (ppm) Differentiated by Plant Alignment NOx (ppm) Differentiated by Day of Testing NO, (ppm) Differentiated by Engine
100 102 103 105 106 108 109 114 115 116 117 118 119 120 121 122 123 124 126 127 129 135 136 137 137 138 139 139 140 141 142 143 144 147 148 188 189 193 194 195
Table 1 Table 2 Table 3 Table 4 Table 5 Table 6 Table 7 Table 8 Table 9 Table 10 Table 11 Table 12 Table 13 Table 14 Table 15 Table 16 Table 17 Table 18 Table B-I Table B-2 Table B-3 Table B-4 Table B-5 Table C-i Table D- 1 Table D-2 Table D-3 Table D-4 Table E- 1 Table E-2 Table E-3 Table F-I Table F-2 Table G- 1 Table G-2 Table G-3 Table G-4 Table G-5
List of Tables:
Sampling of ISO 8178-4 RIC Duty Cycles MCM-1 Class Hull Dimensions
Isotta Fraschini Diesel Engine Parameters Standardization Trials Results
Standard Bell Order Table
MCM-1 Class Ship Data Summary
MCM-1 Class Composite Operating Profile Time Factors MCM-1 Class SSDG Operating Profile Time Factors MCM-1 Class MPDE Duty Cycle
MCM-1 Class SSDG Duty Cycle
MPDE Duty Cycle Emission Prediction Summary SSDG Duty Cycle Emission Prediction Summary
Comparison of Colt-Pielstick PC4.2B and PC2.5V16 Diesel Engines LSD 41 Class Emission Predictions (g/bhp-hr)
List of Operating Points (Converted to Speeds) Run Sequence (Single Engine Per Shaft) Run Sequence (Two Engines Per Shaft)
Specific Emissions Comparison for Pielstick PC4.2B and PC2.5V Engines MCM-1 Class Ship Data Sumary
USS GLADIATOR MPDE Time Factor Summary USS ARDENT MPDE Time Factor Summary USS WARRIOR MPDE Time Factor Summary Composite Time Factor Calculations
MCM-1 MPDE and SSDG Emission Predictions ISO 8178 Accuracy Requirements
Pressure Transducer Calibration Information
Calibration Constant for Thermocouples and Amplifiers ECOM Analyzer Calibration Data
List of Operating Points (Converted to Speeds) Random Run Orders for Single Engine Configurations Rando Run Orders for Dual Engine Configurations Revised Test Blocks of Runs
Results of Fuel Analysis
Partial Pressure and Absolute Humidity Calculations Temperature Calculations
Summary Data from Sea Trials Calculation of Specific Emissions
Comparison of Exhaust Flow Rates Due to Input Data Variations
18 21 22 25 30 32 33 38 41 42 45 49 59 60 66 67 68 85 95 98 101 104 107 111 125 143 144 146 157 158 159 166 171 182 184 186 190 192
CHAPTER 1: INTRODUCTION
1.1 Purpose
With the passage of the Clean Air Act as amended in 1990, regulations regarding limits on the amounts of pollutants discharged as a result of chemical processes were no longer restricted to stationary sources and motor vehicles. The act required the
Environmental Protection Agency (EPA) to determine the contributions of off-road moving sources and, if these contributions proved to be significant, regulate these sources as well. This measure was an attempt to spread the costs of developing and implementing "clean" technologies over a larger population of industries.
Recent legislative activity and research has been directed towards air pollution contributions from off-road sources, including marine engines. As a result, regulation of construction and farm equipment, snowmobiles, lawn mowers, etc. has been enacted. The regulation of the marine industry, including major ships as well as pleasure craft, has lagged which can be attributed to the complexities of ship designs and operation.
As interest in the reduction of air pollution from marine exhaust increases, so must the level of knowledge. Further effort is needed to determine the factors which
differentiate marine engine exhaust from that of other exhaust sources. Additionally, the unique operation and design of public sector vessels may necessitate testing and control philosophies different from commercial ships.
This study continues work to develop a Naval marine diesel engine exhaust emissions model. It consists of two parts: 1) development of a representative duty cycle and prediction of annual pollutant levels for a U.S. Navy ship propelled by high speed diesel engines, and 2) reduction of measured data from an U.S. Navy vessel with medium speed main propulsion diesel engines. The prediction of annual pollutant levels for a medium speed diesel plant has been previously completed.' The experimental results based on pollutant data gathered from a medium speed diesel ship operating at sea is
' Markle, Stephen P., Development of Naval Diesel Engine Duty Cycles for Air Exhaust Emission Environmental Impact Analysis, Massachussets Institute of Technology, 1994.
critically compared to these predictions.
1.2 Current Regulatory Stance
The Clean Air Act (as amended 1990), Section 213, requires the EPA to:
"... Conduct a study of emissions from nonroad engines and nonroad vehicles.., to determine if such emissions cause, or significantly contribute to, air pollution which may reasonably be anticipated to endanger public health and welfare." This study was completed in November of 1991 and led to the regulation of heavy duty nonroad diesels in June of 1994. The contribution of marine exhaust to ambient air quality was found to be significant, especially the contribution of nitrogen oxides (NOx).
The EPA estimates that there are 12 million marine engines in the United States.2 This total number includes both spark ignition and diesel engines. Their studies indicate that 14% of the total non-road source of nitrogen oxides (NOx) can be attributed to marine diesels. The only greater contributors are land-based diesel engines rated at greater than fifty horsepower.3 While the marine engine contribution may seem
insignificant in comparison to the land-based emissions, the current legislative atmosphere requires aggressive regulation of all noticeable sources. Figure 1 refers.
Although it was noted in the EPA study that marine engine contributions for NO. and particulate matter were significant, these engines were not included in the June legislation. The reason for this delay lies partly in recognition by the EPA that existing test procedures for heavy duty off-road engines may be inadequate for ships.'
Additionally, any regulatory scheme proposed by the EPA must first be reviewed for
2 United States Environmental Protection Agency, "Air Pollution from Marine Engines to
be Reduced", Environmental News, 31 October, 1994, p. 1.
3 Environmental Protection Agency Information Sheet, Reducing Pollution from Marine Engines: Information on the Marine Engine Rulemaking, released October 31, 1994, p.2.
4 "Control of Air Pollution; Emissions of Oxides of nitrogen and Smoke From New Nonroad Compression-Ignition Engines at or Above 50 Horsepower", Federal Register, Vol.58, No. 93, p.2 8 816.
conflict with U.S. Coast Guard directives which serve to ensure the safety of ships and seaways.
Some of the unique aspects of a ship's geometry pose additional difficulties in drafting regulations. The stack lengths on ships are typically longer than the exhaust lines on similar land based diesel engines. This additional length may allow continued reactions in the exhaust gases, possibly leading to the measurement of different pollutant levels at the exit of the stack than at the exhaust valve on the engine. The length of the stack on any particular ship is usually set by the internal arrangements and any pertinent criteria imposed by the ship's mission. This effect may be mitigated by the low residual time the exhaust gases need to travel the length of the stack and the isothermal nature of the stack system. In his 1994 thesis, Markle proved that for U.S. Navy medium speed diesels, there were no significant exhaust gas reactions in the stack.
Figure 1: Breakdown of Nonroad Sources of NO,s
Mrine Dine· Engine 14% lther Narad 11% 650 hP Lamn• Nanrmd Engnes 76%
The ship's mission is a primary driver in the design of the hull form. The external shape of the hull affects the engine through the powering relationship. Hull friction and residual resistance counter the thrust created through the ship's propulsion system and
' EPA, Reducing Pollution from Marine Engines: Information on the Marine Engine Rulemaking, p.3.
determine the speed the vessel can attain. The same engine installed in two dissimilar hulls will be loaded at different engine torques and cylinder pressures in order to drive the two ships at the same speed. It is this consideration that is prompting most of the discussion within regulatory bodies regarding the best procedure for emissions testing. No consensus has been reached.
Based on the results of the emissions survey, and due to judicial action by the Sierra Club6, the EPA released a proposed marine engine emission legislation in early 1995. Under this plan, marine diesel engines under U.S. jurisdiction would be regulated in one of two manners as determined by the engine maximum power rating.
Smaller marine diesel engines (less than 50 hP or 37 kW) will be subjected to the following limits: NOx (9.2 g/kW-hr), HC (1.3 g/kW-hr), CO (11.4 g/kW-hr) and
particulate matter (0.54 g/kW-hr)7. These smaller engines will be measured for
compliance on the test stand and no further measurement will be required once installed on the vessel. The testing is to be conducted using ISO 8178, Part 1 procedures and duty cycles. The proposed standards are to be phased in during engine model years 1998 through 2006.
Engines rated at greater than 50 hP (37 kW) will be incorporated into existing regulations on land-based non-road engines of similar power ratings'. This ordinance, issued on 17 June, 1994, limits NOx to 9.2 g/kW-hr and particulate emissions to 0.54 g/kW-hr by 1999. Similar to the smaller engines, maximum pollutant limits will be phased in by model year.
6 "Control of Air Pollution: Emissions Standards for New Gasoline Spark-Ignition and
Diesel Compression-Ignition Marine Engines; Proposed Rules", Federal Register, Volume 59, No.216, 40 CFR Parts 89 and 91, November, 1994, p.55932.
7 EPA, Reducing Pollution from Marine Engines: Information on the Marine Engine
Rulemaking, p.3.
During conversations with EPA personnel
9'
10, they indicated that the proposed
regulations were drafted to match as closely as possible the predicted international
regulatory schemes. The U.S. regulators wish to avoid implementing an emissions
control scheme which may be at odds with the proposed methods endorsed by
international shipping organizations such as the International Maritime Organization,
Marine Environmental Protection Committee (IMO, MPEC). This approach avoids
penalizing ships calling at U.S. ports by not requiring them to meet different international
and port state environmental standards.
Work on development of these international standards continues. Annex 6 to
MARPOL, the document in which the program will be introduced, was due to be released
in early 1995. The document has been delayed. A copy of the MPEC's proposal indicates
that both regulatory sources will implement an approach to diesel engine exhaust
compliance which requires bench test certification of an engine family. The engine
parameters which designate an engine family have not been conclusively selected by either
organization. Examples are engines which use the same type of fuel, method of air
aspiration, number of cylinders, etc.
1The intent is to group engine's with similar
combustion and operating characteristics that should produce similar levels of pollution,
thereby avoiding testing and certification of every engine model. Once the engine family
has been certified, the EPA would require later testing of engines after a period of normal
operation. In their plan, the targeted engine would be removed from a hull and relocated
to a laboratory for testing. Where engine removal is not possible, the engines may need to
be tested as installed.
The certification procedure referred to above is currently limited to steady state
9
Interview with Ken Zerrefa, Environmental Protection Agency, National Vehicle and
Fuel Emissions Laboratory, Ann Arbor Michigan, conducted via telephone on 10 January, 1995.
10
Interview with Todd Sherwood, Environmental Protection Agency, National Vehicle
and Fuel Emissions Laboratory, Ann Arbor, Michigan, conducted via telephone on 2 February,
1995.
engine operation. While the pollutant emission rate may be higher during transient operations, these maneuvers only contribute a small amount to total engine operating time'•13 . Based on this conclusion reached independently by both the EPA and ICOMIA, duty cycle development should consider only steady state operations. The EPA, in the marine engine emission proposal, has asked for comments with regard to using a solely steady-state approach for certification testing of candidate diesel engines in order to provide a vehicle for dissenters to support their position.
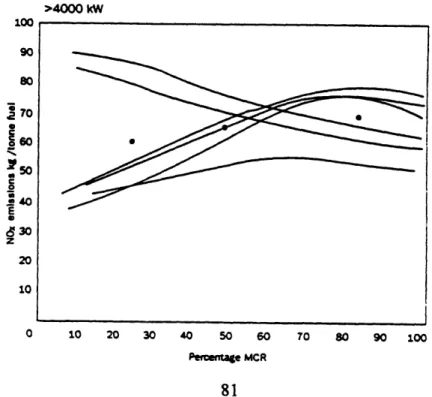
Despite the similarities between the EPA and IMO proposals with regards to certification and monitoring, the IMO does not intend to adopt a single maximum NOx emission value for all diesel engines. Figure 2 is a graph of total NOx emissions as a function of rated engine speed. Rated speed is defined as the speed at which, according to the engine manufacturer, the rated power occurs. The total emission of NOx must be within the limits shown in Figure 2 when the engine is fueled with marine diesel oil and is operating at a relevant, pre-determined test cycle. This approach results in different emission limits for high and low speed engines and addresses the question of engine loading through the selection of an appropriate test cycle.
More stringent maximum single point NO, emission limits have been posed by the State of California. Due to the state's extremely poor ambient air quality, they have been required by law to address all pollution sources which are found to contribute to air quality deterioration, even if these sources are not regulated by the Federal government (refer to Section 209(e)(2)(A) of the amended Clean Air Act). New engine model NO, emissions will be required to meet a standard of 0.77 to 0.97 g/kW-hr'4.
As of March, 1995, a State Implementation Plan (SIP) has not been approved for
12 Federal Register, Volume 58, No.93, p.2 8 8 2 0.
"' Morgan, Edward J., "Duty Cycle for Recreational Marine Engines", Society of Automotive Engineers, Paper no. 901596, 1990, p. 10.
14 English, R. E. and Swainson, D. J., "The Impact of Engine Emissions Legislation on
Present and Future Royal Navy Ships", Presented at INEC 1994 Cost Effective Maritime Defense, 31 August - 2 September, 1994, p.3.
California. The California Federal Implementation Plan (CFIP) is a federally drafted plan which California must adopt until her own SIP is approved. The CFIP has adopted the
CARB's approach to estimating marine emissions and added a fine/penalty system". The implementation of the CFIP has been blocked due to economic concerns. The state recently released a SIP, which if approved by federal regulators would supersede the CFIP. The proposed regulatory scheme of the SIP is similar to the proposed EPA rulemaking.
Figure 2: Maximum Allowable NO, Emissions for Marine Diesel Engines'6
'5 Markle, pp. 24-25.
16 International Maritime Organization, "Draft Technical Guidelines for NO,
Requirements under the New Annex for Prevention of Air Pollution", October 7, 1994 p.2.
15
NOx (g/kWh] D /Et /E3 cycle on Marine lDesel 011l
20•
~e
E
n<G130 rpm -
17
g/kWh
16 - 30< n<2000 rprn --- , 45* ' g/kWh 14,r - nni200 rprm - 9.884 g/kWh 12 10 2.iRATED ENGINE SPEED [rpml
* lToayc•se in eonsm•nsra mo all PW 4
For additional discussion of the CFIP and CARB studies, refer to Markle, 1994. Despite the separate plan and emission limits projected for the state of California, it is predicted that the majority of ships visiting U.S. ports will be regulated under the IMO/EPA proposal.
1.3 Motivation
An approach to monitoring marine diesel engine emissions based on bench test results of sample engines prompts two discussions: 1) What is the correct duty cycle for testing of a marine vessel? Can all marine vessels be represented by the same duty cycle? and 2) How well does a controlled laboratory test capture the actual emissions of a ship's engine performing at sea9
A duty cycle is a sequence of engine operating modes each with defined speed, torque and time weighting factor. A survey of existing diesel engine duty cycles is presented in Markle, 1994. Emphasis will be placed on only one set of these duty cycles, those presented by the International Organization for Standardization (ISO) in its 1992 publication, "Reciprocal Internal Combustion (RIC) Engines -Exhaust Emission Measurement", ISO 8178-4. Thirteen duty cycles for various engine applications are listed in this document, four of which the EPA is considering for modeling of marine diesel engine operations'7. The pertinent test cycles are provided in Table 1. The power figures are percentage values of the maximum rated power at the engine's rated speed.
ISO Duty Cycle Cl is primarily used to model off-road vehicles and industrial equipment with medium to high loads. The EPA has suggested this cycle to model marine auxiliary diesel engine operations. This definition would include all diesel generator sets. In recognition that Cl may not be the appropriate test cycle to model marine generator sets, which operate at a constant speed, cycle D2 has also been suggested.
ISO Duty Cycles E2 and E5 can be used to model marine diesel propulsion engines based on a propeller curve mode of operation as opposed to constant speed operations.
Cycle E5 is developed from operational data gathered by Volvo and the Norwegian government and is appropriate for diesel engines in craft less than 24 meters long. It is intended to model craft which are not heavy loaded; therefore engines installed in tug boats and push boats less than 24 meters in length are excluded from using this test cycle. ISO Duty Cycle E3 is based on propeller curve mode of engine operation (as opposed to constant speed engine operation) and also represents heavy duty engines for ship
propulsion with no limitations on the length of the ship. The final EPA legislation will dictate testing to be performed using one of these two cycles, selected on the basis of the arguments presented in response to the proposed rule-making. Neither may be
appropriate for engine which drive controllable pitch propellers, which operate at low loads with a constant engine RPM.
The ISO 8178-4 RIC Duty Cycle E3 and E5 are derived from commercial vessel operation. Large commercial vessels (such as containerships, bulk carriers, etc.) are designed to sustain high usage rates at a relatively constant speed. They operate near the hull's maximum speed capability, with transient behavior only when entering and leaving port. Hence the emphasis in Duty Cycles E3 and E5 on high speed cruising near the rated power of the engine in the test cycles.
In general, naval ships spend less time at sea and operate with large variations in ship's speed. In recognition of this fact, a method for determining alternative diesel engine duty cycles for naval ships was developed and demonstrated for the LSD-41 Class
Amphibious Vessel. The results of this analysis can be found in Markle. Markle used his duty cycle with appropriate test bench measured diesel engine emission maps to predict a single point annual pollutant emission amount. Using other common duty cycles and the same emission maps, a comparison could be accomplished and the appropriateness of applying commercial ship based duty cycles to naval vessels could be discussed.
1.4 Thesis Outline
The first section of this thesis applies the same methodology to a representative high speed main propulsion diesel engine in the United States Naval inventory. The
Table 1: Sampling of ISO 8178-4 RIC Duty Cycles"s
Cycle Name Mode Number % Power %Speed Weight Factor
C1 1 0 0 0.15 % Torque 2 50 60 0.10 not % Power 3 75 60 0.10 4 100 60 0.10 5 10 100 0.10 6 50 100 0.15 7 75 100 0.15 8 100 100 0.15 D2 1 10 100 0.10 2 25 100 0.30 3 50 100 0.30 4 75 100 0.25 5 100 100 0.05 E3 1 25 63 0.15 2 50 80 0.15 3 75 91 0.5 4 100 100 0.2 E5 1 0 0 0.3 2 25 83 0.32 3 50 80 0.17 4 75 91 0.13 5 100 100 0.08
" ISO 8178, Part 4, Reciprocating Internal Combustion Engines- Exhaust Emission
selected ship class is the MCM-1 Mine Countermeasures Ship. Three of the thirteen ships in the class were visited and subsequently analyzed. Using data available both from recent bench testing of the Isotta Fraschini engine and from literature, an estimate of the annual pollutant emissions from a MCM-1 Class warship was computed. These results were critically compared to calculated emissions based on the ISO duty cycles.
As alluded to in the previous section, the proper method for estimating the emission tonnage which can be attributed to marine engines is still under debate. The bench testing of a representative engine at an appropriate duty cycle has been
recommended by both the IMO and EPA. CARB's regulatory scheme uses emission estimates based on an assessment of traffic types and densities combined with an emission factor equating NOx levels to rated engine RPM. Other regulatory bodies employ
different forms of emission factors, many of which are supported by little literature detailing the origins of the factors.
It is also strongly felt that many emission factors fail to account for common operating situations, such as mistuned engines, variations in emissions from engines of the same model, and variation in engine operating hours and maintenance levels. In particular, has been demonstrated that NOx levels are very sensitive to engine combustion chamber conditions9.
The second section of this thesis attempts to provide additional data to a growing database in order to resolve which emission estimation procedure best models actual levels measured from ships at sea. The instrumentation and collection of emission data from a LSD-41 ship operating at sea is discussed. The results are compared to estimates previously calculated20 and proposed maximum emission limitations.
19 Lloyd's Register Engineering Services, Marine Exhaust Emissions Research Programme: Steady State Operation, 1990, p.4.
20 Markle, 1994.
CHAPTER 2: MCM-1 Class Description
2.1 Hull and Propulsion Plant Description
The MCM-I Mine Countermeasures Ship Class was designed to replace the older AGGRESSIVE and ACME classes of minesweepers (MSOs). The MCM-1 Class is designed to clear bottom and moored mines in coastal and offshore areas and is both larger and more capable than its predecessors. The wooden hull, with its glass reinforced plastic sheathing, is an unique characteristic of the ship. Figure 3 is a port bow view of the USS SCOUT (MCM-8) at sea. Figure 4 provides the class body plan, which
simultaneously displays two half transverse elevations of the hull about a common vertical centerline. Principal dimensions are included as Table 2.
Figure 3: USS SCOUT (MCM-8) Port Bow View21
Lf
There are a total of fourteen ships in the MCM-1 Class. The first two hull numbers have a different propulsion plant, consisting of four Waukesha diesel engines and two propulsion shafts. These engines were found to be both noisy and maintenance intensive, and were replaced in the later hulls of the class.
21 Ships and Aircraft of the United States Fleet, U.S. Naval Institute, Annapolis, Maryland, 1993, p.2 12.
Figure 4: MCM-1 Class Body Plan2
Ii
I
/1
-I I /I,
7
i/
V 7I/141
' I DWL 8.L.Table 2: MCM-1 Class Hull Dimensions
Design Displacement 1312 Itons
Length Overall 224 ft
Length at Design Waterline 212 ft
Extreme Beam 39 ft
Design Draft 12.1 ft
Prismatic Coefficient (CP) 0.575
Maximum Midship Section Coefficient (Cx) 0.842 Wetted Surface Area
Water Plane Area Coefficient (C,) 0.755
The propulsion plant in the remainder of the ship class consists of four
turbocharged Isotta Fraschini diesel engines rated at 600 horsepower with two smaller
"2 MCM Countermeasures Ship (MCM) Preliminary Design Hull Form Development Report (C), Naval Sea System Command report C-6136-78-31, Februaury, 1979, p.4 1(unclas).
'V
Ii
I
I • . ..
A/7
1//r"//A22
t ". -'· "" ' •(200 horsepower) direct current electric light load propulsion motors (LLPMs). Under normal steaming conditions, each shaft is driven by either one or two main propulsion diesel engines through a flexible coupling, a pneumatically operated tube type friction clutch and a single stage Philadelphia Gear reduction gear. The reduction gear ratio is given by equation (1).
RPMDMSE
A
-
- 10.64
(1)
RPMz
For light load conditions (less than eight knots), and at times when the ship wants to minimize waterborne noise, the reduction gears can be directly coupled to the light load electric motors. Power for these motors is provided by the ship's magnetic minesweeping gas turbine generator. Additionally, a 350 horsepower electrohydraulic bow thruster is installed. Three Isotta Fraschini diesels are also employed as the electrical generator prime movers. In this use, the engines run at a constant speed and are loaded lightly. Basic engine parameters are provided in Table 3. Figure 5 is a right, front view of the engine.
Table 3: Isotta Fraschini Diesel Engine Parameters
Model Isotta Franchini ID 36 SS6 V-AM
Type Non-Reversing
Cycle Four Cycle, Turbocharged
Rated Load 600 hP
Rated RPM 1800 RPM
Bore and Stroke -inches 6.693" X 6.693"
Number of Cylinders 6
Piston Displacement 235 cubic inches
Engine RPM at Idle (Not Loaded) 795 RPM
Figure 5: Isotta Fraschini 36 556 V-AM, Right Front View23
FRESHWATER
PRIMNG MOTOR
PUMP
23 MCM-1 Class Ship's Information Book, Volume II, S9MCM-AC-SIB-020/MCM-3,
Two inboard turning, controllable pitch propellers complete the drive train. As in any mechanical system, the connection of the various components is not accomplished without friction losses. The mechanical efficiency (rlmEc) indicates the extent of these losses by comparing the shaft horsepower (SHP) measured at the propeller to the brake horsepower (BHP) measured at the engine output shaft. Equation (2) computes the mechanical efficiency of the drive train for the MCM-1 Class.
SEP 1175
'icr --- B 0.979 (2)
BHP 1200
2.2 Ship Powering Curve
A ship's forward motion through the water is retarded by drag, which consists of frictional and residual drag forces. The amount of frictional drag is primarily determined by the wetted surface area of the hull. Air drag also is a part of the total frictional drag, but its contribution is usually quite small for naval combatant vessels. The residual drag forces consist of all forms of flow drag that are not residual. This includes wave-making
and eddy forming resistance.
The amount of drag which a hull form will experience is determined early in the design process using numerical processes and model test results. This data is used to adequately size the propulsion plant so as to enable the hull to meet the desired sustained
speed. After the ship is built, it is taken to sea and tested to determine the actual performance of the propulsion plant and hull under realistic operating conditions. The Propulsion Plant Standardization Trial is conducted on one ship of the class, and the class wide powering curves are constructed from its data.
The Standardization Trial for the MCM-1 Class was conducted on 14 June, 1991 aboard MCM-8, USS SCOUT. Table 4 contains a summary of the results of these trials. The testing was conducted at design displacement and draft; these conditions will be assumed throughout the analysis.
Table 4: Standardization Trial Results24
Speed (knots) Shaft RPM Torque (Ibf-ft) Power (hP)
11.8 139.8 42933.3 1143.3
12.7 150.75 500050 1435
13.4 160.8 57500 1760
14.3 175.2 67800 2260
The data in Table 4 suggests the relation between speed and power for the
MCM-1 Class. Curve fitting the speed and shaft power data points provides the powering curve given in Figure 6.
Figure 6: MCM-1 Class Powering Curve
0 5 10 15
Speed in knots
24 Klitsch, Michael and Liu, Wayne, USS SCOUT (MCM-8) Results of Standardization.
Locked and Trailed Shaft Trials, Carderock Division, Naval Surface Warfare Center, CARDEROCKDIV-92/008, Bethesda, Maryland, May, 1992, pp.2 6.
The curve of Figure 6 represents two operating regimes. At speeds below 9 knots, which corresponds to a speed/length ratio less than 0.6, frictional resistance dominates. The power to overcome frictional resistance is a function of the ship's velocity squared and in this case is governed by equation (3).
At speeds greater than 9 knots, residual resistance dominates and the associated shaft horsepower per knot is a function of the ship's speed cubed. This relationship is represented by equation (4).
Power - 4.07 * Speed 2 + 26.5 * Speed (3)
Power - 244.86 * Speed - 40.029 * Speed 2 . 2.449 * Speed 3 (4)
Equations (3) and (4) provide estimates of the required shaft horsepower
necessary for the ship to maintain a certain speed. These equations apply for every ship of the class but gross errors can be introduced due to ship loading, hull fouling, machinery degradation or adverse weather conditions.
2.3 Standard Bell Order Table
For most ship classes, the Standardization Trials also provide the class wide relationship between shaft RPM, propeller pitch angle and ship's speed. The MCM-1 Class vessels, similar to many other naval ship classes with controllable pitch propellers, maintain a constant shaft RPM at low ship speeds, controlling the developed shaft thrust by adjusting the pitch on the propeller blades. Above a certain shaft power, the propeller pitch is held constant and the ship's speed is raised by increasing the shaft, and engine, RPM. The shaft power at which shaft RPM begins to increase at constant pitch (ramp-up) can be programmed through electronics, which monitor engine torque and usually include a feedback loop. An electronically predetermined throttle position corresponds to specific engine RPM and propeller pitch settings, which can be correlated to ship's speed using the
powering relationships developed from the Standardization Trials. The final result is a class wide standard bell order table which equates a specified bell order to an approximate ship's speed by indicating propeller pitch and shaft RPM.
Currently, class wide standard bell orders are not specified for use by the MCM Class ships. The primary reason lies with the relative newness the ship class. Unlike other feedback systems for the electronic controls which measure shaft torque directly or engine air box pressure, the MCM-1 controls receive feedback from secondary signals of
propeller pitch and shaft RPM. The original ramp-up control points for MCM-3 through MCM-8 were found to cause an unacceptable engine acceleration rate when increasing the
propeller pitch from 80% to 100%. To reduce this acceleration rate and account for changes in the LLPM motor controllers, the electronics were changed for MCM-9 through MCM-14. Plans are to retrofit the system changes to cover all ships of the class with Isotta Fraschini engines installed. Future plans also include adjusting the ramp-up
controls feedback signal and relocating the measurement points to more accurate engine indicators such as the air box pressure or improved shaft torsion meters2".s
The use of feedback signals originating from the propeller pitch and shaft RPM has also raised concerns of possible engine over-torquing if class standard bell orders are introduced prematurely26. Since the zero thrust pitch position for each ship of the class's propellers is not the same value, the engine load corresponding to a predetermined signal for maximum speed may call for an engine RPM and torque greater than the engine was
designed for. Until improvements to the MCM-1 Class machinery plant control system are completed, each ship has been directed to conduct their own trials and develop appropriate bell order tables for their own use.
The bell order tables for three recently built MCM-1 Class ships (USS ARDENT
25 Phone Conversation with Ray Conway, Naval Ship Systems Engineering Station
(NAVSSES), Philadelphia, PA dated 20 March, 1995.
26 Phone Conversation with Gary Carlson, Code 260, Supervisor of Shipbuilding, Conversion and repair, USN (SUPSHIP) Sturgeon Bay, Sturgeon Bay, WI, on 21 Feb 1995.
MCM-12, USS GLADIATOR MCM-11 and USS WARRIOR MCM-13
)
were obtained
and compared. The table of the USS GLADIATOR was selected as the best
representation of propeller pitch/shaft RPM and ship's speed relationship for MCM-9 through MCM-14. It most closely matched the data points measured on MCM-8, USS
SCOUT, during Standardization Trials. The relationship changes with the number of engines online. Figures 7 graphically depicts the linear relation between pitch/RPM and ship's speed when operating in the forward direction.
The different ramp-up points for four verses two engine operations is obvious from review of the Figure 7. This variation creates a different relationship between ship's speed and pitch/RPM as the total number of engines online is changed. For two engines online per shaft, equation (5) gives the ship speed equation for operation in the constant RPM region where speed is determined by propeller pitch. Equation (6) gives the ship speed as a function of RPM in the constant pitch region.
Figure 7: Ship Speed Ahead verses Shaft RPM and Pitch Angle
Pitch Angle Shaft RPM
90 i! ~//
/
60[
30 ,t
/4
0 4 8 12
Ship Speed (knots) -- - -- ch Al ko E/Shabft) - - - ,Pith AASk (wo En~h) - Shaft RPM (OnEg/Bhaft)
Equations 5 and 6:
Two Engines Online Per Shaft:
Ship Speed - 11.7 . 4.6 * Speed - 1.28 * Speed 2 (5)
Ship Speed - 13.5 * Speed - 16.28 (6)
Equations (7) and (8) provide the same relations when only one engine is online per shaft.
One Engine Online Per Shaft:
Ship Speed - 11.5 * 3.55 * Speed + 1.38 * Speed 2 (7)
Ship Speed - 15.45 - Speed - 12.35 (8)
The resulting Standard Bell Order Table is included as Table 5 and is used
throughout this thesis when equating engine orders to ship's speed through the water. The astern direction bells have not been included as this thesis concentrates on steady state operation, and astern maneuvers are used only in transient operations.
In order to provide better control during tight maneuvering situations, such as station keeping during mine-hunting operations, a non-standard nomenclature is used for the bell orders. Only the MCM Class ships with the Isotta Fraschini main propulsion diesel engines (MPDE) have a control system designed to respond to bell orders ranging from one to ten. Increments as small as one tenth between these standard bells can be ordered, although the norm is to adjust only to the closest half bell.
Table 5: Standard Bell Order Table
Bell Order Speed (knots) Engines/Shaft Shaft RPM Propeller Pitch
All Stop 0 1 or 2 79 12 1.0 1.4 1 79 21 1.0 1.85 2 79 29 2.0 3.8 1 79 44 2.0 3.7 2 79 46 3.0 5.1 1 79 61 3.0 5 2 79 65 4.0 7 1 96 74 4.0 7 2 80 110 5.0 8.4 1 117 74 5.0 8.4 2 96 110 6.0 9.8 1 137 74 6.0 9.8 2 112 110 7.0 11 1 158 74 7.0 10.7 2 129 110 8.0 11.5 1 168 74 8.0 12.1 2 146 110 9.0 13.1 2 162 110 10.0 14 2 173 110
2.4 MCM-1 Class Ship Operation
Unlike other ships in the U.S. Navy inventory, the MCM-1 Class vessels assigned stateside do not deploy regularly. Rather, the crews of these ships are rotated to forward deployed ships of the class. The primary purpose of the stateside ships are to serve as
replacement vessels and to serve as training platforms for rotating crews. The nature of mine-hunting requires most training missions to be accomplished close to the shore, in waters of depths less than 1000 feet. In this role, the majority of the stateside MCM Class operations are conducted within fifty miles of land, in an operating area referred to as GOMEX, which stands for the Gulf of Mexico Operating Area. GOMEX is land bound, snuggly situated with the Texas coastline to the north and west, Mexico to the South, and the Florida panhandle due east. The operating enviroment in GOMEX is greatly effected by close land masses.
Even when transiting to other continental U.S. ports for training or liberty, the short endurance of the ships precludes routing more than one day's travel distance from land. Based on these established patterns, it is reasonable to assume that all MCM-1 Class operations occur within 100 nautical miles of land. This proimity to land increases the possibility that the exhaust emissions of the MCM- Class contribute to the polution problems of coastal areas.
In the GOMEX operating area, the ship conducts a wide variety of crew training. This may include engineering plant casualty, damage control, man overboard and ship handling drills. These evolutions are conducted at a myriad of speeds and engine alignments. Minehunting training can be either mine sweeping, which is conducted at a singular slow speed or minehunting, which is conducted at slow speeds or at idle with many speed changes. Infrequently, the Main Propulsion Diesel Engines (MPDEs) are disengaged and the shafts are propelled by the LLPMs while conducting slow speed, quiet mine hunting operations. In contrast, the ship operators prefer to transit at high speed, which for this ship class approaches twelve to fourteen knots. Despite the relative newness of the class, these operating patterns appear to be well developed.
The method by which the MCM-1 Class operating profile was established was based on a similar analysis conducted on the LSD-41 Class Amphibious Ships by Markle in 1994. A variety of operational logs were gathered, including the ship's Deck Log and Engineering Log. The Deck Log is a legal document which records all significant events in the course of a day. Underway, it is also the document used to record the time and
magnitude of all speed and course changes. The speed changes are given in terms of a bell
order, which equates to a predetermined propeller pitch angle, shaft RPM and ordered
speed. A sample Deck Log sheet is provided in Appendix A.
The Engineering Log records all pertinent information regarding plant status and
evolutions in the engineering spaces. The most important entries in this log for analyzing
the ship's operating profile is the starting, clutching, declutching and stopping of MPDEs.
A sample Engineering Log is also provided in Appendix A.
In order to develop an appropriate operating profile for the MCM-1 Class, copies
of these two logs from three of the fourteen ships were collected. The three ships selected
had recently completed similar operations, including GOMEX training operations, transit
to Panama City, Florida for advanced combat systems training, and additional transit to
support crew's liberty. Included in the six months reviewed are unequal portions in which
all engines were out of commission due to repair work. Table 6 presents a summary of
the operating time evaluated.
Table 6 : MCM-1 Class Ship Data Summary (time in hours)
USS ARDENT
USS GLADIATOR
USS WARRIOR
Hull Number
MCM-12
MCM-11
MCM-13
Time Period (1994)
1 May - 31 Oct
1 May - 31 Oct
1 May - 31 Oct
Data Points
4926
6330
3757
Time Covered
211318
221760
161640
Time Secured 191321 187603 139130 Time Running 19997 34157 22510 Time Declutched 623 1830 965 (Cool Down) Time @ Idle 2974 2155 1022 Time @ Power 16400 30172 20523analyzed. This is a reflection of the low availability of the MCM-1 Class equipment (including the Isotta Fraschini Engines) and the modest range of the vessels. Most GOMEX maneuvers are conducted in a single day, with a return to port at the
conclusion. It is not anticipated that these patterns will change significantly as the class matures.
The method of forming the operating profile closely follows that used by Markle. The Engineering Logs and Deck Logs were used to determine the amount of time each engine was online at specific speed and power combinations. Figure 8 recreates a flow chart of the logic used in the analysis. The composite operating profile for all three ships is included in Table 7.
Table 7: MCM-1 Class Composite Operating Profile Time Factors Ship Speed (knots) One Engine/Shaft Two Engines/Shaft Total
Idle * * 0.114 1 0.002 0.002 0.004 2 0.005 0.008 0.013 3 0.002 0.006 0.008 4 0.01 0.011 0.012 5 0.019 0.012 0.031 6 0.009 0.004 0.013 7 0.034 0.017 0.051 8 0.05 0.01 0.060 9 0.018 0.002 0.020 10 0.053 0.283 0.336 11 0.089 0.075 0.164 12 0.04 0.005 0.045 13 0.094 0.094 14 0.023 0.023
Figure 8: Operating Profile Analysis Flow Chart Engine RPM =79 RPM No Engine RPM---=79 RPM Engine BHP Equation3 No Ship Speed >9 kts? IEquation 4 Yes Equation 6
I
J
Engine RPM Engine RPM Results: Time Engine Online Engine RPM -- Engine BHP Engine BHPFigure 9 presents the data of Table 7 in an easily viewed format. Review of the figure implies that the MCM-1 Class ships operate primarily at the higher speed ranges
and at idle. The idle time factor also includes time the engines spent at cool-down and declutched. Although there was no requirement for a significant warm-up period prior to clutching in the Isotta Franchini engines, standard operating procedure does include a five minute cool-down period. The idle time factor was defined to include all intervals in which the engine was operated declutched for cool-down or drills and intervals in which the ship was making no headway, but the engines were online. The difference in engine load for these conditions is insignificant. There is also a significant spike at ten knots, a preferred speed for transit operations.
Figure 9: MCM-1 Class Composite Operating Profile
0.350-0.300} 0.250- 0.200-E p 0.150+ 0.100 0.050 0.000-... .. 0 1 2 3 4 5 6 7 8 9 10 11 12 13 14
Ship'. Speed (knot)
Figure 9 can be contrasted to Figure 1027, which is recreated from Markle. Figure 10 is the composite operating profile for the LSD-41 Class Amphibious
Vessel. The ships are powered by Colt-Pielstick PC2.5-V16 engines, a medium speed diesel. The profile for operation of the amphibious ship indicates greater time factors for the slower speeds of five and ten knots and a spread centering on seventeen knots to
represent transit operations. The notable difference in the operating profile between the two ship classes implies that the ship's mission has a significant impact on the duty cycle and should be the primary factor on which the duty cycle is based.
Figure 10: A A
LSD-41 Class Composite Speed Operating Profile
F12ii-0 -n 0 * a V - 0 Q 0
Ship Speed (knots)
Figure 11: Composite Operating Profile Cumulative Time Factor Comparison
0.8 0 a 0.6 . e 0.4 0.2 - " ARDENT -GLAD WARRIOR -... Average
Ship Speed (knots)
.120.12 -r V 1.::: ::::I::::: · · · · ·~-···'·-··· 4;;
Figure 11 demonstrates the variation in how each of the MCM-1 Class ships considered in the analysis were actually operated. The variation at low speeds is minimal, with significant deviations beginning at a speed of approximately six knots. This variation reflects the influence of operator preference in developing a class wide operating profile. The large spike at approximately 7.5 knots for the USS GLADIATOR was created when the ship was tasked with additional transit operations beyond those assigned to the other two ships analyzed. This was an isolated event which had little impact on the class wide operating profile.
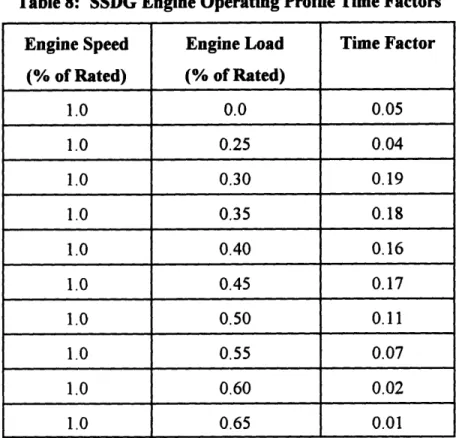
Operating logs from one ship were analyzed to predict the SSDG operating profile. Table 8 provides a summary and Figure 12 presents the data graphically. The operation of the MCM-1 Class SSDGs is concentrated around the 50 percent load point. This pattern matches that observed in Markle for the SSDGs aboard the LSD-41 Class Amphibious Ships. The parallel results for ship classes with radically different missions can be
attributed to U.S. Navy standard operating procedures. Navy ships are required to keep additional generators online over what is required by the electrical load in the event of a casualty. If one generator is lost, there must be sufficient capacity remaining to continue to provide the vessel adequate electrical power for operation. This requirement is common for all naval ships, and explains the similar SSDG operating profile for both the MCM- 1 and LSD-41 Classes.
Table 8: SSDG Engine Operating Profile Time Factors Engine Speed Engine Load Time Factor
(% of Rated) (% of Rated) 1.0 0.0 0.05 1.0 0.25 0.04 1.0 0.30 0.19 1.0 0.35 0.18 1.0 0.40 0.16 1.0 0.45 0.17 1.0 0.50 0.11 1.0 0.55 0.07 1.0 0.60 0.02 1.0 0.65 0.01
Figure 12: MCM-1 Class SSDG Operating Profile
o 0. 0 5 0. U 0 A 1 I• as . U US
Normlizod Engine Loaing
0.2 0.1t 0. 1M2 .o3 """""'"""""~~~~'""^'`""~''""`~"""""'~~""~ "'""'""" ...-... ····--···---··-···--···-···-··· -·-···-··· --··· ·-···-· -···--··-··· ····-····-·· ··-·-··-··-· -·-···--···· ··-·--·-···· ·--·---
·--Chapter
3:
MCM-I Class Duty Cycle and Comparison 3.1 MCM-1 Class Duty CyclesIn Chapter Three of his 1994 thesis, Markle describes the development of duty cycles for generic application to land based diesel powered systems. In all of these
systems, the useful power out of the diesel engine is countered by static and rolling friction forces. The relationship between these forces, vehicle size (weight) and engine loading results in a fairly constant percent plant output for a given vehicle speed. This
consistency, despite differences in manufacturers or vehicle size, allows accurate modeling of most engines' operations using generic duty cycles.
Markle then compares engine horsepower normalized by vehicle weight (or ship displacement) against weight or displacement in an effort to reveal the wide variability in ship displacements and power requirements. For naval ships, this variability has two causes: 1) the engines are sized to provide a "burst speed" capability, and 2) the underwater hull form of ships with similar displacements can be radically different, creating varying powering relationships for each hull. A generic duty cycle for marine vessels would be inadequate for modeling all ships because of this unique resistance relationship. The class specific duty cycle must be generated based on the time factor, engine power and speeds of the class wide speed operating profile.
Previously, the operating profile for the MCM-1 Class was developed from a review of actual ship operating logs. The composite operating profile can be combined with ship specific propulsion train and powering information as indicated in Figure 13 to
determine the MCM-1 Class duty cycle. The MPDE duty cycle presented in Table 9 was created using the method charted in Figure 13 and by combining engine speed and power ranges about the most heavily weighted operating points. As the ship can be operated with either one or two engines per shaft, the duty cycle contains representations of both alignments.
The MCM-1 Class duty cycle contains significantly more data points than duty cycles created to model commercial ship operations which were introduced in Chapter
One. The additional data points are necessary to model the wider variation in operating
speeds experienced by a Naval ship. The MCM-1 Class operating profile displays a bias
toward high speed transit versus slower speed maneuvers. Despite this pattern, sufficient
slow speed operating points must be included in a duty cycle to project an image of all
types of maneuvers.
Figure 13: Naval Ship Duty Cycle Analysis Flow Chart
20Table 9: MCM-1 Class MPDE Duty Cycle
Mode Ship Speed Engines/Shaft Engine Speed Engine Power Time
(knots) (% of Rated) (% of Rated) Factor
1 0 0 0.44172 0 0.123 2 3.7 2 0.44712 0.100 0.0129 3 3.8 1 0.44172 0.205 0.0310 4 7 1 0.536 0.328 0.0466 5 7 2 0.44172 0.164 0.0184 6 8.4 1 0.657 0.434 0.0537 7 9.8 1 0.778 0.732 0.0728 8 10.3 2 0.685 0.401 0.305 9 11.3 2 0.772 0.518 0.081 10 11.6 1 0.881 1.00 0.130 11 12.6 2 0.863 0.693 0.101 12 13.9 2 0.935 0.877 0.025
The MCM-1 MPDE Class duty cycle is plotted along with the other duty cycles introduced in Chapter One as functions of engine RPM and load (Figure 14). The MCM- 1 Class duty cycle has a greater number of operating points and more closely matches a representative plot of a propeller curve for controllable pitch propellers.
The duty cycle for the SSDG prime movers is developed in a similar fashion. The typical underway electrical load is 360 kW, usually split between two generators for safety through redundancy. The rated electrical load for one generator is 375 kW, which
accounts for losses incurred converting mechanical energy to electrical energy. At anchor, the load on each generator decreases to approximately 25% of the rated engine power. The MCM-1 Class SSDG duty cycle is presented in Table 10.
Figure 14: Duty Cycle Engine Speed and Power Points 0 0 0c o 0 A S A o a r A D '×| ¢o 0 0.2 A .*0.. RPM Factor
Table 10: MCM-1 Class SSDG Duty Cycle
Mode Engine Speed Engine Load Time
(% of Rated) (% of Rated) Factor
1 1.0 0 0.07 2 1.0 0.3 0.21 3 1.0 0.35 0.21 4 1.0 0.4 0.19 5 1.0 0.45 0.20 6 1.0 0.5 0.12 IIOE WARI IMod I033
This duty cycle varies slightly from that derived for the LSD-41 Class Amphibious Ship, with the MCM-1 Class SSDGs tending to be more lightly loaded. It is also similar enough to the proposed ISO 8178 D2 duty cycle that this testing procedure could be used with minor adjustments.
0