HAL Id: hal-01832198
https://hal.archives-ouvertes.fr/hal-01832198
Submitted on 6 Jul 2018
HAL is a multi-disciplinary open access
archive for the deposit and dissemination of
sci-entific research documents, whether they are
pub-lished or not. The documents may come from
teaching and research institutions in France or
L’archive ouverte pluridisciplinaire HAL, est
destinée au dépôt et à la diffusion de documents
scientifiques de niveau recherche, publiés ou non,
émanant des établissements d’enseignement et de
recherche français ou étrangers, des laboratoires
The layered evolution of fabric and microstructure of
snow at Point Barnola, Central East Antarctica
Neige Calonne, Maurine Montagnat, Margret Matzl, Martin Schneebeli
To cite this version:
Neige Calonne, Maurine Montagnat, Margret Matzl, Martin Schneebeli. The layered evolution of
fabric and microstructure of snow at Point Barnola, Central East Antarctica. Earth and Planetary
Science Letters, Elsevier, 2017, 460, pp.293-301. �10.1016/j.epsl.2016.11.041�. �hal-01832198�
The layered evolution of fabric and microstructure of snow at Point
Barnola, Central East Antarctica
Neige Calonnea,∗, Maurine Montagnatb, Margret Matzla, Martin Schneebelia
aWSL Institute for Snow and Avalanche Research SLF, Davos Dorf, Switzerland
bLaboratoire de Glaciologie et G´eophysique de l’Environnement, CNRS / Univ. Grenoble Alpes, Grenoble, France
Abstract
Snow fabric, defined as the distribution of the c-axis orientations of the ice crystals in snow, is poorly known. So far, only one study exits that measured snow fabric based on a statistically representative tech-nique. This recent study has revealed the impact of temperature gradient metamorphism on the evolution of fabric in natural snow, based on cold laboratory experiments. On polar ice sheets, snow properties are currently investigated regarding their strong variability in time and space, notably because of their potential influence on firn processes and consequently on ice core analysis. Here, we present measurements of fabric and microstructure of snow from Point Barnola, East Antarctica (close to Dome C). We analyzed a snow profile from 0 to 3 m depth, where temperature gradients occur. The main contributions of the paper are (1) a detailed characterization of snow in the upper meters of the ice sheet, especially by providing data on snow fabric, and (2) the study of a fundamental snow process, never observed up to now in a natural snowpack, namely the role of temperature gradient metamorphism on the evolution of the snow fabric. Snow samples were scanned by micro-tomography to measure continuous profiles of microstructural properties (density, specific surface area and pore thickness). Fabric analysis was performed using an automatic ice texture analyzer on 77 representative thin sections cut out from the samples. Different types of snow fabric could be identified and persist at depth. Snow fabric is significantly correlated with snow microstructure, pointing to the simultaneous influence of temperature gradient metamorphism on both properties. We propose a mechanism based on preferential grain growth to explain the fabric evolution under temperature gradients. Our work opens the question of how such a layered profile of fabric and microstructure evolves at depth and further influences the physical and mechanical properties of snow and firn. More generally, it opens the way to further studies on the influence of the snow fabric in snow processes related to anisotropic properties of ice such as grain growth, mechanical response, electromagnetic behavior.
Keywords: snow microstructure, c-axis orientation, temperature gradient metamorphism, Antarctica
1. Introduction
The ice crystal has various properties that depend on the crystallographic orientation. Snowflakes are the result of an enhanced growth rate along either the basal plane (plate crystal) or prismatic plane (column crystal), depending on the temperature conditions during growth (Furukawa, 2015). Non-basal deformation of ice crystals requires a stress at least 60 times larger than that for a basal slip at the same strain rate (Duval et al., 1983), showing an extreme mechanical anisotropy. Anisotropy also exists in the dielectric (Matsuoka et al., 1997) and light scattering (Takano and Liou, 1989) properties of ice. Snow on the ground is constituted of sintered single ice crystals that have each a distinct crystallographic orientation. We define snow fabric as the distribution of the c-axis orientations of ice crystals in snow, the c-axis orientation being the axis perpendicular to the basal plane. The question of how the distribution of crystal orientations in snow affects its physical and mechanical properties has never been truly addressed due to the lack of data on snow fabric itself.
de Quervain (1983) analyzed a few alpine snow samples that tend to show a preferential vertical orienta-tion of the c-axes in depth hoar, but data were too few to draw any definitive conclusions. From Antarctic snow, Stephenson and Lister (1959), Stephenson (1967), and Stephenson (1970) indicate that fabric may be affected by metamorphism, but again the interpretation is limited due to the low number of samples. Up to now, the only significant work on snow fabric is by Riche et al. (2013). Based on laboratory experiments, they showed that the snow fabric evolves during temperature gradient metamorphism.
Temperature gradient metamorphism has been widely investigated in terms of microstructure evolution (e.g. Pfeffer and Mrugala, 2002; Calonne et al., 2014a) and physical mechanisms involved (e.g. Kaempfer and Plapp, 2009; Calonne et al., 2014b, 2015). Temperature gradients in snow lead to re-crystallization of the ice structure (Pinzer et al., 2012) by sublimation of ice and deposition of water vapor coupled with heat and mass transport. The morphology evolves typically from new snow or rounded grains to faceted crystals and depth hoar.
More attention has been recently given to snow properties on polar ice sheets and how they might be transformed during burial and influence firn properties. Understanding firn processes is crucial to correctly interpret the Antarctic and Greenlandic ice cores in view of Earth’s climate history Alley (2014). Recent
studies showed that the layering of snow properties such as density (Mitchell et al., 2015) or microstructural properties (Gregory et al., 2014) influences firn densification and the close-off depth. Other properties such as snow impurity content (H¨orhold et al., 2012; Freitag et al., 2013) or snow fabric (Montagnat et al., 2012, 2014) have been suggested, but not deeply investigated up to now, partly because of the lack of data on surface snow properties.
This paper presents measurements of snow fabric and microstructure of a natural snowpack from Point Barnola, East Antarctica. We analyzed a snow profile from 0 to 3 m depth where temperature gradients occur. The vertically continuous measurement of the snow microstructure using micro-computed tomography (micro-CT) revealed complex layering, sometimes only a few millimeter thick. Within layers, we cut out horizontal thin sections and measured the fabric with an Automatic Ice Texture Analyzer. Different types of snow fabric could be identified and persist at depth. In the discussion part, we first present the possible depositional and post-depositional processes that might explain the observed snow stratigraphy. Secondly, we highlight the simultaneous impact of temperature gradient metamorphism on the fabric and microstructure of snow, and suggest a possible mechanism based on preferential grain growth to explain the fabric evolution. Finally, we discuss the potential influence of snow fabric on snow mechanical behavior and on the evolution of the snow and firn layering at depth.
2. Methods
2.1. Snow samples
Snow samples were collected in Central East Antarctica at Point Barnola (75o42’S, 123o15’E, 3236 masl),
located 66 km south from Concordia Station (Dome C) during the EXPLORE expedition in 2011-2012. At Concordia Station, which is the closest site to Point Barnola where climate conditions are recorded, the daily mean air temperature varies from about -80oC in winter to -25oC in summer (Stenni et al., 2016) and
the snow accumulation is about 25 kg m−2 yr−1 (Frezzotti et al., 2005; Urbini et al., 2008).
Three snow blocks, each 1 m heigh, 0.5 m thick and 0.5 m wide, were sampled from the surface to 3 m depth and transported to Davos in insulated boxes at -20oC. At 5 meters apart from this 3 m deep snow pit, a 1.2 m deep snow pit was also dug and snow samples were directly impregnated with diethyl phthalate (see subsection 2.3) to prevent any microstructural changes of the snow until analysis. In addition, a block of snow of 1 meter height was collected at a mega-dune site (78o18.7984’S, 110o34.322’E) located 430 km
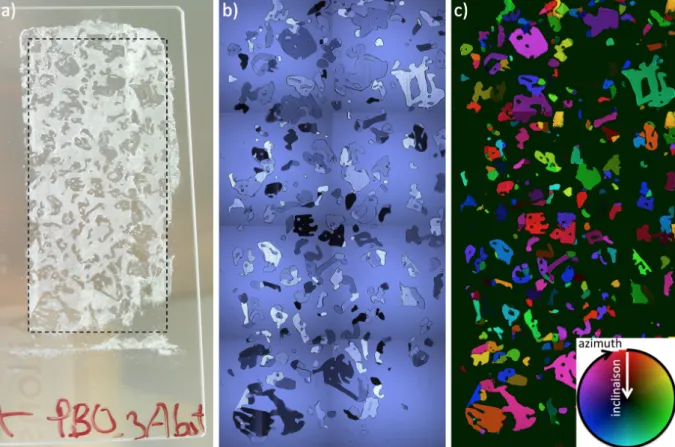
Figure 1: Steps to measure the c-axis orientation of ice crystals from a thin section. a) thin section of 100 µm thick glued on a glass plate seen by the naked eye and before dissolving the diethyl phthalate with tetralin; the ice crystals are transparent while the diethyl phthalate is opaque. b) the same section seen across polarized light after dissolving the diethyl phthalate; individual ice single crystals can already be identified by the nuance of colors. c) c-axes orientation map of the section obtained after processing; each color corresponds to a particular c-axis orientation given by the color loop; the pure black background correspond to the initial air pores in snow.
2.2. Computed tomography and microstructural parameters
The snow microstructure was studied based on 3-D images obtained by micro Computed Tomography (micro-CT). From each of the three blocks, cylindrical snow samples of 60 mm height and 36 mm diameter were cut out using a scroll saw in adjacent rows in the top 45 cm. Samples of 60 mm height and 50 mm diameter were cut out below 45 cm such as successive samples overlap vertically by about 30 mm. All samples were scanned with a micro-CT 80 (ScancoMedical) located in a cold-room at -15oC. The gray-scale
3-D images were reconstructed by a cone-beam algorithm, filtered by a Gaussian filter to remove the image noise, and binarised by visually determining the optimum threshold. Images have a nominal resolution of 18 µm for the samples collected above 0.45 m depth, where snow shows finer ice structures, and of 25 µm for the ones collected below. A total of 43 volumes showing the snow microstructure continuously from 0 to 2.9 m depth was obtained.
Snow density ρ (kg m−3), specific surface area SSA (m2kg−1), and mean pore thickness Th
p (mm) were
evaluated from the 3-D images using the Image Processing Language (ScancoMedical) (Thomsen et al., 2005). The mean pore thickness was determined by filling maximal spheres into the structure using the distance transform algorithm (Hildebrand et al., 1999). All the parameters were computed over sub-volumes of 1.8 mm height, 10.8 mm thickness and 10.8 mm width for the samples collected above 0.45 m depth, and of 3 mm height, 15 mm thickness and 15 mm width for the samples below 0.45 depth. We ensured that the dimension of the sub-volumes corresponded to the dimension of the representative elementary volume for the considered properties or were larger.
2.3. Thin sectioning and fabric analysis
Immediately after tomography each cylindrical sample was transferred in a plastic vial and impregnated with diethyl phthalate (CAS No. 84-66-2) in a cold room at -4oC (Heggli et al., 2009). This operation allows to obtain a sample that can not evolve anymore and that is solid for the thin sectioning required to extract the c-axis orientations.
The thin sections were cut out at -15oC from the impregnated snow samples using a band saw and then
microtomed with a Leica Polycut. All thin sections were cut parallel to the snow surface (perpendicular to gravity) and had a size of about 2×3 cm2 and a final thickness of 100-150 µm. In total, we cut out 77 thin
sections from the snow samples between 0 and 3 m depth. Before analysis, tetralin (CAS No. 119-64-2), a hydrocarbon in liquid state above -35oC, was used to liquefy the birefringent crystallized diethyl phthalate
contained in the thin section. This procedure does not modify relative grain positions, as verified by Riche et al. (2013). A picture of a typical thin section is shown in Figure 1a.
The fabric of each thin sections was determined using the G50 fabric analyzer (Russel-Head Instrument), an automated polarizing optical microscope (Peternell et al., 2011). The analyzer provides the c-axis ori-entation ck of every pixel k in the field of view of the microscope. In our case, a pixel has a size of 10×10
µm2 and the entire area of about 2×3 cm2 of the thin section was mapped. Each c-axis orientation ck is
defined in a spherical coordinate system by an inclination θk (angle in the vertical plane between 0-90o) and
an azimuth ϕk (angle in the horizontal plane between 0-360o) given in a local reference frame R, with the
third axis perpendicular to the thin section. The expression of ck in this reference frame is
ck = (cos ϕksin θk, sin ϕksin θk, cos θk) (1)
Only pixels with a quality factor higher than 70 were considered here (Peternell et al., 2011). For each thin section, we ensured that at least 100 snow crystals were analyzed to obtain a representative sample. An example of a c-axis orientation map is shown in Figure 1c.
To characterize the c-axis orientation distribution obtained over a thin section, we used the second order orientation tensor a(2) defined as (Durand et al., 2006)
a(2)= (1/Np) Np
X
k=1
ck⊗ ck (2)
where Np is the total number of pixels over which ck has been calculated, ck is given by Eq.(1), and ⊗
is the tensor product. By construction, a(2) is symmetric and a symmetry reference frame Rsym exists
in which a(2) is diagonal. Let a(2) 1 , a
(2) 2 , and a
(2)
3 denote the three corresponding eigenvalues that satisfy
1 > a(2)1 > a(2)2 > a(2)3 > 0 and a(2)1 + a(2)2 + a(2)3 = 1. These eigenvalues correspond to the length of the axes of the ellipsoid that fits best the distribution of the c-axis orientations. Three different types of fabric can be defined:
• Isotropic fabric: the c-axes are oriented randomly in all directions, a(2)1 ' a(2)2 ' a(2)3 ' 1/3.
• Girdle fabric: the c-axes are oriented randomly within a preferential plane, a(2)1 ' a(2)2 > 1/3. By looking at the Schmidt plots of the c-axis distribution obtained for snow in this study, we can already precise that the preferential plane for snow is the horizontal one.
• Cluster fabric: the c-axes are oriented toward one direction, a(2)2 ' a(2)3 < 1/3. Measurements show that this direction is the vertical one for snow.
We define the girdle index nG = ln(a (2) 2 /a
(2)
3 ) (the higher, the more girdle-type is the fabric) and the
cluster index nC= ln(a (2) 1 /a
(2)
2 ) (the higher, the more cluster-type is the fabric). The type of the fabric is
given by the shape index nshape= ln(a (2) 1 /a (2) 2 )/ ln(a (2) 2 /a (2)
3 ), which is lower than 1 for a girdle-type fabric
and larger than 1 for a cluster-type fabric, and the higher the index, the more pronounced the fabric shape. The strength of the fabric is defined by the strength index nstrength= ln(a
(2) 1 /a
(2)
3 ), which is 0 for a perfect
isotropic fabric and increases the more the fabric moves away from the isotropic-type, independently of the direction (toward the girdle- or the cluster-type). Illustrations of the above indexes can be found in Fisher et al. (1987) section 3.4.
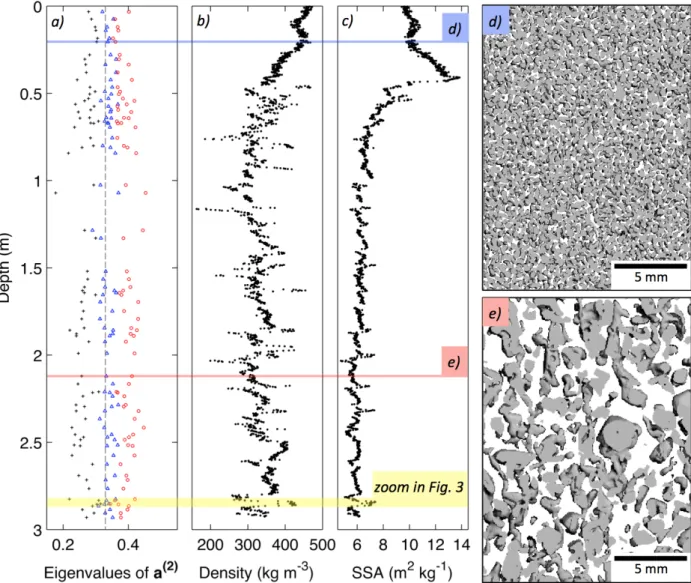
Figure 2: Evolution of the snow properties with depth for the snow profile at Point Barnola: a) eigenvalues of a(2)(black cross:
a(2)3 , blue triangle a(2)2 , red circle: a(2)1 , the dotted line indicates the 1/3 value), b) density, and c) specific surface area SSA. Vertical slices from the 3D images show the microstructure of d) rounded grains and e) large faceted grains.
3. Results
3.1. Microstructure and fabric of the snow profile
An overall picture of the microstructure along the 3 meter snow profile is given in Figure 2. 3-D images of the entire snow profile are in the supplementary material. Looking at the density and SSA evolution, the snowpack can be divided in two main parts. Above 0.45 meter, the snow properties develop gradually with depth, the density decreases from 460 to 350 kg m−1, while the SSA increases from 9.5 to 13.8 m2
kg−1. The snow consists only of small rounded grains, as illustrated in Fig. 2d). Below 0.45 m depth, the snowpack is strongly stratified and the properties change rapidly at transitions, sometimes within a 1 cm
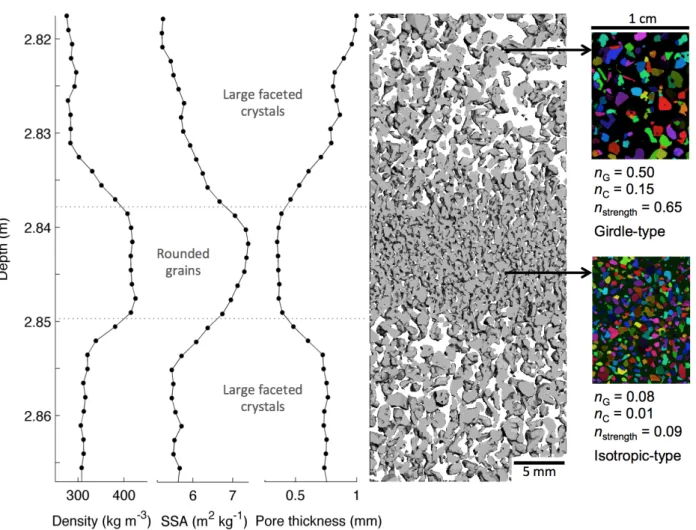
Figure 3: Snow microstructure and fabric for a sample collected between 2.82 and 2.86 m depth at Point Barnola. A vertical slice of the 3-D image is shown together with the evolution of the microstructural parameters. c-axis orientation maps from the top and middle part of the sample and fabric indexes are given.
thickness. In this part of the snowpack, the density fluctuates with depth between around 200 and 450 kg m−3. No significant linear correlation between density and depth is found (r = -0.22, p-value = 0.066). The SSA decreases with depth from around 10 to 5 m2 kg−1, showing a significant anti-correlation with
depth (r = -0.78, p-value < 0.0001). Within this main trend, small but abrupt variations of the SSA can be observed. The snowpack consists mainly of large faceted grains with some depth hoar-like structures, as shown in Fig. 2e), with thin layers of denser rounded grains in between. Figure 3 presents an example of such a stratification for a snow sample taken at 2.8 m depth. For this sample, the snow density evolves from around 300 kg m−1 in the large faceted grains layer at the top and bottom, up to 420 kg m−1 within the 1
cm layer of rounded smaller grains in the middle. The SSA increases from around 5.5 m2 kg−1 to 7.4 m2
kg−1, while the mean pore thickness decreases from around 0.80 mm to 0.35 mm.
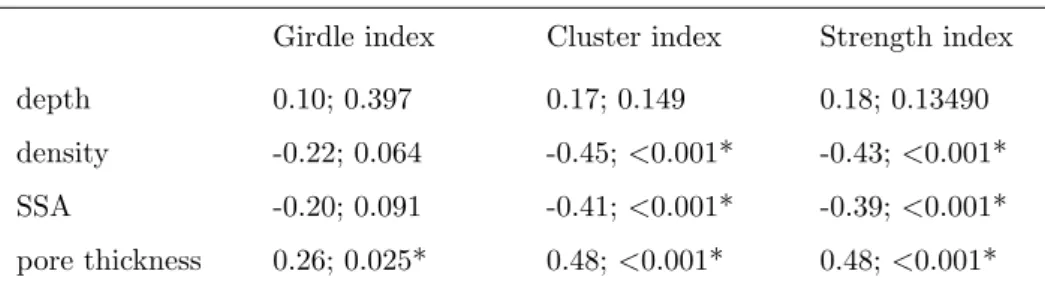
Table 1: Pearson correlation coefficients rpand p-values between fabric indexes and microstructural properties from the snow
samples collected between 0.45 and 2.9 m depth (permanent snowpack) at Point Barnola. Asterisks indicate a significant correlation (p-values < 0.05).
Correlation coefficient; p-value
Girdle index Cluster index Strength index depth 0.10; 0.397 0.17; 0.149 0.18; 0.13490 density -0.22; 0.064 -0.45; <0.001* -0.43; <0.001* SSA -0.20; 0.091 -0.41; <0.001* -0.39; <0.001* pore thickness 0.26; 0.025* 0.48; <0.001* 0.48; <0.001*
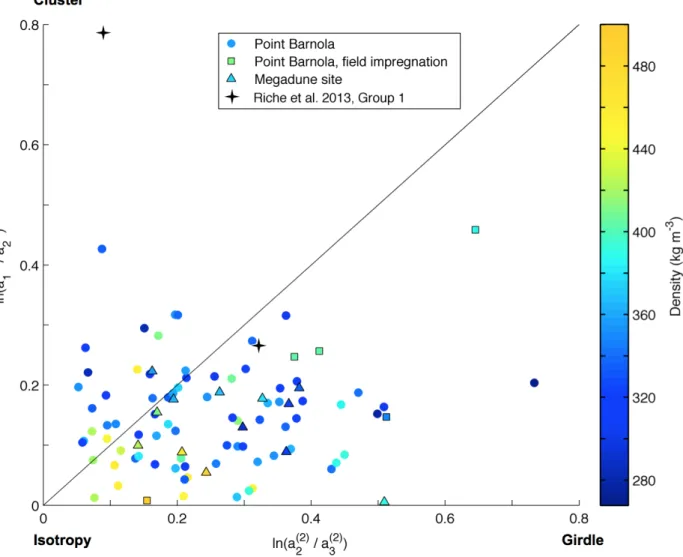
snow profile in Figure 2a). Type and strength of the snow fabric are better revealed in Figure 4 by plotting the cluster index against the girdle index. The 1:1 line represents the threshold between girdle and cluster fabric. The fabric type range between isotropic, weak cluster, and weak girdle. In average, the girdle-type prevails slightly, with an average shape index of 0.89. No significant correlations were found between the fabric indexes and depth (Tab. 1), showing that the fabric evolves independently of depth, in opposition with the common observations in firn and ice cores (e.g. Montagnat et al., 2012, 2014).
3.2. Relationship between fabric and microstructure
Figure 3 suggests a link between fabric and microstructure. The large faceted crystals at the top of the snow sample show a girdle-type fabric, with a girdle index of 0.50 and a strength index of 0.65. In contrast, the rounded grains of the middle layer have a strength index of 0.09 that characterizes an isotropic fabric.
This relationship is further investigated in Figure 4 and Table 1. Looking at the link with density first, we observe that denser snow shows a more isotropic fabric, while less dense snow tends to a slightly more anisotropic fabric, mainly toward the girdle-type fabric (Fig. 4). Density and strength index are indeed significantly anti-correlated: when density decreases, fabric become less isotropic (Tab. 1). The correlation of the strength index was also evaluated against SSA and mean air pore thickness, and is significant (Tab. 1). Snow samples with high SSA and small pores show preferentially an isotropic fabric, while snow samples with low SSA and large pores show a more pronounced fabric, either a weak girdle- or cluster-type fabric. This relationship is also indicated by the correlation between the cluster and girdle index and the microstructural properties. Note that the correlation of the girdle index with density and SSA is at the limit of the significance threshold of < 0.05.
The fabric described above from the main profile at Point Barnola are compared in Figure 4 to 13 snow samples from the mega-dune site (triangle symbols) and 5 snow samples from Point Barnola that were
Figure 4: Type and strength of the snow fabric for the Point Barnola samples (77 data, circles), the Point Barnola samples impregnated in the field (5 data, square), and the mega dune site samples (13 data, triangle). Density is given according to the color bar. Note that very well-expressed fabrics have values of ln(a1/a2) and ln(a2/a3) typically around 6 (Fisher et al., 1987)
Black star symbols correspond to the fabric measured by Riche et al. (2013) during a temperature gradient metamorphism at the beginning (cluster-type fabric) and end (weak girdle-type fabric) of the experiment using fresh initial snow (Group 1).
directly impregnated in the field (square symbols). A comparable evolution of the fabric with density is found.
4. Discussion
4.1. Understanding the snow stratigraphy
Point Barnola is a low snow accumulation site, close to Dome C (Concordia Station) where the average annual accumulation rate is about 25 kg m−2 yr−1. However, snow accumulation in this area is highly variable in space (Frezzotti et al., 2005; Urbini et al., 2008), notably due to wind effects such as drift (Libois
et al., 2014) and wind direction during snowfall (Urbini et al., 2008). The local accumulation and ablation can be several times higher than the average annual accumulation (Frezzotti et al., 2005), making hard to retrieve the snowpack history. By neglecting a potential accumulation hiatus, we can estimate that around 40 years of snow is preserved in the 2.8 meter long snow profile, based on the above accumulation rate and an average snow density of 350 kg m−3.
We suggest that the first rather homogeneous 45 cm of the snowpack is the remaining part of a single sastrugi that has been eroded and shows now a flat snow surface as observed during sampling. Such wind packed structures are built in winter and their height often exceeds the average annual accumulation (Gow, 1965). The decay process of sastrugi is not well established. A potential mechanism is the formation of horizontal temperature gradients due to the low sun angle and subsequent softening of snow by water vapor transport (Orheim, 1968), which can then be more easily eroded by wind. This first 45 cm dense layer illustrates the strong spatial redistribution of snow at the surface of the ice sheet, which leads here to a snow accumulation about 6 times higher than the annual accumulation (45 cm versus 7 cm). Within this layer, the SSA increases and the density decreases gradually with depth, in opposition with common observations. We believe that this layer is not representative of the ”steady state” snowpack and its characteristics are strongly related to surface processes. Understanding such processes is beyond the scope of this paper and would require a dedicated study.
Below 45 cm, the snowpack is finely stratified and shows layers as thin as 1 cm thick. The snow consists of thin layers of small rounded, slightly faceted, grains located in between layers of large faceted to depth hoar grains. The latter snow type corresponds to some degree to the “hard depth hoar” as described by Pfeffer and Mrugala (2002). Significant changes in density, SSA, and mean pore thickness were observed between these two types of layers. Similar features in the snow stratigraphy and in the density and SSA evolution have been reported at Dome C (e.g. France et al., 2011; Gallet et al., 2011). It is likely that the dense small grain layers originate from wind packed layers at the surface and might correspond to buried eroded sastrugi, as described above. The large faceted grain layers might originally be formed in an area in between sastrugi and be constituted by snow eroded from the sastrugi. Again, understanding such processes would require a dedicated study. The stratigraphy is however not only the result of surface processes but also of in-depth evolution processes. While compaction by overburden pressure seems to be quasi inactive, as the increase in density with depth is not significant (Section 3.1 and Fig. 2b), temperature gradient metamorphism plays an important role here.
un-derstand the stratification. It is especially important at low accumulation rate sites where snow is subjected to temperature gradients during a long period of time, here up to about 40 years. At Concordia Station, the snow temperature at 0.1 m depth varies between around -25oC in summer and -70oC in winter, while
at 5 m depth, temperatures are always around -55oC (Brucker et al., 2011). Between these two depths, a
macroscopic temperature gradient of 10 K m−1 is thus present and changes its direction from upward to downward seasonally. Locally, changes in snow density between layers induce changes in thermal conduc-tivity and consequently modifications of the temperature gradient at the layer scale (e.g. Calonne et al., 2011). At Point Barnola, the thermal conductivity of the faceted large grain layers is estimated at 0.18 W m−1K−1, while the one of the dense small grain layers is estimated at 0.41 W m−1K−1based on Calonne et al. (2011). The temperature gradient and thus the re-crystallization rate of the ice structure is thus sig-nificantly higher in the large faceted grain layers than in the dense small grains layers. We pointed out here a mechanism that enhances the initial differences between layers and reinforces the layering. Calonne et al. (2014a) described in detail snow metamorphism during a constant temperature gradient of 43 K m−1. The main features consist in the coarsening of grains and pores, no significant changes in density, faceting and striation of the grains (faceted crystals and depth hoar), together with the formation of vertically elongated snow structures. Despite the differences in temperature conditions, similar characteristic are shown in the large faceted grain layers at Point Barnola (Fig. 2e) and 3). The structural anisotropy index (vertical over horizontal), estimated for 31 representative samples based on the chord length distribution as described in Krol and L¨owe (2016), ranges from 1.04 to 1.21, with a mean value of 1.12 that indicates an overall slight preferential vertical direction of ice structures in snow. Note that no significant differences in structural anisotropy have been observed between the large faceted grain and the dense small grain layers.
4.2. Influence of temperature gradient metamorphism on snow fabric
The only available study of snow fabric evolution during temperature gradient is the recent cold lab-oratory work of Riche et al. (2013). The initial snow used for their experiments was fresh natural alpine snow with partly decomposed particles and showed a cluster-type fabric with c-axes preferentially oriented toward the vertical. After 3 months of evolution under a temperature gradient of 50 K m−1 at an absolute mean temperature of -20oC, the snow became depth hoar and showed a weak girdle-type fabric with most of
the c-axes oriented in the horizontal plane. The girdle and cluster index evolved from 0.09 and 0.79 at the beginning of their experiment, to 0.32 and 0.27 at the end, respectively, as shown and compared to our data in Fig. 4. The shape index reflects an evolution from a well-expressed cluster-type to a weak girdle-type fabric, with values evolving from 8.9 to 0.84. By performing the experiment with an initial snow 30% denser
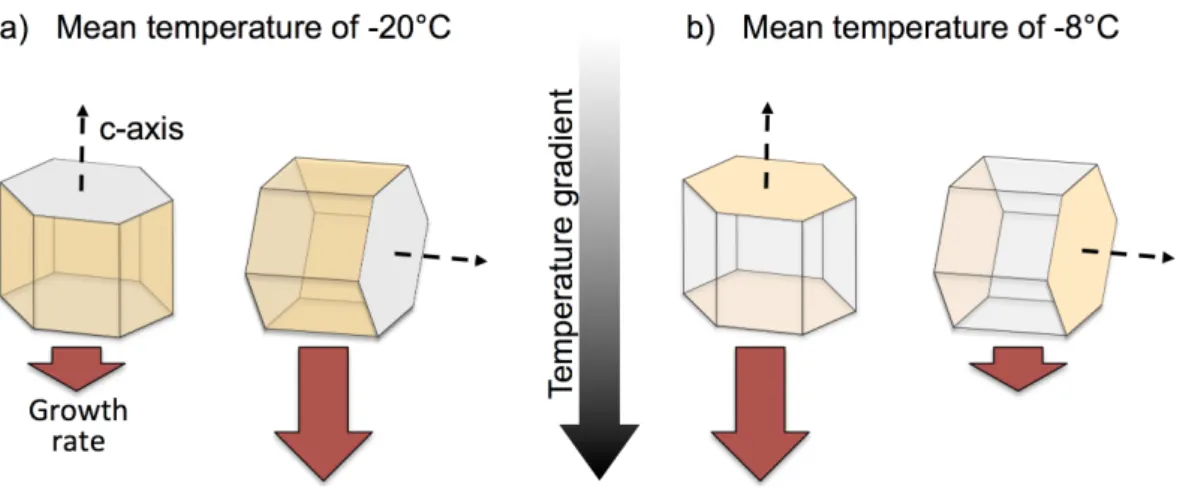
Figure 5: Schematic of the growth of a single ice crystal under a vertical temperature gradient at a mean temperature of a) -20oC and b) -8oC. The crystal faces that have an enhanced growth rate are shown in orange, based on the Nakaya diagram
(e.g. Furukawa, 2015). The larger the brown arrow, the higher the growth rate on the considered ice surface.
than the first one, no significant changes in the snow fabric were observed by Riche et al. (2013). During the metamorphism of 3 months duration, the snow grains underwent at least 11 complete re-crystallization cycles, i.e. the ice grains have been completely re-built at least 11 times, based on a turnover rate estimation (Pinzer et al., 2012).
Our results support the fact that both microstructure and fabric evolve during temperature gradient metamorphism, as shown by the significant correlation between both properties. Dense small grain lay-ers, subjected to a smaller temperature gradient and less affected by re-crystallization, show an isotropic fabric, while large faceted grain layers, subjected to a higher temperature gradient and more affected by re-crystallization, show a more anisotropic fabric, mainly of girdle-type. We made the same observation for a snow block sampled at the mega-dune site, suggesting that the influence of metamorphism is widespread on the Central East Antarctica plateau. We also observed this relationship for both techniques of trans-portation used, snow impregnated directly in the field and snow blocks not impregnated maintained at equi-temperature conditions at -20oC, excluding major changes during transport or preparation.
We interpret the evolution of snow fabric as a consequence of the favored growth of some ice grains at the expense of the other grains during temperature gradient metamorphism, following Adams and Miller (2003) and Riche et al. (2013). This preferential growth is driven by the combination of (1) the anisotropic growth properties of ice depending on the absolute temperature (Furukawa, 2015), which results in differences of growth and decay rate between the basal and prismatic faces of the ice crystals at a given temperature, and (2) the orientation of the ice crystals with respect to the temperature gradient direction (Adams and Miller, 2003), given that sublimation and condensation are mostly occurring on ice surfaces oriented perpendicularly
to the temperature gradient direction, i.e. perpendicularly to the vapor flux. Combining these two processes, we can define an optimum configuration for grain growth, when the grain configuration is such as the faces showing an enhanced growth rate are located perpendicularly to the temperature gradient, and, by opposition, less optimum growth configurations. Grains in optimum configuration will develop at the expense of the less optimum grains, and it will consequently impact the distribution of the crystal orientations in snow. This is supported by Riche et al. (2013) who showed that the number of crystals is decreasing during temperature gradient metamorphism, a process that seems to further enhance the survival of the faster growing crystals.
Figure 5 helps understanding the suggested process for the fabric evolution. Hexagonal ice crystals are displayed to easily identify the crystalline orientations, but could be replaced by any single crystal observed in snow. We describe here the example presented in Figure 5a of a vertical temperature gradient at an average temperature of -20oC. It is known that the growth rate at a temperature of -20oC is enhanced on
the prismatic faces compared to the basal faces of an ice crystal (e.g. Furukawa, 2015). Combining the two processes explained above, for the example at -20oC, the optimum growth configuration for an ice grain is
reached when its prismatic faces are oriented perpendicular to the temperature gradient direction, i.e. when its c-axis is oriented horizontally. The preferential growth of grains in the optimum configuration leads thus in this case to a snow fabric evolution toward a girdle-type.
The growth rate of ice crystals is enhanced on the prismatic faces between 0 and - 4oC, basal faces between
-4oC and -10oC, prismatic faces between -10oC and -22oC, and basal faces below -22oC (e.g. Furukawa, 2015).
Hence, we expect that when re-crystallization occurs in a snow layer at temperatures between 0 and - 4oC,
and between -10oC and -22oC, a girdle-type fabric will develop as illustrated in Figure 5a, while between
-4oC and -10oC, and below -22oC, a cluster-type fabric will be created, as illustrated in Figure 5b. The
alternation in preferential grain growth direction suggested here is supported by the result of Riche et al. (2013) who observed at an average temperature of -20oC the development of a weak girdle-type fabric (Fig. 4). At Point Barnola, metamorphism occurs at an average temperature of about -45oC, where a cluster-type fabric is supposed to develop following our reasoning. However, we measured snow fabrics that are in average slightly represented by a weak girdle-type fabric, although weak cluster-type fabrics are also observed (Fig. 4). The week anisotropy signal in the fabric at Point Barnola limits further interpretation. We also point out that the relationship between temperature, water vapor saturation, and growth rate has been shown for temperatures down to -40oC but not below (Libbrecht, 2003), as far as we know. Our fabric observations
highlight the need of cold-laboratory experiments, under well controlled conditions, to better understand the preferential growth process in snow and the fabric evolution under temperature gradients.
4.3. On the potential influence of snow fabric at depth in polar ice sheets
Understanding firn densification is crucial to interpret the Antarctic and Greenland ice cores in view of Earth’s climate history (e.g. Alley, 2014). Most of the firn densification models simulate only mean density evolution with depth, ignoring firn stratification and so variations in firn physical properties. However, recent works emphasize the influence of the layered snow properties, such as density (H¨orhold et al., 2011; Mitchell et al., 2015), microstructure (Gregory et al., 2014; Fujita et al., 2016), impurity content (H¨orhold et al., 2012; Freitag et al., 2013; Fujita et al., 2016), or snow fabric (Montagnat et al., 2012, 2014) on firn behavior and close-off depth. Concerning the latter property, close to perfect topographical domes, fabrics along firn and ice cores evolve generally with depth toward very well expressed cluster-type (e.g. Alley, 1988), by dislocation creep deformation and dynamic recrystallization (De La Chapelle et al., 1998) due to the overburden pressure reached at these depths. Nevertheless, Montagnat et al. (2014) observed slightly clustered fabrics in the NEEM firn core (Greenland) that could not be explained by the low level of strain reached at these depths, based on modeling estimations (Montagnat et al., 2012). This observation would be in favor of some fabric evolution in snow or firn, not entirely controlled by creep deformation.
Snow is a porous material and its mechanical response is known to depend strongly on its density and microstructure. Although most of the mechanical simulations and physical models of compaction of low density snow are based on the hypothesis of a strong impact of grain re-arrangement by grain boundary sliding (e.g. Arnaud et al., 1998; Johnson and Hopkins, 2005), recent studies suggest that intragranular viscoplastic deformation could also play an important role (Rolland du Roscoat et al., 2011; Theile et al., 2011). Furthermore, these studies suggest that the crystal orientation, owing to the strong viscoplastic anisotropy of ice, would come into play in the mechanical response of snow close to the surface (Theile et al., 2011).
Such recent results combined with our measurements of fabric in natural snowpacks suggest that the snow fabric, whose layering follows the microstructure layering, might have to be considered to better understand snow and firn properties deeper at depth. Fabric evolution could be viewed as an additional parameter to better constrain the physical models of snow and firn layering evolution. Our study should be followed by high resolution measurements of the fabric along cores covering the transition between snow and firn, to investigate the fabric evolution under an increasing pressure.
5. Conclusion
This study presents for the first time a joint analysis of the preferred crystallographic orientation (fabric) and microstructure of Antarctic snow. Different types of fabric are revealed in the upper 3 m of the snowpack in clear correlation with the layering of the microstructure. Randomly orientated c-axes were observed in the denser layers of rounded grains, while a slight preferential orientation in the horizontal plane (girdle-type fabric) was mainly observed in the large faceted grain layers.
We highlighted that the variations measured in snow fabric and microstructure are not a function of depth, as observed along firn and ice cores, but are the result of temperature gradient metamorphism. We presented a preferential crystal growth mechanism to explain the fabric evolution under temperature gradients.
Our work showed that not only changes in microstructure but also changes in fabric characterize the natural snowpacks. This leads to the question of how such layered properties are modified during burial and how they might interact with firn densification down to the close-off depth. More generally, our work opens the way to further studies on the influence of the fabric in snow processes related to anisotropic ice properties such as mechanical response, optic or dielectric macroscopic behavior.
Authors contributions
M. Schneebeli collected the snow samples and managed the project. M. Montagnat and N. Calonne performed the fabric measurements and M. Matzl performed the micro-CT measurements. N. Calonne analyzed the data and prepared the manuscript with input from M. Montagnat and M. Schneebeli.
Acknowledgment
We greatly thank an anonymous reviewer for his/her interesting comments and constructive review that contribute to improve the manuscript. M. Schneebeli thanks Michel Fily, Jerome Chappellaz and the EXPLORE team for the excellent support. N. Calonne was supported by grant 152845 from the Swiss National Science Foundation, M. Schneebeli by the French Agence Nationale de la Recherche (ANR) project DOME A (ANR-07-BLAN-0125) and by the French polar research institute IPEV (EXPLORE project 1052). M. Montagnat is supported the French CNRS (Centre National de la Recherche Scientifique), institutes INSIS (Institut des Sciences de l’Ingenierie et des Systemes) and INSU (Institut National des Sciences de l’Univers). We acknowledge the European Science Foundation (ESF) for travel grant supports in the frame of the RNP Micro-DICE.
References
Adams, E.E., Miller, D.A., 2003. Ice crystals grown from vapor onto an orientated substrate: application to snow depth-hoar development and gas inclusions in lake ice. Journal of Glaciology 49, 8–12.
Alley, R.B., 1988. Fabrics in polar ice sheets: Development and. Science 240, 493–495.
Alley, R.B., 2014. The two-mile time machine: ice cores, abrupt climate change, and our future. Princeton University Press. Arnaud, L., a. Lipenkov, V.Y., Bamola, J., Gay, M.A., Duvalfur, P., 1998. Modeling of the densification of polar firn
charac-terization of the snow-firn transition. Annals of Glaciology 26, 39–44.
Brucker, L., Picard, G., Arnaud, L., Barnola, J.M., Schneebeli, M., Brunjail, H., Lefebvre, E., Fily, M., 2011. Modeling time series of microwave brightness temperature at Dome C, Antarctica, using vertically resolved snow temperature and microstructure measurements. J. Glaciol. 57 (201), 171 – 182.
Calonne, N., Flin, F., Geindreau, C., Lesaffre, B., Rolland du Roscoat, S., 2014a. Study of a temperature gradient metamor-phism of snow from 3-D images: time evolution of microstructures, physical properties and their associated anisotropy. The Cryosphere 8, 2255–2274. doi:10.5194/tc-8-2255-2014.
Calonne, N., Flin, F., Morin, S., Lesaffre, B., du Roscoat, S.R., Geindreau, C., 2011. Numerical and experimental investigations of the effective thermal conductivity of snow. Geophysical Research Letters 38, L23501. doi:10.1029/2011GL049234. Calonne, N., Geindreau, C., Flin, F., 2014b. Macroscopic modeling for heat and water vapor transfer in dry snow by
homoge-nization. The Journal of Physical Chemistry B doi:10.1021/jp5052535.
Calonne, N., Geindreau, C., Flin, F., 2015. Macroscopic modeling of heat and water vapor transfer with phase change in dry snow based on an upscaling method: Influence of air convection. Journal of Geophysical Research: Earth Surface 120, 2476–2497. doi:10.1002/2015jf003605.
De La Chapelle, S., Castelnau, O., Lipenkov, V., Duval, P., 1998. Dynamic recrystallization and texture development in ice as revealed by the study of deep ice cores in antarctica and greenland. Journal of Geophysical Research 103, 5091–5105. Durand, G., Gagliardini, O., Thorsteinsson, T., Svensson, A., Kipfstuhl, S., Dahl-Jensen, D., 2006. Ice microstructure and
fabric: an up-to-date approach for measuring textures. Journal of Glaciology 52, 619–630.
Duval, P., Ashby, M., Anderman, I., 1983. Rate-controlling processes in the creep of polycrystalline ice. The Journal of Physical Chemistry 87, 4066–4074.
Fisher, N.I., Lewis, T., Embleton, B.J., 1987. Statistical analysis of spherical data. Cambridge University Press.
France, J., King, M., Frey, M., Erbland, J., Picard, G., Preunkert, S., MacArthur, A., Savarino, J., 2011. Snow optical properties at dome c (concordia), antarctica; implications for snow emissions and snow chemistry of reactive nitrogen. Atmospheric Chemistry and Physics 11, 9787–9801.
Freitag, J., Kipfstuhl, S., Laepple, T., Wilhelms, F., 2013. Impurity-controlled densification: a new model for stratified polar firn. Journal of Glaciology 59, 1163–1169.
Frezzotti, M., Pourchet, M., Flora, O., Gandolfi, S., Gay, M., Urbini, S., Vincent, C., Becagli, S., Gragnani, R., Proposito, M., et al., 2005. Spatial and temporal variability of snow accumulation in east antarctica from traverse data. Journal of Glaciology 51, 113–124.
Fujita, S., Goto-Azuma, K., Hirabayashi, M., Hori, A., Iizuka, Y., Motizuki, Y., Motoyama, H., Takahashi, K., 2016. Densifi-cation of layered firn in the ice sheet at dome fuji, antarctica. Journal of Glaciology 62, 103–123.
Furukawa, Y., 2015. Handbook of Crystal Growth: Fundamentals. second edition 2015 ed.. Elsevier. volume Vol. I.. chapter Snow and ice crystal growth. pp. 1061–1108. ISBN: 9780444563699.
Gallet, J.C., Domine, F., Arnaud, L., Picard, G., Savarino, J., 2011. Vertical profile of the specific surface area and density of the snow at dome c and on a transect to dumont d’urville, antarctica - albedo calculations and comparison to remote sensing products. The Cryosphere 5, 631–649. doi:doi:10.5194/tc-5-631-2011.
Gow, A.J., 1965. On the accumulation and seasonal stratification of snow at the south pole. Journal of Glaciology 5, 467–477. Gregory, S., Albert, M., Baker, I., 2014. Impact of physical properties and accumulation rate on pore close-off in layered firn.
The Cryosphere 8, 91–105.
Heggli, M., Frei, E., Schneebeli, M., 2009. Snow replica method for three-dimensional X-ray microtomographic imaging. Journal of Glaciology 55, 631–639.
Hildebrand, T., Laib, A., M¨uller, R., Dequeker, J., R¨uegsegger, 1999. Direct three-dimensional morphometric analysis of human cancellous bone: microstructural data from spine, femur, iliac crest, and calcaneus. Journal of Bone and Mineral Research 14, 1167–1174.
H¨orhold, M., Kipfstuhl, S., Wilhelms, F., Freitag, J., Frenzel, A., 2011. The densification of layered polar firn. Journal of Geophysical Research: Earth Surface 116.
H¨orhold, M., Laepple, T., Freitag, J., Bigler, M., Fischer, H., Kipfstuhl, S., 2012. On the impact of impurities on the densification of polar firn. Earth and Planetary Science Letters 325, 93–99.
Johnson, J.B., Hopkins, M.A., 2005. Identifying microstructural deformation mechanisms in snow using discrete-element modeling. J. Glaciol. 51, 432–442.
Kaempfer, T.U., Plapp, M., 2009. Phase-field modeling of dry snow metamorphism. Phys. Rev. E 79, 031502. doi:10.1103/PhysRevE.79.031502.
Krol, Q., L¨owe, H., 2016. Relating optical and microwave grain metrics of snow: The relevance of grain shape. The Cryosphere Discusssion doi:doi:10.5194/tc-2016-119.
Libbrecht, K.G., 2003. Growth rates of the principal facet of ice between -10◦C and -40◦C. Journal of Crystal Growth 247,
530. (10.1016/S0022-0248(02)01996-6).
Libois, Q., Picard, G., Arnaud, L., Morin, S., Brun, E., 2014. Modeling the impact of snow drift on the decameter-scale variability of snow properties on the antarctic plateau. Journal of Geophysical Research: Atmospheres 119.
Matsuoka, T., Fujita, S., Morishima, S., Mae, S., 1997. Precise measurement of dielectric anisotropy in ice ih at 39 ghz. Journal of Applied Physics 81, 2344–2348.
Mitchell, L.E., Buizert, C., Brook, E.J., Breton, D.J., Fegyveresi, J., Baggenstos, D., Orsi, A., Severinghaus, J., Alley, R.B., Albert, M., et al., 2015. Observing and modeling the influence of layering on bubble trapping in polar firn. Journal of Geophysical Research: Atmospheres 120, 2558–2574.
Montagnat, M., Azuma, N., Dahl-Jensen, D., Eichler, J., Fujita, S., Gillet-Chaulet, F., Kipfstuhl, S., Samyn, D., Svensson, A., Weikusat, I., 2014. Fabric along the neem ice core, greenland, and its comparison with GRIP and NGRIP ice cores. The Cryosphere 8, 1129–1138. doi:10.5194/tc-8-1129-2014.
Montagnat, M., Buiron, D., Arnaud, L., Broquet, A., Schlitz, P., Jacob, R., Kipfstuhl, S., 2012. Measurements and numerical simulation of fabric evolution along the Talos Dome ice core, Antarctica. Earth and Planetary Science Letters 357, 168–178. Orheim, O., 1968. Surface snow metamorphosis on the antarctic plateau. Norks Polarinstitutt, Arbok 1966 , 84–91.
Peternell, M., Russell-Head, D., Wilson, C., 2011. A technique for recording polycrystalline structure and orientation during in situ deformation cycles of rock analogues using an automated fabric analyser. Journal of Microscopy 242, 181–188. Pfeffer, W.T., Mrugala, R., 2002. Temperature gradient and initial snow density as controlling factors in the formation and
structure of hard depth hoar. Journal of Glaciology 48, 485–494.
Pinzer, B., Schneebeli, M., Kaempfer, T., 2012. Vapor flux and recrystallization during dry snow metamorphism under a steady temperature gradient as observed by time-lapse micro-tomography. The Cryosphere 6, 1141–1155.
de Quervain, M.R., 1983. The institute for snow and avalanche research at weissfluhjoch/davos: the first five years (1943 to 1948). Annals of Glaciology 4, 307–314.
Riche, F., Montagnat, M., Scheebeli, M., 2013. Evolution of crystal orientation in snow during temperature gradient metamor-phism. Journal of Glaciology 59, 213. doi:10.3189/2013JoG12J116.
Rolland du Roscoat, S., King, A., Philip, A., Reischig, P., Ludwig, W., Flin, F., Meyssonnier, J., 2011. Analysis of snow microstructure by means of x-ray diffraction contrast tomography. Advanced Engineering Materials 13, 128–135. URL: http://dx.doi.org/10.1002/adem.201000221, doi:10.1002/adem.201000221.
Stenni, B., Scarchilli, C., Masson-Delmotte, V., Schlosser, E., Ciardini, V., Dreossi, G., Grigioni, P., Bonazza, M., Cagnati, A., Karlicek, D., et al., 2016. Three-year monitoring of stable isotopes of precipitation at concordia station, east antarctica. The Cryosphere 10, 2415.
Stephenson, P., 1967. Some considerations of snow metamorphism in the antarctic ice sheet in the light of ice crystal studies. Physics of Snow and Ice: proceedings 1, 725–740.
Stephenson, P., 1970. Some aspects of shallow snow metamorphism at Southice, Antarctica, in: Proceedings of the Interna-tional Symposium on Antarctic Glaciological Exploration (ISAGE) AJ Gow, others InternaInterna-tional Association of Scientific Hydrology, Gentbrugge, Belgium.
Stephenson, P., Lister, H., 1959. Preliminary results of the glaciological work on the trans-antarctic expedition, 1955-58. Journal of Glaciology 3, 426–431.
Takano, Y., Liou, K.N., 1989. Solar radiative transfer in cirrus clouds. part ii: Theory and computation of multiple scattering in an anisotropic medium. Journal of the atmospheric sciences 46, 20–36.
Theile, T., L¨owe, H., Theile, T., Schneebeli, M., 2011. Simulating creep of snow based on microstructure and the anisotropic deformation of ice. Acta Materialia 59, 7104–7113.
Thomsen, J.S., Laib, A., Koller, B., Prohaska, S., Mosekilde, L., Gowin, W., 2005. Stereological measures of trabecular bone structure: comparison of 3d micro computed tomography with 2d histological sections in human proximal tibial bone biopsies. Journal of Microscopy 218, 171–179.
Urbini, S., Frezzotti, M., Gandolfi, S., Vincent, C., Scarchilli, C., Vittuari, L., Fily, M., 2008. Historical behaviour of dome c and talos dome (east antarctica) as investigated by snow accumulation and ice velocity measurements. Global and Planetary Change 60, 576–588.