HAL Id: insu-02082924
https://hal-insu.archives-ouvertes.fr/insu-02082924
Submitted on 28 Mar 2019
HAL is a multi-disciplinary open access archive for the deposit and dissemination of sci-entific research documents, whether they are pub-lished or not. The documents may come from teaching and research institutions in France or
L’archive ouverte pluridisciplinaire HAL, est destinée au dépôt et à la diffusion de documents scientifiques de niveau recherche, publiés ou non, émanant des établissements d’enseignement et de recherche français ou étrangers, des laboratoires
organic carbon
Jonas Schaper, Malte Posselt, Camille Bouchez, Anna Jaeger, Gunnar
Nuetzmann, Anke Putschew, Gabriel Singer, Jörg Lewandowski
To cite this version:
Jonas Schaper, Malte Posselt, Camille Bouchez, Anna Jaeger, Gunnar Nuetzmann, et al.. Fate of trace organic compounds in the hyporheic zone: influence of retardation, the benthic bio-layer and organic carbon. Environmental Science and Technology, American Chemical Society, 2019, 53 (8), pp.4224-4234. �10.1021/acs.est.8b06231�. �insu-02082924�
influence of retardation, the benthic bio-layer and organic carbon
Jonas Schaper, Malte Posselt, Camille Bouchez, Anna Jaeger, GunnarNützmann, Anke Putschew, Gabriel Singer, and Jörg Lewandowski
Environ. Sci. Technol., Just Accepted Manuscript • Publication Date (Web): 24 Mar 2019
Downloaded from http://pubs.acs.org on March 28, 2019
Just Accepted
“Just Accepted” manuscripts have been peer-reviewed and accepted for publication. They are posted online prior to technical editing, formatting for publication and author proofing. The American Chemical Society provides “Just Accepted” as a service to the research community to expedite the dissemination of scientific material as soon as possible after acceptance. “Just Accepted” manuscripts appear in full in PDF format accompanied by an HTML abstract. “Just Accepted” manuscripts have been fully peer reviewed, but should not be considered the official version of record. They are citable by the Digital Object Identifier (DOI®). “Just Accepted” is an optional service offered to authors. Therefore, the “Just Accepted” Web site may not include all articles that will be published in the journal. After a manuscript is technically edited and formatted, it will be removed from the “Just Accepted” Web site and published as an ASAP article. Note that technical editing may introduce minor changes to the manuscript text and/or graphics which could affect content, and all legal disclaimers and ethical guidelines that apply to the journal pertain. ACS cannot be held responsible for errors or consequences arising from the use of information contained in these “Just Accepted” manuscripts.
1
Fate of trace organic compounds in the hyporheic zone: influence of
2
retardation, the benthic bio-layer and organic carbon
3 JONAS L. SCHAPER1,2*, MALTE POSSELT,3 CAMILLE BOUCHEZ,4 ANNA JAEGER,1,5 GUNNAR
4 NUETZMANN,1,5ANKE PUTSCHEW,2GABRIEL SINGER,1 AND JOERG LEWANDOWSKI1,5
5 1 Leibniz-Institute of Freshwater Ecology and Inland Fisheries, Department Ecohydrology, Müggelseedamm 310, 6 12587 Berlin, Germany
7 2 Technische Universität Berlin, Chair of Water Quality Engineering, Strasse des 17. Juni 135, 10623 Berlin,
8 Germany
9 3 Department of Environmental Science and Analytical Chemistry (ACES), Stockholm University, Stockholm,
10 Sweden
11 4 Univ Rennes, CNRS, Géosciences Rennes, UMR 6118, 35000 Rennes, France
12 5 Humboldt University Berlin, Geography Department, Rudower Chaussee 16, 12489 Berlin, Germany 13
14
15 *corresponding author; schaper@igb-berlin.de, Leibniz-Institute of Freshwater Ecology and Inland Fisheries, 16 Department Ecohydrology, Müggelseedamm 310, 12587 Berlin, Germany
18
Abstract
19 The fate of 28 trace organic compounds (TrOCs) was investigated in the hyporheic zone (HZ) of an urban
20 lowland river in Berlin, Germany. Water samples were collected hourly over 17 h in the river and in three
21 depths in the HZ using minipoint samplers. The four relatively variable time series were subsequently
22 used to calculate first-order removal rates and retardation coefficients via a one-dimensional reactive
23 transport model. Reversible sorption processes led to substantial retardation of many TrOCs along the
24 investigated hyporheic flow path. Some TrOCs such as dihydroxy-carbamazepine,
O-25 desmethylvenlafaxine and venlafaxine were found to be stable in the HZ. Others were readily removed
26 with half-lives in the first 10 cm of the HZ ranging from 0.1±0.01 h for iopromide to 3.3±0.3 h for
27 tramadol. Removal rate constants of the majority of reactive TrOCs were highest in the first 10 cm of the
28 HZ, where removal of biodegradable dissolved organic matter was also highest. Because conditions were
29 oxic along the top 30 cm of the investigated flow path we attribute this finding to the high microbial
30 activity typically associated with the shallow HZ. Frequent and short vertical hyporheic exchange flows
32
Keywords
33 Pharmaceuticals, metformin, guanylurea, urban water cycle, reactive transport modeling
34
TOC Art
36
Introduction
37 Many trace organic compounds such as pharmaceuticals are only partially retained in wastewater
38 treatment plants (WWTPs)1,2 and thus are ubiquitous in urban surface waters.3,4 In rivers, TrOCs are of
39 eco-toxicological concern5–7 and the high persistence of some TrOCs in aquatic environments poses issues
40 for drinking water production.8 The hyporheic zone (HZ), the portion of the streambed in which surface
41 waters and groundwater mix,9 is generally regarded as an effective bioreactor, characterized by steep
42 redox gradients, diverse microbial communities and relatively high microbial turnover rates.10,11 Both
43 laboratory12,13 and field studies14,15 demonstrated that the HZ is able to efficiently remove many TrOCs,
44 even along relatively short flow paths (< 20 cm). Therefore, the HZ may not only act as a filter protecting
45 groundwater form surface water contamination16 but also contributes to whole-stream, i.e. reach-scale
46 attenuation of TrOCs.17
47 The adequate assessment of the in-situ efficiency of the HZ in removing TrOCs requires a sound
48 understanding of both the in-situ reactivity and the exposure time of TrOCs to favorable attenuation
49 conditions. Hyporheic residence times are predominately controlled by transport characteristics such as
50 porewater velocity and dispersion. However, residence times of TrOCs along hyporheic flow paths may
51 also be influenced by sorption and desorption processes, i.e. retardation.18–20 Retardation can extend
52 residence times of TrOCs in the HZ and, if not considered in reactive transport modeling, may lead to an
53 overestimation of the in-situ reactivity of TrOCs in the HZ. Although retardation of some TrOCs in 54 saturated sediments has been demonstrated in laboratory studies20,21 little is known about its driving
55 factors and its overall importance for transport of TrOCs in hyporheic sediments.
56 Reactivity of TrOCs in the HZ increases with temperature12 and, for many TrOCs, is higher under oxic
57 conditions.12,14 However, since microbially mediated degradation and transformation mechanisms are
58 considered to be a main driver of TrOC removal in saturated sediments, it is likely that TrOC reactivity in
59 the HZ is also linked to microbial activity and growth and therefore to turnover of biodegradable dissolved
61 shallow HZ (within the so called benthic bio-layer), where BDOC availability is highest and redox
62 conditions are rather oxic.10,23,24 It is therefore reasonable to assume that removal rates of TrOCs may vary
63 substantially along hyporheic flow paths, even if redox conditions are relatively similar. In previous
64 investigations on the fate of TrOCs in the HZ, neither retardation nor the effect of benthic bio-layers and
65 depth-dependent transport characteristics on the fate of TrOCs has been considered.14,15,25 In addition,
66 previous studies have mainly investigated the fate of parent TrOCs in the HZ,14,15,25 while information on
67 the fate of transformation products (TPs) such as guanylurea, the main TP of the antidiabetic drug
68 metformin, valsartan acid, the main TP of compounds of the sartan group, or gabapentin-lactam a main TP
69 of the anticonvulsant gabapentin in the HZ is widely lacking.
70 The objectives of the present study were to use concentration time series of TrOCs and conservative 71 tracers sampled along a 40 cm long hyporheic flow path to calculate depth-dependent in-situ retardation
72 coefficients and first-order removal rate constants of 28 TrOCs, including 7 transformation products, in
73 the HZ of an urban lowland river in Berlin, Germany. We hypothesize that hyporheic reactivities of
74 TrOCs are highest in the shallow HZ, where redox conditions are rather oxic and microbial activity is
75 highest. We further anticipate that many TrOCs are retarded along hyporheic flow paths, which notably
77
2. Methods
78 2.1 Site description and experimental overview
79 River Erpe, an urban lowland river located east of Berlin, Germany, receives 60% to 80% of its discharge
80 from the municipal WWTP Münchehofe. The present study was conducted at Heidemühle (Lat:
81 52.478647, Long: 13.635146), a section of River Erpe that has been subject to previous investigations on
82 the fate of TrOCs in the HZ due to its sandy streambed sediments.14,15,26 Sediment characteristics at the
83 sampling site were determined from one 40 cm long sediment core which was taken using a hand auger
84 (inner diameter 9 cm) in close proximity of the sampling site (< 10 cm) and cut into 8 cm long sections,
85 which were transferred into 5 KSAT rings (Meter, Germany) on site. Saturated hydraulic conductivity at
86 25 °C was measured using a KSAT device (Meter, Germany) and ranged between 1.6 x 10⁻⁵ m s-1 and 1.7
87 x 10-4 m s-1. Porosity, determined from oven dried (105 °C, 48h) samples, decreased from 0.5 in the upper
88 8 cm of the HZ to 0.4 in the last 2 sub-cores (i.e. 24-40 cm depth).
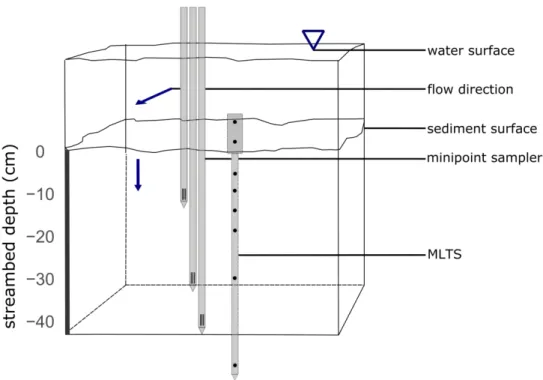
89 The experimental setup consisted of three self-constructed mini-point samplers26 (compare section 2.2)
90 that were installed in the HZ in 10, 30 and 40 cm depth (Figure 1). An additional mini-point sampler was
91 installed in the HZ in 20 cm depth. However, due to clogging, the sampler in 20 cm depth provided only a
92 limited number of samples and was thus excluded from further analysis. To gain additional information on
93 the hydrological conditions at the study site and to cross-check porewater velocities determined by
94 conservative transport modeling (section 2.5), porewater velocities were additionally calculated from 95 temperature time series in the HZ. To this end, a Multi-Level Temperature Stick27 (MLTS, UIT, Dresden)
96 was installed adjacent to the minipoint samplers (≈10 cm). Temperature time series were collected over
97 the course of two weeks (14.06.-28.06.2016) in 5, 10, 15, 20, 30 and 50 cm depth in the HZ.
98 Subsequently, vertical seepage fluxes and thermal dispersion coefficients were evaluated via the
99 McCallum method28 incorporated in the VFLUX 2.0 program.29 The McCallum method simultaneously
100 uses phase shifts (Δφ) and amplitude damping ratios (Ar) of two sinusoidal temperature time series to
one-102 dimensional heat transport equation. In VFLUX, dynamic harmonic regression,30 a form of harmonic
103 regression in which the spectral coefficients describing a periodic signal can be non-stationary, is used to
104 estimate phase and amplitude information from the measured time series. Vertical seepage fluxes and
105 thermal dispersion coefficients were calculated from measured temperature time series in 5 and 10 cm, 10
106 and 30 cm and 20 and 50 cm depth in the HZ, yielding parameter estimates at center-of-pair depths of 7.5
107 cm, 20 cm and 35 cm, respectively, covering the three different model sections in the HZ (compare
108 section 2.5). Further details on the method and its underlying assumptions can be found elsewhere14,26 and
109 in the Supporting Information (SI, section SI-01).
110
111 Figure 1 Experimental setup showing the three minipoint sampler installed in 10 cm, 30 cm and 40 cm depth in the hyporheic 112 zone (HZ). The samplers were installed in a line (< 1 cm distance) perpendicular to the water flow direction. A Multilevel
113 Temperature Stick (MLTS) was installed in close proximity (≈ 10 cm) next to the minipoint sampler array. Blue arrows indicate
114 surface water and predominant hyporheic flow directions. Minipoint samplers were sampled from an aluminum bridge spanning
115 the river channel (not shown).
117 2.2 Water sampling
118 Hyporheic porewater samples were collected hourly between 22:30 on June, 15th and 15:30 on June 16th
119 2016 using self-constructed mini-point samplers.26 In brief, the mini-points consisted of HPLC tubes
120 (PEEK, ID 0.03 inch, Sigma Aldrich, USA) that were inserted into 1.5 m long stainless steel tubes (ID 0.7
121 mm). At the tip of the steel tubes, four 1-cm long laser cut slits (< 0.1 mm) allowed water flow but acted
122 as a filter screen for most sediment particles. The HPLC tubes were connected to a syringe pump
(NE-123 1600 New Era Pump Systems, Inc, Farmingdale, USA) via Swagelok fittings (Swagelok, USA) to allow
124 slow, constant pumping of hyporheic porewater. Thirteen ml of hyporheic porewater were sampled
125 applying a constant sampling rate of 1 ml min-1. In previous investigations conducted at the same site
126 pumping rates of 1 ml min-1 have been found to be sufficiently low to maintain the integrity of the
127 hyporheic flow field.26 Electrical conductivity (EC) was measured in each sample and in the surface water
128 using handheld EC meters (GMH 3431, Greisinger, Germany). Every four hours, pH was measured in the
129 hyporheic porewater samples and in the surface water using a handheld pH meter (SenTix 41, WTW,
130 Germany), calibrated prior to sampling. Samples in the HZ were related to surface water samples,
131 obtained from an automatic water sampler (model 3700, Teflon suction line, Teledyne ISCO, Lincoln,
132 NE.) located 150 m upstream of the sampling site following procedures described elsewhere.31 Samples
133 for TrOC and dissolved organic carbon (DOC) analysis were filtered through regenerated cellulose
134 syringe filters (0.2 µm, Macherey-Nagel, Germany) and stored in amber glass bottles with Teflon lined
135 caps. Samples for TrOC analysis were immediately frozen on site. Samples for DOC analysis were stored
136 at 4° C in the dark and were measured within two weeks after sampling. Samples for NO3--N and major
137 cation analysis were filtered through cellulose acetate syringe filters (0.2 µm, Sartorius, Germany) and
138 stored in polyethylene bottles at 4 °C until analysis. Samples for total dissolved iron and dissolved
139 manganese analysis were additionally acidified to pH ≈ 2.0 using HCl. A sampling period of 17 h was
140 considered sufficient as the aim of the present study was to investigate TrOC reactivity and the effect of
142 the same field site it was known that (i) chemical conditions in River Erpe oscillate on a daily basis
143 (concentration troughs in the morning, peaks in the afternoon) but are relatively constant over the course
144 of weeks and (ii) that porewater velocities were in the order of several cm per hour.14,31
146 2.3 Analytical procedures
147 To enlarge the number of target compounds, samples were split and analyzed in parallel using high
148 performance liquid chromatography with tandem mass spectrometry (HPLC-MS/MS) at the Department
149 of Environmental Science and Analytical Chemistry (ACES) at Stockholm University and the Chair of
150 Water Quality Engineering at Technical University of Berlin (TUB) following standard protocols
151 established previously.26,32,33 In brief, separation of TrOCs was achieved via a XSelect HSS T3 HPLC
152 column (2.5 µm particle size, 2.1 * 50 mm, Waters, USA) at TUB and an Acquity UPLC HSS T3 column
153 (1.8 µm, 2.1 mm × 100 mm, Waters, USA) at ACES. Both protocols used linear gradients (ultra-pure
154 water versus 100% methanol; HPLC grade, J.T. Baker, USA). A TSQ Vantage (Thermo Fisher Scientific,
155 USA) and a Quantiva triple-quadrupole mass spectrometer in ESI ± modes were used for MS/MS analysis 156 at TUB and ACES, respectively. In both methods, TrOC were identified based on the characteristic ratio
157 of two ion fragments and quantified via isotope-substituted standards (Toronto Research Chemicals,
158 Canada) in combination with the most abundant fragment ion (Table SI-01). In both methods, a series of
159 calibration standards was measured before and after each sampling sequence. To assess analytical errors,
160 samples at TUB were measured in triplicate, while at ACES quality control standards were measured
161 during each run. In total, 29 TrOCs, including 22 parent compounds (PCs) and 7 transformation products
162 (TPs), were analyzed in the present study. Ultra-pure water (Maxima UF device, ELGA LabWater,
163 Germany) and tap water were measured as method blank at TUB and ACES, respectively. Limits of
164 detection (LODs) and quantification (LOQs) for each target compound and additional information on the
165 analytical procedures and data evaluation are provided in the SI (section 2). Concentrations of major
166 cations and total dissolved iron and manganese were measured using inductively coupled plasma optical
167 emission spectrometry (ICP-OES, ICP iCAP 6000series, Thermo Fisher). Nitrate-N concentrations were
168 measured via continuous-flow-analysis (SAN ++, Skalar) following DIN EN ISO 13395.
169 Absorbance spectra of dissolved organic matter (DOM, 250–600 nm, every 5 nm) and excitation-emission
171 250–550 nm 1.64 nm increments) were measured in triplicate at a Horiba Aqualog (Horiba Ltd, Japan) in
172 a 1 cm quartz cuvette. One blank (MiliQ water) was measured for every 9 measurements. Scan speed was
173 12 000 nm min-1 at a response time of 0.01 s. The Humification Index (HIX), a measure of the degree of
174 humification of DOM,34 was calculated after EEMs were blank-subtracted and corrected for the inner
175 filter effect. DOC concentration was measured in triplicate at a varioTOC cube (elementar
176 Analysensysteme, Germany). Specific UV absorbance at 254 nm (SUVA254) was calculated by
177 normalizing the decadal absorbance measured at 254 nm to DOC concentration (mg/L).35
178 2.4 Calculation of relative removal percentages
179 To assess overall TrOC removal along the investigated hyporheic flow path and to cross-validate
180 calculated removal rate constants (section 2.5), relative TrOC removals were calculated between the 181 surface water and hyporheic water in 40 cm depth and between other pairs of concentration time series,
182 i.e., between the surface water and hyporheic water in 10 cm depth, between hyporheic water in 10 and in
183 30 cm depth and between hyporheic water in 30 and in 40 cm depth. Because measured concentrations
184 varied with time, relative removal of a given TrOC (x) between two sampling depths (Relx) was calculated
185 using cumulative concentrations of a TrOC normalized to cumulative concentrations of a stable reference
186 compound:36,37 Rel𝑖𝑛 ― 𝑜𝑢𝑡𝑥 =
(
1 ― ∑𝑛 𝑖𝑐𝑥,𝑜𝑢𝑡,𝑖 ∑𝑛 𝑖𝑐𝑥,𝑖𝑛,𝑖 ∑𝑛 𝑖𝑐𝑟𝑒𝑓,𝑖𝑛,𝑖 ∑𝑛 𝑖𝑐𝑟𝑒𝑓,𝑜𝑢𝑡,𝑖)
𝑥 100% (1) 187188 whereby cx,in and cx,out (cref,in and cref,out) are the concentrations of the upper and lower concentration time
189 series of a TrOC (a stable reference compound), respectively, and n is the number of data points in each
190 time series. In the present study we used O-desmethylvenlafaxine (MLX) as a stable reference compound
191 as it showed low retardation along the hyporheic flow path and was found to be rather stable in the HZ
193 the surface water and in hyporheic porewater samples as another conservative reference (SI section 4).
194 Removal of a TrOC was considered significant if the 95% confidence interval of the relative removal,
195 computed using the respective analytical uncertainties of each TrOC (Table SI-02), did not include zero.
196 The applicability of equation 1 requires either relatively constant flow conditions or a positive correlation
197 between the reference compound and the target TrOC concentrations. Both requirements were likely met
198 in the present study as the study site was characterized by strong downwelling conditions (compare
199 section 3.1) and concentrations of TrOCs (with the exception of acesulfame, metoprolol acid and
200 metformin) were well correlated to O-desmethylvenlafaxine concentrations (Pearson Product Moment
201 Correlation coefficients > 0.7, p-value < 0.05). Equation 1 is based on the assumption that the transport
202 time scales of both, the target TrOC and the reference compound, are similar. Thus Relx calculated for
203 strongly retarding TrOCs (compare section 3.4) should be treated with caution.
205 2.5 Reactive transport modeling
206 Measured concentration time series in the HZ were evaluated using the one-dimensional (1D)
advection-207 dispersion transport equation including first-order degradation and retardation (1D-ADE). Assuming
208 steady and uniform flow in a homogeneous medium, and time invariant dispersion, retardation and
first-209 order decay the 1D-ADE equation can be written as:
𝑅∂𝑐 ∂𝑡= 𝐷ℎ ∂2𝑐 ∂𝑥2― 𝑣 ∂𝑐 ∂𝑥― 𝜆𝑐 (2)
210 where c denotes the concentration of a (reactive) compound, Dh the effective hydrodynamic dispersion
211 coefficient (m2 h-1), v the vertical porewater velocity (m h-1), λ a first-order removal rate constant (h-1) and
212 R the retardation coefficient (-). Equation 2 was implemented in the programming language Python and
213 solved numerically using a finite-difference scheme. The HZ was vertically divided into three sections
214 delimited by each pair of concentration time series: Section 1 between the surface water and 10 cm depth,
215 section 2 between 10 and 30 cm depth and section 3 between 30 and 40 cm depth. For each section in the
216 HZ, equation 2 was solved separately, yielding independent parameter estimates for each section. The 217 upper concentration time series served as an upper boundary condition in equation 2. The lower boundary
218 condition (in 100, 110 and 120 cm depth for sections 1, 2 and 3, respectively) was set to zero. The lower
219 concentration time series in each section was used for parameter estimation.
220 Parameter estimation was achieved using the DREAM algorithm,38,39 a Bayesian parameter optimization
221 method which employs evolutionary Monte Carlo Markov chains to estimate posterior probability density
222 distributions (posteriors) of model parameters. In a first step, posteriors of conservative transport
223 characteristics (i.e. v and Dh) were estimated from EC time series by setting λ to zero and R to unity. In a
224 second step, measured concentrations of TrOCs, DOC and NO3--N were used to derive first-order removal
225 rate constants and, for TrOCs, retardation coefficients using the previously derived posteriors for v and Dh
226 as priors. This approach was justified as the relative contribution of molecular diffusion to Dh, which at
228 diffusivities,40,41 can be considered negligible, because porewater velocities measured in the present study
229 were larger than 10-6 m s-1 (compare section 3.1) and molecular diffusion coefficients (D
mol) for the
230 investigated TrOCs are generally smaller than 10-9 m2 s-1 (Table SI-03, see SI section 3.3 for details on
231 calculation of Dmol).
232 Retardation coefficients can only be estimated from measured concentration time series that show a
233 distinct, traceable temporal pattern, i.e., a trough or peak. For TrOCs, parameter optimization via DREAM
234 was therefore conducted using two models, one including (R ≥ 1) and one excluding the effect of
235 retardation (R=1). If retardation coefficients could not be estimated, i.e., if posteriors of R were indifferent
236 from their priors, λ was estimated from the model in which R was set to unity. The conceptual model of
237 equation 2 assumes that i) water flows vertically from the surface into the HZ and that ii) mixing with 238 groundwater can be neglected. These assumptions were justified as i) the study site was characterized by
239 strong downwelling conditions (compare section 3.1) and a previous investigation on hyporheic flow
240 fields at the same site found that horizontal flow components were of minor importance14 and ii) relative
241 removal of O-desmethylvenlafaxine, a stable reference compound (compare section 2.4), was calculated to
242 be -3 to 4% (Table 2) indicating that groundwater input along the investigated flow path was negligible.
243 Details on the numerical scheme used to solve equation 2 and the parameter estimation procedure
244 including the prior distributions of model parameters and other DREAM settings are provided in the SI.
245
3. Results & Discussion
246 3.1 Transport characteristics in the hyporheic zone
247 Median porewater velocities, estimated from temperature depth profiles using VFLUX, ranged between
248 0.06 and 0.11 m h-1 (Table 1). These strong downwelling conditions (positive flux = downward flow) are
249 in line with values reported previously for the same study site.14 As a result of low WWTP discharge
250 during nighttime, EC time series in the surface water of River Erpe follow a saw-toothed pattern with
252 and 10:00 on June 16th propagated into the HZ and served as a natural tracer from which conservative
253 transport parameters were modeled using equation 2 (Figure 2). Porewater velocities derived from EC
254 time series using the 1D-ADE model ranged from 0.07 m h-1 to 0.17 m h-1 and are thus somewhat higher
255 than porewater velocities calculated from temperature time series using VFLUX, particularly in the upper
256 two sections of the HZ (Table 1). Differences in porewater velocities might be the result of erroneous
257 VFLUX calculations (e.g., due to violations of VFLUX model assumptions) and sediment heterogeneity.
258 Values for the effective hydrodynamic dispersion coefficient (Dh) ranged between 10 x 10-4 and 48 x 10-4
259 m2 h-1 and are within the same order of magnitude as values of the effective thermal dispersion coefficient
260 calculated by VFLUX (Dt, Table 1).
261 Table 1 Mean values (± 1 standard deviation) of porewater velocities (v) and dispersion coefficients (hydrodynamic dispersion 262 coefficient Dh, thermal dispersion coefficient Dt) derived from i) electrical conductivity (EC) time series using eqn. 2 (1D-ADE)
263 and ii) from temperature time series using VFLUX 2.0 for all three sections in the hyporheic zone. In addition, removal rates of
264 NO3--N (knit-N) and DOC (kDOC) are shown.
depth 1D-ADE VFLUX 2.0 NO3--N DOC
v Dh v Dt knit-N kDOC cm m h-1 m2 h-1 x 10⁻⁴ m h-1 m2 h-1 x 10⁻⁴ h-1 h-1 0-10 0.14 ± 0.01 48 ± 6 0.11 ± 0.02 73 ± 05 0.60 ± 0.03 0.30 ± 0.01 10-30 0.17 ± 0.01 10 ± 3 0.07 ± 0.01 34 ± 01 0.10 ± 0.01 0.12 ± 0.01 30-40 0.07 ± 0.01 46 ± 12 0.06 ± 0.01 36 ± 01 1.25 ± 0.03 0.05 ± 0.01 265
267 3.2 Redox zonation and DOC dynamics in the hyporheic zone
268 DOC concentrations gradually decreased along the investigated hyporheic flow path, while SUVA254 and
269 HIX, measures of the aromaticity and the degree of humification of DOC, respectively increased (Figure
270 SI-04). A general decrease of DOC concentrations and an increase of SUVA254 along hyporheic flow
271 paths has been reported previously42 and was attributed to preferred degradation of non-aromatic,
272 biodegradable DOC fractions in the HZ. The largest removal rate of DOC as well as the largest change in
273 HIX occurred between 0 and 10 cm depth (Table 1, Figure SI-04), suggesting that the largest change in
274 DOC quantity and quality along the investigated hyporheic flow path occurred in the upper 10 cm of the
275 HZ. This finding is in agreement with previous investigations in the HZ, suggesting that the highest
276 carbon turnover rates in the HZ are typically found within the first cm of the HZ in the so called active 277 benthic bio-layer.10 A more detailed discussion of DOC dynamics in the HZ including information on
278 other EEM indices is provided in the SI (SI section 6).
279 During the sampling period, nitrate concentrations in the surface water were high (median concentrations
280 7.0 mg/L NO3--N, Table SI-04). In the HZ, nitrate removal rates were high between 0 and 10 cm depth,
281 low between 10 and 30 cm depth and highest between 30 and 40 cm depth (Figure SI-03, Table 1).
282 Concentrations of total dissolved iron and dissolved manganese in the HZ were relatively low (< 0.05
283 mg/L, Table SI-04), indicating the redox conditions in the stream sediment were not yet within iron- and
284 manganese-reducing ranges. Removal of nitrate-N in the HZ can be caused by microbial uptake (i.e.,
285 assimilation) and denitrification occurring in both anoxic sections of the HZ and in anoxic microzones.42–
286 44 Because DOC removal rates were highest in the shallow HZ, it is reasonable to assume that in addition
287 to potential denitrification in anoxic microzones,23 nitrate-N removal in the upper 10 cm in the HZ was
288 primarily caused by biotic assimilation. The higher nitrate-N removal rate in the deeper HZ (i.e., between
289 30 and 40 cm depth), however, is presumably attributable to denitrification. It is therefore likely that redox
290 conditions in the bulk porewater were rather oxic in the first 30 cm of the HZ and became suboxic (i.e.
292 microbial turnover rates and the abundance and quality of electron acceptors and donors, physical
293 parameters such as temperature and transport characteristics that control residence time distributions in the
294 HZ. Compared to earlier investigations on redox zonation in the HZ at the same study site,14 redox
295 zonation in the present study was shifted downwards (i.e. deeper onset of denitrification and
296 iron/manganese reduction). In line with previous studies,23 we attribute this finding to larger porewater
297 velocities measured in the present study.
299 3.3 Reactivity of trace organic compounds in the HZ
300 Out of the 29 investigated TrOCs, relative removals (%) and first-order removal rates could be calculated
301 from measured concentration time series of 28 compounds (Table 2). For epoxy-carbamazepine (EBZ),
302 concentrations were either below LOQ or just slightly above LOQ and thus EBZ was not considered in
303 further analysis (Table SI-04). Modeled and measured concentration time series for valsartan acid (VSA),
304 metformin (MEF) and its TP guanylurea (GUA) and EC are depicted in Figure 2. Measured and modeled
305 concentration time series of the remaining TrOCs are shown in Figures SI 05-32. Twenty-two compounds
306 were significantly removed between the surface water and 40 cm depth with half-lives within the first 10
307 cm of the HZ ranging between 0.1±0.01 h for iopromide and 3.5±0.3 h for tramadol (Table 2).
308 The highest removal rate constants were calculated for the iodinated X-ray contrast agents iomeprol 309 (IOM) and iopromide (IOP). Complete de-iodination of both compounds in saturated sediments has only
310 been observed under anoxic redox conditions45 but both compounds are known to readily loose side chains
311 of the iodinated ring structure under aerobic conditions.46,47 It is therefore likely that the high removal
312 rates calculated in the present study are due to transformation of both compounds and do not represent
313 complete mineralization. Removal of the artificial sweetener acesulfame (ACS), the lipid-lowering agent
314 bezafibrate (BZF), the anti-corrosive agents benzotriazole and methylbenzotriazole and the anticonvulsant
315 GAB along oxic to suboxic (i.e. denitrifying) flow paths in hyporheic sediments has previously been
316 described in laboratory column experiments12,48 and observed in the HZ.14 For ACS, reported half-lives
317 range from 1.214 to 512 h and for BZF and GAB were calculated to be 1.2 h and 0.96 h in a previous
318 investigation at the same site.14 Thus, half-lives for ACS, BZF and GAB calculated in the present study
319 match half-lives calculated previously for hyporheic sediments. Removal of gabapentin-lactam, a major
320 TP of GAB,48 in saturated sediments has previously been reported during bank filtration, with half-lives
321 between 1.2 and 3.7 h.49 These values match the ones calculated for the first 10 cm of the HZ (2.3±0.2 h),
323 Although the antidiabetic drug metformin and its main TP guanylurea50 have been detected ubiquitously in
324 surface waters,51,52 qualitative information on the fate of the two compounds in saturated sediments is
325 relatively scarce. Both were found to be rather stable in laboratory batch experiments;50,53 a finding that
326 cannot be confirmed in the present study where they show half-lives in the HZ of several hours.
327 Calculated half-lives for the beta-blockers MTP are in line with findings of a laboratory column study
328 reporting half-lives of several hours for oxic/suboxic conditions,12 but contrast results of investigations
329 conducted previously at the same study site, in which MTP was, on average, not significantly removed
330 along a 20 cm long hyporheic flow path.14 Metoprolol acid (MTA), a main TP of MTP, was formed in the
331 HZ, suggesting that removal of MTP in the HZ is at least in part due to transformation into MTA.
332 Quantitative information on the fate of the beta blocker sotalol (SOT) and the opioid analgesic tramadol 333 (TRA) in the HZ is limited. For SOT and TRA, a concentration decrease in the HZ25 and in sediments of a
334 flume study mimicking the HZ,13 respectively, has been reported, but no removal rates were calculated.
335 The antihypertensive drugs olmesartan (OLM), irbesartan (IRB), candesartan (CAN) and valsartan (VAL)
336 were significantly removed along the investigated flow path. Simultaneously concentrations of their
337 common TP valsartan acid54,55 (VSA) increased. At least part of the removal of OLM, CAN, VAL and
338 IRB can therefore be attributed to transformation to VSA. While VAL removal in hyporheic sediments
339 has been described,17 OLM and CAN were found to be rather stable in both, hyporheic sediments and
340 during river bank filtration.17,49 Although removal of VSA has been described in bank filtration systems,49
341 concentrations of its PCs were likely too high in the HZ and thus net formation rates were higher than
342 potential VSA removal rates.
343 Carbamazepine (CBZ) and one of its TPs dihydroxy-carbamazepine (DBZ), diclofenac (DCF), diatrizoic
344 acid (diatrizoate, DTA) and venlafaxine (VLX) and its TP O-desmethylvenlafaxine (MLX) were not
345 significantly removed and were thus considered to be rather stable along the investigated flow path (Table
346 2). CBZ is well known for its stability in saturated sediments56 and hitherto, removal has only been
348 of DBZ remained relatively constant along the investigated flow path it is reasonable to assume that
349 transformation of CBZ to DBZ along short (<40 cm) and rather oxic flow paths in the HZ is limited.
350 Laboratory and field studies have demonstrated that VLX,58 DCF12,14 and DTA59 can be removed in
351 saturated sediments. It is therefore likely that in the present study exposure times to favorable
352 biogeochemical conditions in the HZ times were likely too short to facilitate significant removal of these
353 compounds.
354 The anticonvulsant primidone (PRI) and the antibiotic sulfamethoxazole (SMX) showed negative removal
355 indicating a concentration increase in the HZ. To the best of our knowledge, formation of PRI in the HZ
356 has not been reported and we thus attribute the small concentration increase (18±7%) to desorption
357 processes. For SMX however, back-transformation of photo-transformation products into SMX has been 358 observed in water/sediment systems.60 It is therefore perceivable that back-transformation was responsible
359 for the observed concentration increase of SMX. The TrOC 4-formylaminoantipyrin (FAA), a human
360 metabolite of metamizole61 (a phenazone-type analgesics not investigated in the present study), was found
361 to be removed between 0 and 30 cm depth but was formed between 30 and 40 cm depth. Removal of FAA
362 in oxic sections of saturated sediments has been described,12,62 although a previous investigation at the
363 same site found inconsistent behavior (removal in some profiles, formation in others) of the compound.14
364 It remains unclear whether the formation of FAA during suboxic (i.e. denitrifying) redox conditions is due
365 to back-transformation or due to increased transformation of its PC(s).
366 For some compounds (e.g. OLM), modeled concentration time series could be fitted well over the entire
367 time series. For other compounds such as MTP, VSA or GUA (Figure 1, Figure SI-24), modeled
368 concentrations matched measured concentration time series well in some parts of the time series but
369 deviated in others. Such discrepancies indicate that model assumptions such as time invariant porewater
370 velocities or removal rate constants were not met throughout the sampling event. Time varying removal
371 rate constants could be the consequence of temperature dependent biotransformation rates or varying
373
374 Figure 2 Measured (dots) and modeled (solid lines) concentration time series in 10 cm, 30 cm and 40 cm depth in the hyporheic 375 zone (HZ) and measured concentration time series in the surface water (0 cm) of guanylurea (GUA), metformin (MEF), valsartan
376 acid (VSA) and electrical conductivity (EC). For concentration time series measured in the HZ, analytical uncertainty (one
377 standard deviation) is shown in grey. Note that for modeling purposes, concentration time series in the surface water were linearly
378 interpolated (black dashed line) and that for EC no measurement uncertainties were available.
380 Table 2 Relative removal in the upper 40 cm of the hyporheic zone (Relx0-40, %), half-lives (t1/2, h) and retardation coefficients (R, 381 dimensionless) of all trace organic compounds investigated in the present study except epoxy-carbamazepine calculated between
382 0 and 10, 10 and 30 and 30 and 40 cm depth in the hyporheic zone. Note that retardation coefficients could only be estimated
383 from input time series that showed a distinct temporal pattern, i.e. a trough or peak. Half-lives exceeding the sampling period (i.e.,
384 17 h) were set to infinity.
TrOC Relx0-40
(%) t1/2 (h) R (-)
0-40 0-10 10-30 30-40 0-10 10-30 30-40 acesulfame (ACS) 78±1 0.5±0.0 2.9±0.2 0.9±0.0 1.2±0.1 1.0 n.e. benzotriazole (BTA) 63±2 0.9±0.0 2.6±0.1 12.6±2.6* 4.0±0.5 n.e. n.e. bezafibrate (BZF) 69±2 0.8±0.0 3.7±0.1 1.9±0.2 2.6±0.3 2.8±0.0 n.e. candesartan (CAN) 27±4 1.1±0.1 12.9±3.8f,* inf 1.7±0.2 1.3±0.1 n.e.
carbamazepine (CBZ) 9±5* 9.8±1.6 inf inf 3.6±0.3 n.e. n.e. dihydroxy-carbamazepine (DBZ) -1±6* 3.2±0.4* 11.4±5.3 15.8±8.9f 2.2±0.3 n.e. n.e.
diclofenac (DCF) -11±6* inf inf inf 4.3±0.3 n.e. n.e. diatrizoic acid (DTA) 0±9* 6.3±1.4* inf inf 1.1±0.1 2.0±2.5 n.e. 4-formylaminoantipyrine (FAA) 10±4 1.2±0.1 inf 9.4±0.9f 2.4±0.2 1.5±0.1 n.e.
gabapentin (GAB) 79±1 0.4±0.0 1.5±0.0 2.1±0.1 1.4±0.0 1.4±0.1 3.7±0.6 gabapentin-lactam (GPL) 12±5 2.3±0.2 8.9±1.4f,* inf 1.3±0.2 n.e. n.e.
guanylurea (GUA) 78±1 0.6±0.0 1.4±0.0 2.8±0.3 2.6±0.2 n.e. n.e. iomeprol (IOM) 98±0 0.1±0.0 0.7±0.0 0.7±0.1 1.9±0.4 1.1±0.1 n.e. iopromid (IOP) 98±0 0.1±0.0 0.8±0.1 0.6±0.3 n.e. n.e. n.e. irbesartan (IRB) 37±3 1.0±0.0 7.1±1.3f 3.9±0.6 3.5±0.1 n.e. n.e.
methylbenzotriazole (MBT) 36±3 1.7±0.0 4.1±0.1 11.6±0.9f 3.3±0.1 n.e. n.e.
metformin (MEF) 66±2 1.1±0.1 1.6±0.0 3.9±0.2 15.3±2.2 n.e. n.e.
O-desmethylvenlafaxine (MLX) 0±6* 14.1±6.8f 12.1±5.6* inf 1.5±0.2 n.e. n.e.
metoprolol acid (MTA) -35±8 2.0±0.2f 12.8±4.7f,* inf n.e. n.e. n.e.
metoprolol (MTP) 90±1 0.2±0.0 1.3±0.1 2.5±0.5 4.5±0.5 n.e. n.e. olmesartan (OLM) 18±4 1.5±0.1 inf inf 1.4±0.1 1.3±0.2 n.e. primidone (PRI) -18±7 10.3±3.9f,* inf 11.0±0.8f,* 1.4±0.1 n.e. n.e.
sulfamethoxazole (SMX) -47±8 6.8±1.4f,* 4.9±0.4f 11.1±1.7f,* 1.6±0.2 1.1±0.1 1.1±0.1
sotalol (SOT) 50±2 0.8±0.0 3.3±0.2 5.8±0.6* 1.9±0.2 n.e. n.e. tramadol (TRA) 12±4 3.5±0.2 inf inf 2.2±0.2 n.e. n.e. valsartan (VAL) 26±4 1.1±0.0 7.8±0.2 9.4±1.1f,* 1.9±0.0 n.e. n.e.
venlafaxine (VLX) -5±9* 6.2±2.2* inf 9.0±5.8* 3.6±0.6 n.e. n.e. valsartan acid (VSA) -205±15 1.2±0.0f 2.4±0.1f 7.6±0.9f 1.1±0.1 1.0±0.0 n.e. 385 inf = half-life > 17 h. * = not significantly removed/formed as indicated by Relx. n.e. = not estimated. f= TrOC formation.
386
387 Figure 3 First-order removal rate constants (λ) as a function of depth of all investigated parent compounds (PCs, shown in red) 388 and transformation compounds (TPs, shown in blue) except, primidone, epoxy-carbamazepine, venlafaxine and
O-389 desmethylvenlafaxine. Error bars indicate one standard deviation. ACS, acesulfame; BTA, benzotriazole; BZF, bezafibrate; CAN,
390 candesartan; CBZ, carbamazepine; DBZ, dihydroxy-carbamazepine; DCF, diclofenac; DTA, diatrizoic acid; FAA,
4-391 formylaminoantipyrine; GAB, gabapentin; GPL, gabapentin-lactam; GUA, guanylurea; IOM, iomeprol; IOP, iopromide; IRB,
392 irbesartan; MBT, methylbenzotriazole; MEF, metformin; MTA, metoprolol acid; MTP, metoprolol; olmesartan, OLM; SMX,
393 sulfamethoxazole; SOT, sotalol; TRA, tramadol; VAL, valsartan; VSA, valsartan acid.
395 3.4 Retardation of TrOCs in the HZ
396 Surface water concentration time series of all 28 TrOCs that were further investigated in the present study
397 showed a pronounced temporal pattern (i.e. a concentration trough) and thus retardation coefficients for all
398 TrOCs except IOP and MTA could be calculated for the first 10 cm in the HZ. However, concentration
399 time series of many TrOCs measured in 10 and 30 cm did no longer exhibit a distinct temporal pattern and
400 thus retardation coefficients could not be estimated between 10 - 30 and 30 - 40 cm for these compounds
401 (Table 2). Calculated retardation coefficients ranged from 1.1±0.1 (i.e., no retardation) for compounds
402 such as ACS, VSA, and DTA to 15.3±2.2 for MEF (Table 2).
403 Retardation of TrOCs along hyporheic flow paths is due to reversible sorption processes caused by a
404 variety of interaction mechanisms between TrOCs and streambed sediments and biofilms. Neutral TrOCs 405 interact with streambed materials predominately via hydrophobic partitioning, while sorption and
406 retardation of ionizable compounds can additionally be caused by electrostatic interactions and surface
407 complexation.18 At ambient pH values measured in River Erpe during the sampling campaign (pH ≈ 7.3),
408 7 of the investigated compounds occur as cations (GUA, MEF, MTP, SOT, VLX, MLX and TRA), 10
409 TrOCs occur as anions (ACS, BZF, CAN, DCF, DTA, IRB, OLM, SMX, VAL and VSA), 2 occur as a
410 zwitterions (GAB, MTA) and 9 do not carry any charge (BTA, CBZ, DBZ, FAA, GPL, IOM, IOP, MBT,
411 and PRI). To assess the possible influence of hydrophobic partitioning retardation, Pearson Product
412 Moment correlations were calculated between retardation coefficients estimated for the first 10 cm in the
413 HZ and pH-dependent octanol-water partitioning coefficients (logDow) of the respective TrOCs (obtained
414 from www.chemicalize.com, Table SI-05). Retardation coefficients of positively charged TrOCs were all
415 larger than 1 and did not significantly correlate with logDow values (Table SI-06), suggesting that the
416 contribution of hydrophobic partitioning to retardation of cationic TrOCs is negligible. This finding is in
417 line with previous observations indicating that sorption of cationic TrOCs, such as MEF, its TP GUA,63
418 VLX64 and beta-blockers such as MTP and SOT13,65 to sediment materials can be substantial and occurs
420 correlated positively with estimated retardation coefficients (Table SI-06), indicating that retardation of
421 anionic TrOCs in the HZ is at least partially caused by hydrophobic partitioning into sediment organic
422 matter. This finding is in agreement with work that showed that sorption of anionic compounds is driven
423 by their hydrophobicity rather than by electrostatic interactions.66 For the neutral TrOCs PRI, CBZ, and
424 DBZ, retardation coefficients found in a laboratory column (RCBZ = 2.1, RDBZ = 3.2, foc = 0.29%)20 and
425 batch tests (RCBZ = 3.6-5.3, RPRI = 1.2, foc = 0.23%)21 compared well to values calculated in the present
426 study (sediment foc = 0.5 – 6%),14 while a field study had found negligible retardation for compounds such
427 as CBZ and BTA during riparian bank filtration (foc = 0.01-0.11%).16 Such discrepancies are likely
428 attributable to differences in sediment organic matter content and general sediment heterogeneity.
429 We conclude that reversible sorption processes can substantially retard TrOCs along hyporheic flow paths, 430 even for compounds that are negatively charged. Retardation caused by reversible sorption processes
431 increases the residence time of TrOCs relative to the water residence time in the HZ. Neglecting the effect
432 of retardation may lead to erroneous estimates of removal rate constants, particularly when their
433 calculation is based on simple concentration differences17 and when sampling periods are relatively short
434 compared to the characteristic time scales over which surface water concentrations fluctuate. Studies that
435 aim at quantitatively investigating the fate of TrOCs in the HZ and along river reaches with significant
436 hyporheic exchange flows should therefore consider retardation and adjust their reactive transport models
437 and sampling schemes accordingly. Some compounds (e.g. CBZ, DBZ, VLX, or DCF) were retarded
438 along the investigated hyporheic flow path but showed only very small removal rates in the HZ. If
439 concentrations of these compounds in surface waters drop considerably over short time scales (e.g. during
440 hydrological events), desorption processes might remobilize TrOCs previously adsorbed to sediment
441 materials and biofilms and hence hyporheic exchange would lead to a concentration increase of these
442 TrOCs in the surface water.
444 3.5 Influence of benthic bio-layer and DOC on TrOC reactivity
445 For all TrOCs for which concentration changed significantly between the surface water and 40 cm depth
446 in the HZ (22 out of 28) except SMX, removal rates calculated for the top 10 cm in the HZ were
447 substantially higher compared to removal rate constants calculated between 10 and 30 and 30 and 40 cm
448 depth (Figure 3). Because redox conditions in the top 30 cm of the HZ were predominantly oxic, it is
449 reasonable to assume that the increased reactivity in the top 10 cm of the HZ is due to increased microbial
450 activity in the benthic bio-layers growing in the top cm of the HZ and high chemical turnover rates
451 typically associated with shallow hyporheic flow paths.10,11 This finding is further underlined by changes
452 in DOC concentration and quality, suggesting that TrOC turnover within similar redox zones in the HZ is
453 closely coupled to DOC turnover. Studies on managed aquifer recharge reported that TrOC removal rates 454 under oxic conditions were highest when BDOC was limited, an observation that was mainly attributed to
455 the presence of highly adapted microbial communities that developed under oligotrophic conditions.22,49,67
456 However, our results show, that in natural systems such as the HZ, high TrOC removal rates can also be
457 associated with oxic and eutrophic conditions, in which high concentrations of BDOC likely fuel
458 microbial metabolism and serve as a co-substrate for the co-metabolic removal of TrOCs.
459 Due to practical limitations associated with our sampling approach, the present study investigated a
460 downwelling flow path that is unlikely to return to the surface water. However, our findings should in
461 principle be transferable to hyporheic flow paths that return to the stream and thus have implications for
462 reach-scale removal of TrOCs. Together with earlier investigations showing that for many TrOCs removal
463 rates are higher under oxic compared to anoxic redox conditions,12,14 our results suggest that short and
464 shallow flow paths are more efficient in removing TrOCs than long and deep flow paths, along which
465 redox conditions become increasingly anoxic and microbial activity decreases. River restoration measures
466 that promote frequent and short vertical exchange flows through the shallow HZ, such as the construction
468 contribute more to overall in-stream removal of TrOCs than measures that promote, longer lateral
469 exchange flows such as the installation of meander bends or pool-riffle sequences.
471
References
472 (1) Ternes, T. A.; Joss, A.; Siegrist, H. Peer Reviewed: Scrutinizing Pharmaceuticals and Personal
473 Care Products in Wastewater Treatment. Environ. Sci. Technol. 2004, 38 (20), 392A–399A.
474 https://doi.org/10.1021/es040639t.
475 (2) Eggen, R. I. L.; Hollender, J.; Joss, A.; Schärer, M.; Stamm, C. Reducing the Discharge of
476 Micropollutants in the Aquatic Environment: The Benefits of Upgrading Wastewater Treatment
477 Plants. Environ. Sci. Technol. 2014, 48 (14), 7683–7689. https://doi.org/10.1021/es500907n.
478 (3) Bradley, P. M.; Journey, C. A.; Romanok, K. M.; Barber, L. B.; Buxton, H. T.; Foreman, W. T.;
479 Furlong, E. T.; Glassmeyer, S. T.; Hladik, M. L.; Iwanowicz, L. R.; Jones, D. K.; Kolpin, D. W.;
480 Kuivila, K. M.; Loftin, K. A.; Mills, M. A.; Meyer, M. T.; Orlando, J. L.; Reilly, T. J.; Smalling,
481 K. L.; Villeneuve, D. L. Expanded Target-Chemical Analysis Reveals Extensive
Mixed-Organic-482 Contaminant Exposure in U.S. Streams. Environ. Sci. Technol. 2017, 51 (9), 4792–4802.
483 https://doi.org/10.1021/acs.est.7b00012.
484 (4) Loos, R.; Carvalho, R.; António, D. C.; Comero, S.; Locoro, G.; Tavazzi, S.; Paracchini, B.;
485 Ghiani, M.; Lettieri, T.; Blaha, L.; Jarosova, B.; Voorspoels, S.; Servaes, K.; Haglund, P.; Fick, J.;
486 Lindberg, R. H.; Schwesig, D.; Gawlik, B. M. EU-Wide Monitoring Survey on Emerging Polar
487 Organic Contaminants in Wastewater Treatment Plant Effluents. Water Res. 2013, 47 (17), 6475–
488 6487. https://doi.org/10.1016/j.watres.2013.08.024.
489 (5) Brodin, T.; Fick, J.; Jonsson, M.; Klaminder, J. Dilute Concentrations of a Psychiatric Drug Alter
490 Behavior of Fish from Natural Populations. Science 2013, 339 (6121), 814–815.
491 https://doi.org/10.1126/science.1226850.
492 (6) Schwarzenbach, R. P.; Egli, T.; Hofstetter, T. B.; von Gunten, U.; Wehrli, B. Global Water
493 Pollution and Human Health. Annu. Rev. Environ. Resour. 2010, 35 (1), 109–136.
494 https://doi.org/10.1146/annurev-environ-100809-125342.
496 Bioaccumulation of Antidepressants in Fish from Effluent-Impacted Niagara River. Environ. Sci.
497 Technol. 2017, 51 (18), 10652–10662. https://doi.org/10.1021/acs.est.7b02912.
498 (8) Pal, A.; He, Y.; Jekel, M.; Reinhard, M.; Gin, K. Y. H. Emerging Contaminants of Public Health
499 Significance as Water Quality Indicator Compounds in the Urban Water Cycle. Environment
500 International. 2014, 71, 46–62. https://doi.org/10.1016/j.envint.2014.05.025.
501 (9) Boano, F.; Harvey, J. W.; Marion, A.; Packman, A. I.; Revelli, R.; Ridolfi, L.; Wörman, A.
502 Hyporheic Flow and Transport Processes: Mechanisms, Models, and Bioghemical Implications.
503 Rev. Geophys. 2014, 52, 603–379. https://doi.org/10.1002/2012RG000417.Received.
504 (10) Knapp, J. L. A.; González-Pinzón, R.; Drummond, J. D.; Larsen, L. G.; Cirpka, O. A.; Harvey, J.
505 W. Tracer-Based Characterization of Hyporheic Exchange and Benthic Biolayers in Streams. 506 Water Resour. Res. 2017, 53, 1575–1594. https://doi.org/10.1002/2016WR019393.
507 (11) Krause, S.; Lewandowski, J.; Grimm, N. B.; Hannah, D. M.; Pinay, G.; McDonald, K.; Martí, E.;
508 Argerich, A.; Pfister, L.; Klaus, J.; Battin, T.; Larned, S. T.; Schelker, J.; Fleckenstein, J.; Schmidt,
509 C.; Rivett, M. O.; Watts, G.; Sabater, F.; Sorolla, A.; Turk, V. Ecohydrological Interfaces as Hot
510 Spots of Ecosystem Processes. Water Resour. Res. 2017, 53 (8), 6359–6376.
511 https://doi.org/10.1002/2016WR019516.
512 (12) Burke, V.; Greskowiak, J.; Asmuß, T.; Bremermann, R.; Taute, T.; Massmann, G. Temperature
513 Dependent Redox Zonation and Attenuation of Wastewater-Derived Organic Micropollutants in
514 the Hyporheic Zone. Sci. Total Environ. 2014, 482–483 (1), 53–61.
515 https://doi.org/10.1016/j.scitotenv.2014.02.098.
516 (13) Li, Z.; Sobek, A.; Radke, M. Flume Experiments to Investigate the Environmental Fate of
517 Pharmaceuticals and Their Transformation Products in Streams. Environ. Sci. Technol. 2015, 49
518 (10), 6009–6017. https://doi.org/10.1021/acs.est.5b00273.
519 (14) Schaper, J. L.; Seher, W.; Nützmann, G.; Putschew, A.; Jekel, M.; Lewandowski, J. The Fate of
521 https://doi.org/10.1016/j.watres.2018.04.040.
522 (15) Lewandowski, J.; Putschew, A.; Schwesig, D.; Neumann, C.; Radke, M. Fate of Organic
523 Micropollutants in the Hyporheic Zone of a Eutrophic Lowland Stream: Results of a Preliminary
524 Field Study. Sci. Total Environ. 2011, 409 (10), 1824–1835.
525 https://doi.org/10.1016/j.scitotenv.2011.01.028.
526 (16) Huntscha, S.; Rodriguez Velosa, D. M.; Schroth, M. H.; Hollender, J. Degradation of Polar
527 Organic Micropollutants during Riverbank Filtration: Complementary Results from Spatiotemporal
528 Sampling and Push-Pull Tests. Environ. Sci. Technol. 2013, 47 (20), 11512–11521.
529 https://doi.org/10.1021/es401802z.
530 (17) Schaper, J. L.; Posselt, M.; Mccallum, J. L.; Banks, E.; Hoehne, A.; Meinikmann, K.; Shanafield, 531 M.; Batelaan, O.; Lewandowski, J. Hyporheic Exchange Controls Fate of Trace Organic
532 Compounds in an Urban Stream. Environ. Sci. Technol. 2018, 52, 12285–12294.
533 https://doi.org/10.1021/acs.est.8b03117.
534 (18) MacKay, A. A.; Vasudevan, D. Polyfunctional Ionogenic Compound Sorption: Challenges and
535 New Approaches to Advance Predictive Models. Environ. Sci. Technol. 2012, 46 (17), 9209–9223.
536 https://doi.org/10.1021/es301036t.
537 (19) Schaffer, M.; Börnick, H.; Nödler, K.; Licha, T.; Worch, E. Role of Cation Exchange Processes on
538 the Sorption Influenced Transport of Cationic β-Blockers in Aquifer Sediments. Water Res. 2012,
539 46 (17), 5472–5482. https://doi.org/10.1016/j.watres.2012.07.013.
540 (20) Writer, J. H.; Antweiler, R. C.; Ferrer, I.; Ryan, J. N.; Thurman, E. M. In-Stream Attenuation of
541 Neuro-Active Pharmaceuticals and Their Metabolites. Environ. Sci. Technol. 2013, 47 (17), 9781–
542 9790. https://doi.org/10.1021/es402158t.
543 (21) Schaffer, M.; Boxberger, N.; Börnick, H.; Licha, T.; Worch, E. Sorption Influenced Transport of
544 Ionizable Pharmaceuticals onto a Natural Sandy Aquifer Sediment at Different PH. Chemosphere
546 (22) Rauch-Williams, T.; Hoppe-Jones, C.; Drewes, J. E. The Role of Organic Matter in the Removal of
547 Emerging Trace Organic Chemicals during Managed Aquifer Recharge. Water Res. 2010, 44 (2),
548 449–460. https://doi.org/10.1016/j.watres.2009.08.027.
549 (23) Harvey, J. W.; Böhlke, J. K.; Voytek, M. A.; Scott, D.; Tobias, C. R. Hyporheic Zone
550 Denitrification: Controls on Effective Reaction Depth and Contribution to Whole-Stream Mass
551 Balance. Water Resour. Res. 2013, 49 (10), 6298–6316. https://doi.org/10.1002/wrcr.20492.
552 (24) Peralta-Maraver, I.; Galloway, J.; Posselt, M.; Arnon, S.; Reiss, J.; Lewandowski, J.; Robertson, A.
553 L. Environmental Filtering and Community Delineation in the Streambed Ecotone. Sci. Rep. 2018,
554 8 (October 2017), 1–11. https://doi.org/10.1038/s41598-018-34206-z.
555 (25) Kunkel, U.; Radke, M. Fate of Pharmaceuticals in Rivers: Deriving a Benchmark Dataset at
556 Favorable Attenuation Conditions. Water Res. 2012, 46 (17), 5551–5565.
557 https://doi.org/10.1016/j.watres.2012.07.033.
558 (26) Posselt, M.; Jaeger, A.; Schaper, J. L.; Radke, M.; Benskin, J. P. Determination of Polar Organic
559 Micropollutants in Surface and Pore Water by High-Resolution Sampling-Direct Injection-Ultra
560 High Performance Liquid Chromatography-Tandem Mass Spectrometry. Environ. Sci. Process.
561 Impacts 2018, 20 (12), 1716–1727. https://doi.org/10.1039/c8em00390d.
562 (27) Munz, M.; Oswald, S. E.; Schmidt, C. Analysis of Riverbed Temperatures to Determine the
563 Geometry of Subsurface Water Flow around In-Stream Geomorphological Structures. J. Hydrol.
564 2016, 539, 74–87. https://doi.org/10.1016/j.jhydrol.2016.05.012.
565 (28) McCallum, A. M.; Andersen, M. S.; Rau, G. C.; Acworth, R. I. A 1-D Analytical Method for
566 Estimating Surface Water-Groundwater Interactions and Effective Thermal Diffusivity Using
567 Temperature Time Series. Water Resour. Res. 2012, 48 (11), 1–8.
568 https://doi.org/10.1029/2012WR012007.
569 (29) Gordon, R. P.; Lautz, L. K.; Briggs, M. A.; McKenzie, J. M. Automated Calculation of Vertical
571 Program. J. Hydrol. 2012, 420–421, 142–158. https://doi.org/10.1016/j.jhydrol.2011.11.053.
572 (30) Young, P. C.; Pedregal, D. J.; Tych, W. Dynamic Harmonic Regression. J. Forecast. 1999, 18 (6),
573 369–394. https://doi.org/10.1002/(SICI)1099-131X(199911)18:6<369::AID-FOR748>3.0.CO;2-K.
574 (31) Jaeger, A.; Posselt, M.; Betterle, A.; Schaper, J.; Mechelke, J.; Coll, C.; Lewandowski, J. Spatial
575 and Temporal Variability in Attenuation of Polar Organic Micropollutants in an Urban Lowland
576 Stream. Environ. Sci. Technol. 2018, 53, 2383–2395. https://doi.org/10.1021/acs.est.8b05488.
577 (32) Zietzschmann, F.; Aschermann, G.; Jekel, M. Comparing and Modeling Organic Micro-Pollutant
578 Adsorption onto Powdered Activated Carbon in Different Drinking Waters and WWTP Effluents.
579 Water Res. 2016, 102, 190–201. https://doi.org/10.1016/j.watres.2016.06.041.
580 (33) Aschermann, G.; Zietzschmann, F.; Jekel, M. Influence of Dissolved Organic Matter and Activated 581 Carbon Pore Characteristics on Organic Micropollutant Desorption. Water Res. 2018, 133, 123–
582 131. https://doi.org/10.1016/j.watres.2018.01.015.
583 (34) Ohno, T. Fluorescence Inner-Filtering Correction for Determining the Humification Index of
584 Dissolved Organic Matter. Environ. Sci. Technol. 2002, 36 (4), 742–746.
585 https://doi.org/10.1021/es0155276.
586 (35) Weishaar, J. L.; Aiken, G. R.; Bergamaschi, B. A.; Fram, M. S.; Fujii, R.; Mopper, K. Evaluation
587 of Specific Ultraviolet Absorbance as an Indicator of the Chemical Composition and Reactivity of
588 Dissolved Organic Carbon. Environ. Sci. Technol. 2003, 37 (20), 4702–4708.
589 https://doi.org/10.1021/es030360x.
590 (36) Harvey, R. W.; Garabedian, S. P. Use of Colloid Filtration Theory in Modelling Movement of
591 Bacteria through a Contaminated Sandy Aquifer. Environ. Sci. Technol. 1991, 25, 178–185.
592 (37) Kunkel, U.; Radke, M. Reactive Tracer Test to Evaluate the Fate of Pharmaceuticals in Rivers.
593 Environ. Sci. Technol. 2011, 45 (15), 6296–6302. https://doi.org/10.1021/es104320n.
594 (38) Vrugt, J. A.; Robinson, B. A.; Clark, M. P.; ter Braak, C. J. F.; Hyman, J. M. Treatment of Input
596 Carlo Simulation. Water Resour. Res. 2008, 44 (12), 1–15. https://doi.org/10.1029/2007wr006720.
597 (39) Vrugt, J. A. Markov Chain Monte Carlo Simulation Using the DREAM Software Package: Theory,
598 Concepts, and MATLAB Implementation. Environ. Model. Softw. 2016, 75, 273–316.
599 https://doi.org/10.1016/j.envsoft.2015.08.013.
600 (40) Voermans, J. J.; Ghisalberti, M.; Ivey, G. N. A Model for Mass Transport Across the
Sediment-601 Water Interface. Water Resour. Res. 2018, 54 (4), 2799–2812.
602 https://doi.org/10.1002/2017WR022418.
603 (41) Grant, S. B.; Azizian, M.; Cook, P.; Boano, F.; Rippy, M. A. Factoring Stream Turbulence into
604 Global Assessments of Nitrogen Pollution. Science 2018, 359, 1266–1269.
605 (42) Zarnetske, J. P.; Haggerty, R.; Wondzell, S. M.; Baker, M. A. Dynamics of Nitrate Production and 606 Removal as a Function of Residence Time in the Hyporheic Zone. J. Geophys. Res. Biogeosciences
607 2011, 116 (1), 1–12. https://doi.org/10.1029/2010JG001356.
608 (43) Mulholland, P. J.; Helton, A. M.; Poole, G. C.; Hall, R. O.; Hamilton, S. K.; Peterson, B. J.; Tank,
609 J. L.; Ashkenas, L. R.; Cooper, L. W.; Dahm, C. N.; Dodds, W. K.; Findlay, S. E. G.; Gregory, S.
610 V.; Grimm, N. B.; Johnson, S. L.; McDowell, W. H.; Meyer, J. L.; Valett, H. M.; Webster, J. R.;
611 Arango, C. P.; Beaulieu, J. J.; Bernot, M. J.; Burgin, A. J.; Crenshaw, C. L.; Johnson, L. T.;
612 Niederlehner, B. R.; O’Brien, J. M.; Potter, J. D.; Sheibley, R. W.; Sobota, D. J.; Thomas, S. M.
613 Stream Denitrification across Biomes and Its Response to Anthropogenic Nitrate Loading. Nature
614 2008, 452 (7184), 202–205. https://doi.org/10.1038/nature06686.
615 (44) Briggs, M. A.; Day-Lewis, F. D.; Zarnetske, J. P.; Harvey, J. W. A Physical Explanation for the
616 Development of Redox Microzones in Hyporheic Flow. Geophys. Res. Lett. 2015, 42 (11), 4402–
617 4410. https://doi.org/10.1002/2015GL064200.
618 (45) Redeker, M.; Wick, A.; Meermann, B.; Ternes, T. A. Anaerobic Transformation of the Iodinated
619 X-Ray Contrast Medium Iopromide, Its Aerobic Transformation Products, and Transfer to Further
621 https://doi.org/10.1021/acs.est.8b01140.
622 (46) Schulz, M.; Löffler, D.; Wagner, M.; Ternes, T. A. Transformation of the X-Ray Contrast Medium
623 Iopromide in Soil and Biological Wastewater Treatment. Environ. Sci. Technol. 2008, 42 (19),
624 7207–7217. https://doi.org/10.1021/es800789r.
625 (47) Kormos, J. L.; Schulz, M.; Kohler, H. P. E.; Ternes, T. A. Biotransformation of Selected Iodinated
626 X-Ray Contrast Media and Characterization of Microbial Transformation Pathways. Environ. Sci.
627 Technol. 2010, 44 (13), 4998–5007. https://doi.org/10.1021/es1007214.
628 (48) Henning, N.; Kunkel, U.; Wick, A.; Ternes, T. A. Biotransformation of Gabapentin in Surface
629 Water Matrices under Different Redox Conditions and the Occurrence of One Major TP in the
630 Aquatic Environment. Water Res. 2018, 137, 290–300.
631 https://doi.org/10.1016/j.watres.2018.01.027.
632 (49) Hellauer, K.; Karakurt, S.; Sperlich, A.; Burke, V.; Massmann, G.; Hübner, U.; Drewes, J. E.
633 Establishing Sequential Managed Aquifer Recharge Technology (SMART) for Enhanced Removal
634 of Trace Organic Chemicals: Experiences from Field Studies in Berlin, Germany. J. Hydrol. 2018,
635 563, 1161–1168. https://doi.org/10.1016/j.jhydrol.2017.09.044.
636 (50) Trautwein, C.; Kümmerer, K. Incomplete Aerobic Degradation of the Antidiabetic Drug
637 Metformin and Identification of the Bacterial Dead-End Transformation Product Guanylurea.
638 Chemosphere 2011, 85 (5), 765–773. https://doi.org/10.1016/j.chemosphere.2011.06.057.
639 (51) Trautwein, C.; Berset, J. D.; Wolschke, H.; Kümmerer, K. Occurrence of the Antidiabetic Drug
640 Metformin and Its Ultimate Transformation Product Guanylurea in Several Compartments of the
641 Aquatic Cycle. Environ. Int. 2014, 70, 203–212. https://doi.org/10.1016/j.envint.2014.05.008.
642 (52) Bradley, P. M.; Journey, C. A.; Button, D. T.; Carlisle, D. M.; Clark, J. M.; Mahler, B. J.;
643 Nakagaki, N.; Qi, S. L.; Waite, I. R.; VanMetre, P. C. Metformin and Other Pharmaceuticals
644 Widespread in Wadeable Streams of the Southeastern United States. Environ. Sci. Technol. Lett.