HAL Id: halshs-00842265
https://halshs.archives-ouvertes.fr/halshs-00842265v2
Preprint submitted on 22 Sep 2014
HAL is a multi-disciplinary open access archive for the deposit and dissemination of sci-entific research documents, whether they are pub-lished or not. The documents may come from teaching and research institutions in France or abroad, or from public or private research centers.
L’archive ouverte pluridisciplinaire HAL, est destinée au dépôt et à la diffusion de documents scientifiques de niveau recherche, publiés ou non, émanant des établissements d’enseignement et de recherche français ou étrangers, des laboratoires publics ou privés.
Persistent Classmates: How Familiarity with Peers
Protects from Disruptive School Transitions
Son Thierry Ly, Arnaud Riegert
To cite this version:
Son Thierry Ly, Arnaud Riegert. Persistent Classmates: How Familiarity with Peers Protects from Disruptive School Transitions. 2014. �halshs-00842265v2�
WORKING PAPER N° 2013
– 21
Persistent Classmates: How Familiarity with Peers
Protects from Disruptive School Transitions
Son Thierry Ly
Arnaud Riegert
JEL Codes: I21, I28, Z13
Keywords: Friendships, Social Networks, High schools, Class composition, Peer effects
P
ARIS-
JOURDANS
CIENCESE
CONOMIQUES48, BD JOURDAN – E.N.S. – 75014 PARIS
TÉL. : 33(0) 1 43 13 63 00 – FAX : 33 (0) 1 43 13 63 10
www.pse.ens.fr
Persistent Classmates: How Familiarity with Peers
Protects from Disruptive School Transitions
∗
Son Thierry Ly
†Arnaud Riegert
‡Version 2, September 2014
Abstract
This paper investigates the effect of classmates’ characteristics on students’ achieve-ment in high school, exploiting natural experiachieve-ments occuring sporadically in French high schools. High school principals do not know their first-year students at the time they assign them to classes, so they do the allocation using only a limited set of information available on their registration files. In some rare cases, they have to assign to separate classes two or more students who look nearly identical, according to the information they observe in their files. We provide strong evidence suggesting that such first-year students are randomly assigned to their classes. When using these quasi-experiments to investi-gate the role of several classmates’ characteristics, we find an important, positive effect of assignment with more persistent classmates, i.e. classmates who were already in the freshman’s class before high school. We provide strong evidence that this result derives from the benefit of familiarity with peers, rather than from some unobserved ability char-acteristics of these classmates. The magnitude of the estimates suggests that grouping low-achieving freshmen who know each other could decrease their current repetition rate by around 13 percent, and raise their graduation rate by the same amount.
JEL codes: I21, I28, Z13
Keywords: Friendships, Social Networks, High schools, Class composition, Peer ef-fects.
∗We thank Éric Maurin, Julie Berry Cullen, Luc Behaghel, Gordon Dahl, Victor Lavy, Thomas Piketty, Corinne Prost, Gwenaël Roudaut, Camille Terrier and Margaux Vinez for their helpful comments and sugges-tions. We thank participants at the SOLE conference (Arlington, 2014), IWAEE conference (Catanzaro, 2013), PSE Applied Economics seminar and CREST internal seminar. We are also grateful to the statistical services at the French Ministry for Education (DEPP) and in particular Cédric Afsa who facilitated our access to the datasets. This research was supported by a grant from the CEPREMAP research center.
†Paris School of Economics / CREST.son.thierry.ly@ens.fr ‡Paris School of Economics / CREST.arnaud.riegert@ens.fr
Introduction
If peer effects exist, policies that influence the allocation of individuals with their peers could improve welfare. This idea has aroused a huge amount of interest by economists, despite the great empirical challenges raised by endogenous sorting. For example, many papers investigate the role of neighborhood (Goux & Maurin, 2007; Kling et al., 2007) and school composition (Hoxby, 2000; Angrist & Lang, 2004; Cullen et al., 2006; Lavy et al., 2012a) on students’ out-comes. The literature is much less extensive when it comes to estimating peer effects within classes, although most students’ interactions are likely to occur at this level. It is also un-fortunate from a policy point of view, because school administrators have much more leeway in setting up classes than policymakers have in influencing neighborhood and school choice. The main studies on the subject are based on experimental data either in primary schools in developing countries (Duflo et al., 2011) or in colleges in developed countries (Carrell et al.,
2011). Evidence based on observational data is rare (see e.g. Lavy et al., 2012b; Fruehwirth,
2013), since it requires both rich data at class level and conclusive natural experiments that are rarely available.
In this paper, we identify classroom peer effects by using natural experiments aroused by the specific institutional features of student allocation across classes, within schools, in the first year of high school in France (10th grade).1
By definition, a high school principal does not know her first-year students before the beginning of the school year. As she has to allocate them across classes before that time, she has only a finite set of information observed in their registration files to go on, including e.g. gender, socioeconomic status (SES), middle school and 9th grade class of origin, the list of optional courses and scores obtained in their grade 9 class. Using a unique administrative dataset, we are able to observe almost all characteristics observed by principals about their cohort of freshmen.
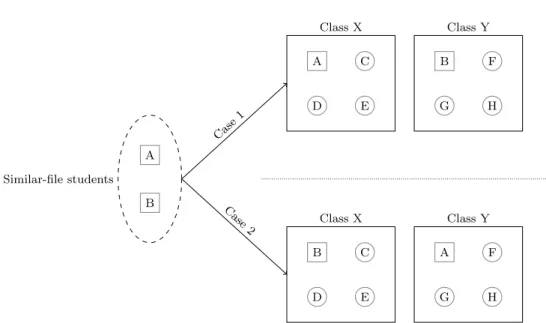
Usually, the registration files a given principal has to consider in a given school year are all different from one another. But there are rare cases where she gets two freshmen registration files that are exactly or very similar with regard to all these characteristics (denoted "similar-file" or SF students). For example, these two students, call them Aurélien and Benoit, are both low-SES boys coming from the same 9th grade class from the same middle school, who got very similar scores in grade 9, and ask for the same optional courses in grade 10. If the
1In France, secondary education consists of two blocks: middle school (grades 6 to 9) and high school (grades 10 to 12). High schools are generally separate from middle schools.
high school principal decides to separate them across two 10th grade classes X and Y, the key intuition is that the choice of assigning Aurélien to class X and Benoit to class Y or the other way around should be as good as random, because she does not have any additional relevant
information to distinguish between them (see Figure I). Note that we do not assume that the
decision to separate the students or to keep them in the same class is exogenous, but only that the assignment is random in case she decides to separate them. We are able to provide strong evidence supporting this assumption, using the anonymous scores obtained at the national exam taken by students at the end of 9th grade, which is unobserved by principals.
Our estimation strategy is as follows. First, we restrict our analysis to students who have a similar-file mate who ends up in a different class in the same high school. This is the case for only 0.8 percent of the population of high school freshmen, leaving us with a sample of 28,053 students over the 2004-2011 period. Then, our strategy is to compare a student with his or her similar-file mate only. We do this by controlling in all regressions for a single fixed effect accounting altogether for freshmen’s high school, cohort, middle school and class of origin, and all other characteristics observed in registration files. Finally, we investigate how the outcome gap between two similar-file students relates to differences in the characteristics of their 10th grade classes. In other words, the random assignment of Aurélien and Benoit between classes X and Y can be seen as a given lottery or quasi-experiment, and the whole set of comparable lotteries happening in French high school between 2004 and 2011 allows us to estimate the effect of a number of classroom environment dimensions.
Common measures of peer characteristics are considered, such as peer ability, gender and socioeconomic status (SES). Yet surprisingly, the most robust effect that emerges comes from the number of persistent classmates (PC) a student gets, i.e. classmates who were already in the freshman’s class in the last year of middle school. Not only does the number of PCs significantly reduce the risk of repeating freshman year, but by contrast with other measures of peer characteristics, the effect also endures in the long run and is associated with differences in graduation rates at the end of high school.
The second part of this paper sets out to understand why the presence of these persistent classmates generates positive spillovers. Although the number of PCs might capture some omitted class characteristics associated with peer ability for instance, our investigations suggest that students benefit from having more persistent classmates only because of a familiarity mechanism, i.e. because they know each other well. Three findings lead us to this conclusion.
First, the estimates are extremely robust to the inclusion or not of controls for the other classmates’ characteristics (ability, gender and SES). Second, we find that the PC effect is highly heterogeneous and mainly driven by low-achieving, low-SES students. Also, the effect seems slightly stronger when these students are suddenly more exposed to high-SES students. This is consistent with our interpretation, as being surrounded by familiar faces should matter more when the transition to high school is highly disruptive. Third, these students at risk of underachievement in high school are not more impacted by their high- than their low-achieving persistent classmates, which would be expected if the PC effect was driven by their higher unobserved ability. Robustness checks are provided for our main results.
This study makes three important contributions to the literature. First, it sheds light on the ongoing debate on the complexity of peer effects. While some recent studies offer an insight into the role of social networks during school transitions (see e.g.Lavy & Sand,2012), we use natural experiments that provide a stronger identification of the impact of classmates’ characteristics, including their social links. In keeping with Foster (2006), our results also take issue with popular belief that agents are more influenced by their friends than by other peers (see also
Halliday & Kwak,2012). In particular, students could be influenced by former classmates that are not friends, though there was no theoretical reason to expect classmate persistence to have positive effects.2
As a matter of fact, recent results found by De Giorgi & Pellizzari (2013) on Bocconi University were suggesting the opposite, as they find a decrease in performance for undergraduate students that are assigned more often together across classes. Our results show that former peers generate positive spillovers when reassigned together in the context of school transitions, emphasizing how peers may not have the same effect depending on the timing and contexts.
Second, our findings need to be considered in relation to the strand of literature on the impact of mobility across environments. Several papers find that policies that enhance neigh-borhood or school choice, or expand students’ access to high-performing schools have been
2 On the one hand, former classmates may be friends, and recent evidence suggest that friends may have a positive effect on well-being and achievement (Calvò-Armengol et al.,2009; Lavy & Sand,2012) Yet former classmates may also simply be peers with whom it is easier to talk during the early weeks, to sit next to in the classroom or to ask for help, thus making it easier to adapt to higher academic expectations and less supervision from teachers. Even without friendship bonds, familiarity within the classroom could therefore reduce anxiety, prevent social isolation and foster a student’s sense of belonging in the new school and class. On the other hand, former classmates could prevent students from socializing with new peers, or be conducive to bad behavior in the classroom if disruptive students stay together. Former classmates may also be enemies rather than friends, and their presence could be detrimental to welfare and achievement. Mora & Oreopoulos (2011);Lavy & Sand
(2012) show that "non-reciprocal friends" (peers that consider you as a friend while you do not, or vice versa) seem to have no or negative effects on outcomes.
unexpectedly inefficient in improving students’ educational outcomes (Angrist & Lang, 2004;
Cullen et al., 2006; Kling et al., 2007). In line with other recent works (Lavy & Sand, 2012;
Gibbons et al., 2013), this paper suggests that these results could be due to the disruption
caused to a student’s environment by such policies.
The third contribution is more policy-oriented. Policy recommendations to improve achieve-ment in high school are particularly relevant, in view of the issues at stake. In many countries, formal tracking is implemented in high school, such that short-term low achievement in the first year may end up with mismatched enrollment in low-skill tracks. In addition, the start of high school is often simultaneous with the end of compulsory schooling, meaning that under-achievement may lead to drop-out at that stage compared to previous stages. As our analysis show, principals could substantially raise the achievement in high school of low-ability students by assigning them in freshman year with some familiar classmates. Our estimates suggests that their risk of repeating freshman year could be reduced by 4.5 percentage points, and their grad-uation rate raised by the same amount. This simple recommendation on class composition may thus improve their performance by around 13 percent at no cost, while highly expensive poli-cies usually target this population of students at risk. Moreover, moving these students across classes based on their former networks is not a zero-sum game, in contrast to their ability or gender. Although a high-ability student or a female student might be of benefit to everyone,3
grouping together freshmen from the same class should not affect freshmen from other classes.
Section 1 describes the institutional context and the data. Section 2 describes the
iden-tification strategy. We present the results and discuss the distribution of the effect and its mechanisms in section 3. Robustness checks are then provided in section 4. Section5discusses the implications of our results and concludes.
3
Carrell et al.(2011) built an algorithm designed to optimize peer effects and failed to do so partly for this reason.
1
Institutional context and data
1.1
The high school curriculum in France
1.1.1 Enrolling in general high schools
By the end of middle school (grades 6 to 9), students apply for either vocational or general studies, with the approval of middle school teachers. Around two-thirds of 9th grade students opt for the general track, in which case they apply to general high schools in their district.4
Rules of admission then differ by school district and year, but they usually depend on the students’ home address, socioeconomic status and school performance (9th grade scores). Allocation is over by the end of June and high school administrations receive the registration files on their future 10th graders in the first week of July.
At the same time, 9th grade students take national anonymous exams in the end of June in three core subjects: mathematics, French and history-geography. These exams are not graded by teachers from the student’s middle school, but externally (with scores between 0 and 40). The resulting anonymous scores are combined with continuous assessment scores, i.e. scores obtained in 9th grade in all courses and graded by the students’ own teachers (between 0 and 20). The anonymous scores and continuous assessment scores are combined to compute a total score that determines whether they pass the middle school graduation diploma (Diplôme national du brevet or DNB hereinafter).5
The anonymous scores are only available in mid-July. By that time, students have completed their administrative registration for high school and class compositions are already determined.
In addition, these scores are not sent to the high school during the summer6
. Therefore, the principals assign freshmen to grade 10 classes without knowing their anonymous scores, and only having their continuous assessment scores.
4Students opting for the vocational track have to choose a specialty, and vocational high schools usually have places in only one or two classes per specialty. We have therefore decided to exclude vocational high schools from this study, since class composition is highly constrained and is not really policy-relevant in these schools.
5 Note that students do not need to pass to go on to high school. 6
Some students do inform the high school of their results in the anonymous exams once they receive them (although this is not a requirement), but informal discussions we have had with some high school administrations suggest that this hardly ever happens. In any case, principals do not have these scores for all students, so they are highly unlikely to use them to assign students across classes.
1.1.2 The curriculum in general high schools
In France, freshman year marks a difficult milestone for students attending general high schools. The average ability of peers raises suddenly as one third of students, usually the lowest achieving ones, has enrolled in vocational studies after middle school. This may not only increase teachers’ expectations, but it might also affect negatively students’ self-esteem. Students’ percentile rank within their class drops from 64 to 52 in average between grade 9 and 10. Naturally, this change hits students asymmetrically. While students in the top half of the ability distribution only fall from the 78th to the 71st percentile rank, the other half drops from the 49th to the 32nd percentile rank.7
Students also undergo a shock in the sociocultural dimension, as reflected by the share of high-SES that increases from 22 percent in middle school to 30 percent in general high school.
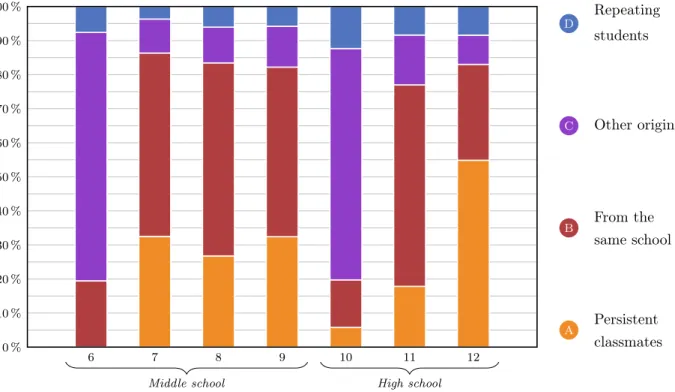
At the same time, the school change triggers an intense disruption in students’ networks, as illustrated by the amount of persistent classmates in their class. Figure II plots the typical student’s class composition for each grade. As a benchmark, the share of persistent classmates
remains fairly constant throughout middle school at around 30 percent.8
Yet in grade 10, the number of PCs drops dramatically. Only 5 percent of their classmates come from the same class and 20 percent from the same middle school. Assuming that students rarely know the students from other middle schools, this means that students do not know at least 80 percent of their classmates at the beginning of the year. This figure decreases again in the subsequent grades, coming to 45 percent in grade 12 due to the partial carryover of major-specific classes from grade 11.
It turns out that these disruptions happen precisely at a time when achievement is highly determinant for long-term outcomes. By the end of the year, students have to apply for a major that will determine their 11th and 12th grade courses, their baccaulauréat (high school graduation exam) specialty, and the university tracks they will be able to apply for at the end of high school. First, students have to opt for the academic or technological track, the former being historically more prestigious with harder, more academic courses. If students are not accepted for any of the majors they apply for, they can opt for an alternative major suggested by teachers, if any. Otherwise, they have to repeat grade 10 with a view to applying again the
7
These figures are computed using the anonymous exam scores at the DNB exam. 8
In grade 6, we are only able to identify students from the same elementary school, as we do not have any information on the classes in grade 5.
following year.9 As a result, repetition rate is exceptionally high in the first year of high school (10 percent compared to 5 percent in average in middle school).
Lastly, high school ends at grade 12 with the baccaulauréat exam. This high school gradua-tion exam includes anonymous tests in different subjects depending on the student’s major, and is almost entirely graded by teachers outside the student’s high school. Passing the baccaulau-réat is required in most higher education tracks, and it is sufficient to access most university tracks.
1.2
The class-assignment mechanism
In France, students are assigned to the same class for all subjects for the entire school year. Classmates therefore have even more potential influence over each other’s outcomes, as they spend most of the day together throughout the school year. In practice, classes are assigned in early July immediately following student registration for high school, and two months before the start of the school year in September. Classes are assigned entirely by hand, without the aid of computer algorithms. This process is non-random, even for first year students. However, unlike with the other grades, high school principals do not know the students personally when they assign them to classes. Consequently, high school principals rely solely on the set of formal registration data given in the students’ files and observable, for the most part, in our dataset.10
First, principals look at the options chosen by students. While most courses are part of the common core curriculum and are the same for all (e.g. mathematics and French), students have certain subjects to choose from such as which foreign language they prefer to study (e.g. English or Spanish) and some additional optional courses (e.g. Latin and ancient Greek). Students who take the same options are often grouped in the same class, for the sake of convenience when
9 Students not allowed to move up to the next grade may appeal the decision to a committee external to the school, whose decision is final. Those refused permission to enroll in the major of their choice may appeal the decision to the principal or even negotiate with a different high school. In any case, the final decision to award a student a place on a given major rests with the principal of the high school attended in 11th grade. The principals we met reported that very few students in each year actually go against their teachers’ advice.
10
High schools are usually separate from middle schools. However, 16 percent of French students attend schools that cover the entire secondary curriculum (mostly private schools). In these schools, principals might know 10th grade students coming in from their own middle school. Nonetheless, middle school and high school still have separate deputy heads to whom principals generally delegate class composition. These deputy heads do not necessarily coordinate over class assignment of 10th grade students, such that the high school deputy heads may well not use any more information than the registration file. This is supported by our exogeneity test (see section2.1), which suggests that students are conditionally randomly assigned even in this case. We have therefore chosen to keep students from these schools in our sample. Taking them out of the sample has virtually no impact on the results.
timetabling classes.
Conditional on students’ options, school principals generally (but not necessarily) try to balance classes in terms of gender and ability.11
They rely on the formal data contained in students’ personal registration files: personal details on the students and their families (mainly gender, age and parents’ occupations), scores obtained in 9th grade subjects (between 0 and 20) and 9th grade teachers’ comments. These short comments are not written for principals but for parents, to assess student performance and behavior in each subject. For example, teachers may write that they are satisfied with the student’s effort and participation in class, or that the student talks too much with his or her classmates in class (without naming names). These reports do not include recommendations to high school principals such as, "Do not put these two students together". Only on the rarest of occasions would such advice be given to principals, and then via an informal channel.
Unlike with other grades where principals know their students, they cannot count on any personal knowledge of them such as motivation or emotional resilience.12
In addition, in French high schools, neither parents nor students can ask for placement in specific classes or with friends. As a rule, families do not liaise directly with principals over class assignment.13
Instead, tactics to get children assigned to a better class mainly take the form of choosing specific options. In particular, families may encourage their children to take "elite" options (e.g. German as a first foreign language, or Latin) to get them assigned to a better class. This has no impact on our identification since we only compare students taking the same options. Lastly, students are only notified of their class assignment the week before the first day of school, and they are not allowed to change it.
There are good reasons to believe that principals do not use all the detailed formal data they have on students to assign them to a class. As revealed by the class assignment sessions we attended, simply allocating classes on the basis of options is already complicated and time-consuming enough as it is. Again, they have to do it by hand and take a large number of constraints into account, while a host of other tasks are pending both to wind up the
11 There is no legal requirement to do so, but the 1975 Haby Act that made middle schools comprehensive established a tacit rule for schools to favor within-class heterogeneity. Besides, principals probably want to avoid putting all low-achieving students together in one class that consequently risks being unruly.
12 With other grades, they might, for example, separate two friends who are disrupting lessons, or place a fragile student with his or her friends for emotional support.
13
They do so only in very special cases, such as where car sharing needs to be organized for students in rural areas.
current school year and prepare for the new one. Therefore, if two freshmen’s registration files look broadly similar, principals are highly unlikely to spend time studying their characteristics to try to find some minor detail to differentiate between them. In particular, principals do not telephone families or middle school principals to get further information on students. In practice, then, two 10th grade students do not need to be exactly identical on paper to be
deemed indistinguishable during the class assignment process. Section 2 provides empirical
evidence in support of this field observation.
1.3
Data
1.3.1 Datasets
The empirical analysis is based on two administrative datasets from the French Ministry of Education.
• Administrative registration records: for all students enrolled in French public and publicly-funded private middle and high schools from 2001 to 2012. This dataset contains students’ personal details (e.g. date and region of birth, gender and parents’ occupation) and information on their education: in particular grade, school and class attended, options taken, grade and school attended in t − 1 (but not the class attended in t − 1).
• Examination records: for all students from 2004 to 2011. This dataset contains per-sonal details and informal scores in the 9th grade DNB (both the anonymous exam and continuous assessment scores) and 12th grade baccaulauréat exams.
These datasets are exhaustive and the variables we make use of are well reported for almost 100 percent of the population. Unfortunately, students do not have personal identification numbers so that they can be tracked through the different datasets. Yet for each 10th grade student, we need to know at least which class they attended in 9th grade, their grade in t + 1 (repeating 10th grade or moving to 11th grade) and chosen major if they do move to 11th grade. We also have to match the administrative and the examination records.
In order to find this missing information, we use a matching procedure taking the students’ personal details in each dataset. The procedure is based mainly on date and region of birth, gender, grade and school attended in years t and t − 1. We manage to match 9th grade class
for 94 percent and DNB exam scores for 81 percent of new 10th grade students. The remaining students either had no match in the auxiliary dataset (60 percent of occurrences) or multiple
matches (40 percent of occurrences).14 The online appendix provides further details on the
matching procedure. In the rest of the paper, all regressions include controls for the share of missing observations in the class, although they do not change the estimates.
Our identification compares the set of information on students observed in our dataset to the information observed by principals in their registration files at the time of class allocation. So it is useful at this stage to summarize which variable is observed by whom:
• Covariates observed by both the principal and the econometrician: Date of birth, city of residence, gender, parents’ occupation, foreign languages and options chosen, 9th grade continuous assessment scores in all subjects, middle school and 9th grade class. We also observe a numerical measure of student behavior as graded by the student’s head teacher; this information is missing for the first two cohorts (out of eight) and it will therefore be used only for robustness checks.
• Covariates observed by the principal, but not the econometrician: Students’ first and last name (from which, in particular, ethnicity could be inferred), and exact home address. The principal also observes the 9th grade teachers’ written comments, which may inform of behavioral issues. Again, these comments are very short (one sentence from each teacher), written for parents, and do not include information about the relationships with specific students.
• Covariates observed by the econometrician, but not by the principal: Anonymous DNB exam scores.
Most information observed by the principal is thus contained in the dataset. Although we do not observe the teachers’ written comments, we do observe a behavioral score for three-quarters of the sample, which contains precisely the information we expect the principals to
infer from the written comment15
. As we will show, the anonymous DNB exam scores are key in this study, since they allow us to test our main ientification assumption.
14
A multiple match means that two students are found in the same school × grade × year with the same date of birth, gender, etc.). This may occur only randomly and is not likely to bias our results.
15
Note that it would be hard, in any case, to work directly with the written comments even if we could observe them. If we were to do so, we would try to build a score to summarize the information contained in the comment, which is the purpose of this behavioral score.
Descriptive statistics are presented inTable Ifor the entire population of 10th grade students (column I). In particular, it is interesting to note that the average freshman has 1.7 persistent classmates out of the 8.3 former classmates enrolled in their high school.16
16
The ratio is roughly equal to 5, the average number of classes in high schools, suggesting that principals do not try to group students having the same class of origin when allocating them among 10th grade classes.
2
Identification
The identification strategy used in this paper is based on a quasi-experimental setting. Since principals do not know first-year students personally, principals cannot easily distinguish be-tween two students who are similar "on paper", i.e. who exhibit identical or very close regis-tration files. If such students are separated into different classes, it is credible to assume that they were randomly assigned to their classes. Therefore, classroom peer effects are identified by sticking to comparisons between students coming to a given high school with the same observable characteristics, but ending up in different classes. Such students form what we call "similar-file" groups (or SF groups), and all comparisons throughout the paper are made between students belonging to the same SF group.
Figure I illustrates this approach, where students A and B have close observable
character-istics. If the high school principal has to split them between classes X and Y, we assume that the decision between assigning A to X and B to Y (case 1) or the reverse (case 2) is as good as random. Therefore, the differences between students A and B’s classes (e.g. characteristics of classmates C-D-E compared to F-G-H) are uncorrelated with differences in individual un-observed factors of achievement, allowing for causal inference of peer effects. Classroom peer effects can be estimated by examining the correlations between students A and B’s gap in outcome and differences in their class characteristics.
Formally, we estimate the following model using OLS:17
yigc = αg+ β · Cigc+ ǫigc (1)
where yigc denotes high school outcomes for student i, assigned to 10th grade class c and
be-longing to SF group g, as in model (3), Cigc is a vector of class characteristics (e.g. peer ability,
female share, or i’s number of persistent classmate), and ǫigc captures individual unobserved
factors of achievement. αg is the SF group fixed effect that restricts the analysis to
compar-isons within groups of students with similar registration files and is the key to identification. Indeed, β captures the peer effects of interest under the key assumption that 10th grade class
17 Although our estimation strategy is similar in spirit to exact-matching methods, we choose not to use matching estimation as the regressors examined in this paper are not binary. To our knowledge, the literature is very poor when it comes to the estimation of average causal effects of multi-valued treatments by propensity score or exact matching methods (seeImbens,2000, from this point of view).
characteristics Cigc are not correlated with ǫigc conditional on g:
Cigc ⊥ ǫigc|g i.e. Cov(Cigc, ǫigc|g) = 0 (2)
By controlling for SF group fixed effects, model (1) estimates β parameters only by
com-paring separated similar-file students with each other, as long as their classrooms differ on Cigc
dimensions (in particular, we do not compare students who are separated versus students who end up in the same class).
In what follows, we describe how we define SF groups before providing empirical evidence supporting assumption (2).
2.1
Definition of similar-file groups
The natural experiments consists in students who enrolled in a given high school and year with the same or very similar observable characteristics from the principal’s perspective, but assigned to different classrooms. These groups of students, denoted g ∈ {1, . . . , G} and called SF groups, are defined using all variables that we observe on first-year students’ registration files. We consider that students belong to the same "similar-file" groups only if they come from the same 9th grade class in middle school; enroll in the same high school in the same year; select the same options (i.e. same foreign language and optional courses); share the same gender, age18
and social background (low- or high-SES) based on father’s occupation; belong to the same quintile of average 9th grade continuous assessment score in scientific subjects (mathematics, physics-chemistry, and biology); belong to the same quintile of average 9th grade continuous assessment score in humanities (French, history and foreign languages)19
; and belong to the same decile of average 9th grade continuous assessment score across all subjects listed above.20
Note that continuous assessment scores are binned into deciles or quintiles in order to have enough cases where at least two students share the exact same values for all
18
We do not look at the exact date of birth but only at whether the students have repeated at least one year: age is broken down to just one dummy variable.
19
The foreign languages score is the weighted average of the student’s main foreign language (weight = 2/3) and second foreign language (weight = 1/3). Using different weights does not change the paper’s results. Note that the continuous assessment score in history is missing for 5.4 percent of observations. For these students, the average humanities score is the average of the French and foreign languages scores only.
20Two students who belong to the same average score decile across all subjects may have very different subject-specific profiles: one may have high marks in sciences but not in humanities, or vice versa. Principals most probably differentiate between such students. This explains why we add quintiles of scientific and humanities scores separately, aside from the average score decile.
observed characteristics. We show in section 4.1 that our estimates are unsensitive to using narrower or wider bins.
This definition of SF groups leaves us with 32,492 groups of SF students, 13,680 of which include students who were not assigned by their principal in the same 10th grade class.21
The total sample of SF students for which class effects can be estimated thus comprises 28,053 students out of an initial population of 2,897,986 10th grade students covering eight cohorts.22
Model (1) is estimated on this "SF sample" of 28,053 students that have at least one similar-file mate ("SF mate") while ending up in separate classes, corresponding to 13,680 separate
natural experiments. Each student is only compared to his SF mate since we control for αg
fixed effects. This single fixed effect controls altogether for years, class and middle school of origin, high school of destination and all other characteristics observed in students’ registration files. Therefore, there is no need to control separately for high school or year fixed effects, or for individual characteristics.
Overall, these students are allocated to 22,162 different classes. Over the whole SF sample, 10,461 students are assigned to the same class as at least one student from another SF group. When estimating model (1), standard errors are therefore clusterized by 10th grade class using Moulton formula, although this only impacts standard errors at the margin as the clusters are very small in size.
2.2
Empirical evidence of random assignment
The definition of SF groups we just described is already very restrictive. Considering principals’ time constraint, they may not look for additional information to decide which one of the two students they assign to which class. As we described in section 1 however, there is still a few information they have that might be used. Assume, for instance, that there is substantial
21
A total of 8,341 of the 32,492 SF groups are characterized by a set of optional courses that are only available in one high school class. Thus, these groups could not have been split up in any case. We conclude that the principals split up 13,680 SF groups out of 24,151 (57 percent) groups that could be split. The reason for separating out a group of SF students across different classes might be endogenous to potential outcomes, but does not affect our strategy. We only assume that, conditional on separating out SF students across different classes, principals decide randomly which students they assign to which class.
22
This population excludes 10th grade repeaters, but also newcomers for whom data on 9th grade exam scores is missing. Note that our definition of SF groups allows only 1 percent of the population to come to high school with at least one other student (only one out of 93 percent) who shares the same values for Xi, while ending up in different classes. This illustrates just how much our identification approach calls for a very rich database: only a large initial pool of students can yield a sample of SF students large enough to get accurate estimates of peer effects.
variation in ethnicity captured by names, even conditional on g, and that these variations are correlated with potential outcomes. If they are also taken into account by the principal when assigning these similar-file students to different classes, and if they are correlated to ǫigc, then
assumption (2) is false and our results would be biased. The same argument holds for teachers’ small written comments on students’ behavior, that we do not observe.
2.2.1 Balancing test using anonymous exam scores
A first way to provide supporting evidence of the validity of assumption (2) is to exploit one
information we do observe that principals do not: the students’ anonymous scores Ai obtained
in the national DNB exam just before entering high school. If conditional on g, principals do assign students based on some information we do not observe and that is correlated with
potential outcomes, then some correlation between class characteristics Cigc and anonymous
exam scores Ai should be observed, again, conditional on g. For instance, if 9th grade teachers
feel a student is disruptive enough to warrant mentioning it in their written report, then they probably underscore his or her performance in class (as measured by continuous assessment scores). Therefore, disruptive students should display higher anonymous exam scores on average than their SF mate(s) with no behavioral issues, since SF students have very close continuous assessment scores by construction. This can be shown empirically taking our data on 2006-2011 cohorts, for which the behavior score NVS is available. A regression of Ai on NVSi controlling
for g (which includes continuous assessment scores) exhibits a negative correlation of −0.059 with a 0.020 standard error. It shows that when teachers report that a student’s behavior is worse than his or her SF mate, this student gets a higher score in the anonymous DNB exam, proving that they have been underscored in class.
Aican thus be used to examine whether assumption (2) of a random assignment conditional
on g is credible. We do so by estimating the following model:
Cigc = αg+ β · Ai+ uigc (3)
where Cigc is any of class c’s characteristics and g is the index denoting "similar-file" (SF)
groups, i.e. the groups of students sharing a specific vector of values for Xi. Adding αg to
the model constrains the regression to compare students solely with their SF mate(s). Under assumption (2), we expect β to be equal to zero.
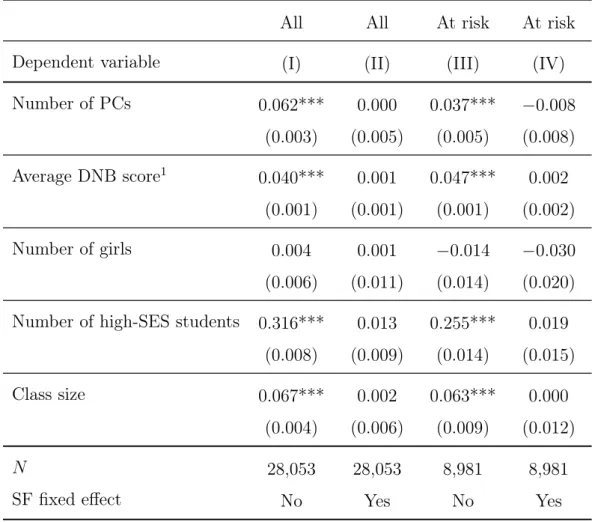
Table II reports the estimated β parameters of model (3) for the entire SF sample for a
number of class characteristics Cigc (columns I and II). Column I measures the raw sample
correlations between ability and class characteristics, i.e. without the αg fixed effect. In the SF
sample, more able students are assigned to larger classes and with more persistent classmates; their classmates are also higher-achieving students, more often female and high-SES. All these correlations are statistically significant at the 1 percent level, except for the number of females. However, these correlations vanish within SF groups: as soon as we include the SF fixed effect, the estimates for β become very small and non-significant for all class characteristics
(column II). In other words, for students who were similar with respect to Xi at the time of
class assignment in a given high school and year, remaining differences in ability (unobserved by principals) have no correlation with differences between class characteristics.23
This is a very strong result in favor of assumption (2). It clearly suggests that principals do not use any achievement-related information we do not observe to decide on class assignment for separated SF students, and thus split them up randomly (or at least exogenously to potential outcomes). In actual fact, this result is far from unrealistic since SF students are similar across many variables, and the remaining vector of information is very small in comparison (names and teachers’ written comments). It is absolutely consistent with our field observations that principals do not have time (or do not take time) to differentiate between very similar students.
Another possible scenario is that principals do consider the remaining information and that the latter are indeed correlated with potential high school outcomes, but without being
correlated with DNB test scores. In other words, testing for imbalances in Ai would not be
relevant since anonymous DNB scores are not a good measure of all unobserved determinants ǫigc of achievement in high school.24 Yet we argue that this is very unlikely, since principals
do not observe DNB scores. It is therefore hard to imagine that principals would use the few information we do not observe to separate SF students in a way that is correlated with ǫigc but
without any correlation with Ai as shown in Table II.
Table II also reports the results of the exogeneity test for a subsample of "at risk" SF students (columns III and IV). We define them as SF students who are low-achievers (below
23
We provide two additional tests in the online appendix. First (Table A.I), we show that the results hold when we use more detailed class characteristics regarding the number of persistent classmates of each type (low-or high-ability, same (low-or opposite gender). Second (Table A.II), we estimate equation (3) the other way around, i.e. regressing Ai on all class characteristics Cigcat the same time, thus measuring partial correlations between ability and each of the class characteristics. The conclusions of both these tests are identical toTable II.
24 For instance, a student’s level of autonomy may be more important to high school achievement than achievement in the DNB exam.
the median score of their middle school of origin) and low-SES. As we show in section3.2.1, our main results regarding the positive effect of keeping classmates in the transition to high school are driven mostly by this specific subsample. For this reason, we check that the exogeneity test performs well for these students, as reported in columns III and IV of Table II. Therefore, we conclude that the SF students driving our main results are credibly exogenously assigned to their classes.
All in all, our definition of SF groups appears to be most suitable to estimate the causal effect of class environment on students’ outcomes. Checking the robustness of our results to other specifications, we show in section4.1that our results barely change when using alternative specifications that are more or less restrictive.
2.2.2 Additional evidence of random assignment
When defining the g groups of SF students, we do not require students to share a similar behavioral score (Note de vie scolaire or NVS). This is because this score is not available for the first two cohorts, so including it would force us to remove one-quarter of our sample. However,Table IIsuggests that it does not constitute a threat to our identification assumption.
Otherwise, the resulting allocation of SF students would create a correlation between Cigc
and Ai conditional on Xi, since anonymous DNB scores are correlated with behavioral issues
conditional on teachers’ grades (see above).
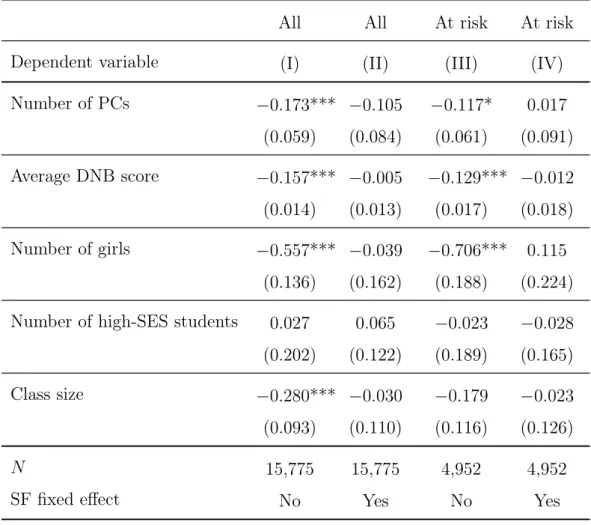
Additional evidence that principals do not take behavioral considerations to differentiate SF students can yet be provided. This is done by checking whether differences in class charac-teristics Cigc are correlated with potential differences in the NVS score in cohorts 2006 to 2011
(when the NVS score is available). We do so by estimating (3) after substituting Ai with a
dummy for having an NVS score beneath the 10th percentile (equal to 15 out of 20).25
Results are presented inTable III. Most correlations between student behavior and class characteristics are both very small and non-significant at standard levels as long as comparisons are restricted within groups of SF students. This is true for both the entire SF sample (column II compared to column I) and the subsample of SF students at risk who drive our main results (column IV compared to column III).
25
The NVS score has a very specific, negatively skewed distribution. 33 percent of students have the maximum score of 20 since they exhibit no disruptive behavior. The average score is 18, while the median score is 19. Therefore, we choose to define students with disruptive behavior as students with a score below the 10th percentile, which is precisely equal to 15 out of 20. Our results are not sensitive to the choice of threshold.
Lastly, we run additional tests whose results are not reported for the sake of brevity. Firstly, all the analysis work presented in this paper is repeated for the 2006-2011 cohorts, constraining SF students to share a similar NVS score. Similar results are systematically found, though the estimates are less accurate. Secondly, we check whether differences in the continuous variables included in the definition of g groups (notably continuous assessment scores) conditional on their binned values are correlated with class characteristics Cigc. Once again, the correlations
are mostly small and not significantly different from 0, especially for the subsample of students at risk of underachievement.
Overall, the empirical evidence strongly supports assumption (2) that high school principals randomly assign separated SF students (as defined in section 2.1) to their classes, or at least exogenously to achievement potential outcomes. The separation of similar-file students across 10th grade classes creates differences in educational outcomes that can therefore be attributed on average to differences in class characteristics.
2.3
Description of the SF sample
Descriptive statistics on the SF sample compared to the initial population are presented in
column II of Table I. All in all, students from the SF sample appear to be slightly higher
achievers than the population of high school freshmen as a whole. Yet the differences are not always large in magnitude, although they are statistically significant. For example, the average DNB test score is 25.1 (sd = 5.6) in the SF sample compared to 23.9 (sd = 5.1) for the population as a whole. 15.0 percent of the SF sample repeat 10th grade as opposed to 15.3 percent of the total population, a difference that is again very small.26
Column III reports the same descriptive statistics for the subsample of SF students at risk. By construction, these students are very low down on the ability distribution. They have an average normalized DNB score of −0.76, repeat grade 10 almost 2.5 times as often as the average student in the population, and graduate from high school almost half as much.
26In terms of schools attended, SF students are found in 1,851 out of 2,679 high schools, i.e. 69 percent of all high schools. The high schools that do not get SF students are mostly very small schools, in which the chances of getting two students with the same registration files are small. They have 66 students on average in grade 10, versus 259 on average for high schools with SF students. Overall, the high schools containing SF students account for 91 percent of all 10th grade students.
3
Results
3.1
Freshman-year class characteristics and achievement
Given assumption (2), differences in class characteristics between SF mates are orthogonal to differences in individual unobservable characteristics. Therefore, conditional on g, regressing outcomes on any class characteristic – e.g. classmates’ average ability – identifies a contextual effect that is not attributable to unobserved individual characteristics. Yet since classes differ in several ways simultaneously, the result of such a regression could be driven by some correlated, omitted class characteristics – e.g. the number of females. Hence as a first step, we attempt to figure out which aspect of the class environment is correlated with achievement, by regressing
outcomes on several observed characteristics at once. We estimate model (1) where Cigc is
a vector of peer characteristics commonly studied in the literature (average ability,27
number of female students, number of high-SES students and class size), completed by the student’s number of persistent classmates.
We consider different outcomes measured throughout the high school curriculum. The four first outcomes pertain to students’ possible outcomes at the end of freshman year: repeating grade 10, dropping out,28
enrolling in an academic or technological major.29
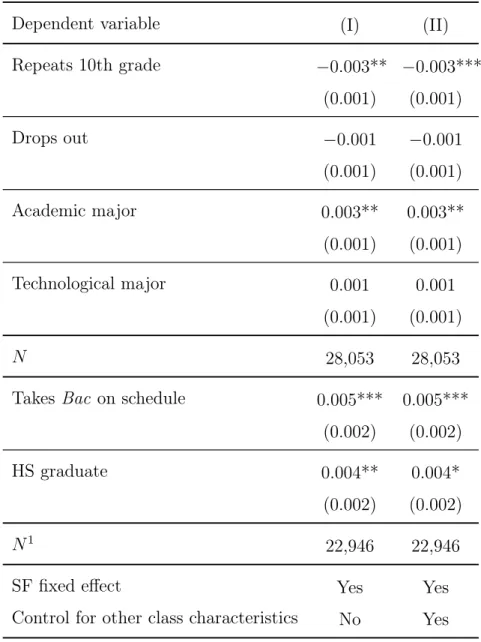
Results are reported in columns I to IV of Table IV. The number of persistent classmates
is positively associated with achievement at the end of grade 10. On average, each additional persistent classmate a student gets with regard to her similar-file mate reduces her risk of repetition by −0.3 percentage point (pp.) and similarly raises enrollment in an academic major (se = 0.1 pp.), with small and non-significant effects on drop-out and enrollment in a technological major.30
One additional female classmate reduces the risk of repetition by
27
As measured by the DNB score. Because this data is missing for all repeating students (around 10 percent of classmates) and for another 20 percent of classmates (not matched, see section1.3.1), we also include quadratic controls for the shares of repeating students and missing data.
28
As described in section 1, this "drop-out" measure picks up attrition due both to matching issues and actual drop-out. Since class environment is unlikely to substantially affect the matching procedure though, we believe this measure adequately captures the effect of class characteristics on the risk of drop-out.
29
We also estimated model (1) without controlling for the SF fixed effect to get the raw sample correlations. Basically, the number of persistent classmates displays positive, significant correlations with all outcomes, with larger estimates than those obtained with model (1). However, contrary toTable IV’s estimates, the classmates’ average ability and female share are respectively positively and negatively associated with achievement. Detailed results on raw correlations are reported in the online appendix (Table A.III).
30We examine whether one academic major drives the effect, but find the same positive, non-significant effect on enrollment in sciences, humanities and social sciences. Results on specific major enrollment are not reported for the sake of brevity, but are available on request.
0.1 pp. on average. This positive relationship between female peers and school achievement is consistent with the results found by other studies (Hoxby, 2000; Lavy & Schlosser, 2011).31
Classmates’ average ability is negatively associated with performance. A one standard deviation in the classmates’ average DNB score32
significantly raises the risk of repetition by 3.8 pp. on average, but reduces both the drop-out rate and the probability of enrollment in an academic major. Peer ability displays effects that are therefore unclear.33
. The number of high-SES students also has a negative effect as it significantly increases the risk of dropping out, but its magnitude is rather small. Finally, we find no class size effect, most likely because of the small variance between classes in a given high school (the standard deviation of class size is only 1.9 students within SF groups).
Table IV also reports results for two outcomes measured later than the end of 10th grade.
Column V shows the effect of freshman-year class characteristics on the probability of students taking the baccaulauréat exam "on schedule", i.e. three years after entering high school, mean-ing that they do not repeat grade 10 or grade 11 and that they make it through grade 12 without dropping out. Then, column VI investigates whether students with more persistent classmates in grade 10 are also more likely to pass the exam at that time. Interestingly, only the number of persistent classmates has a clear and enduring effect over time. Three years after entering high school, SF students who gain an additional persistent classmate in their freshman year are still more likely to take the baccaulauréat exam at the end of grade 12. This result implies that the reduction in 10th grade repetition is not cancelled out by a higher propen-sity to repeat grade 11 or drop out of grade 12. Furthermore, they do not seem to perform any worse than others over these years, since they are also more likely to graduate from high school. In comparison, all other class characteristics display estimates that are rather small in magnitude and never statistically significant. Thus, the number of PCs seems highly relevant to capture the dimension(s) of class environment that matter, even more so than other, classic peer characteristics commonly studied in the literature.
31
When adding an interaction term between own gender and the number of female classmates, we find that this effect is driven entirely by female students (no effect on males). Note that controlling for this interaction term does not change the estimate of the PC effect. This rules out the interpretation of the PC effect as capturing the impact of assignment to same-sex classmates.
32
The standard deviation of classmates’ average ability within SF groups is only 27 percent of an average DNB score standard deviation.
33
The results obtained in the literature as regards the effect of peer ability are also mixed and inconclusive. Here, the negative peer effect is consistent with the impact of a lower relative position within the class, because students may look weaker to teachers when assigned with better classmates. This may have little effect on drop-outs, but it would raise their risk of repeating grade 10 and at the same time reduce their chances of admission on an academic major track.
Yet it is unclear what the number of PCs actually measures or captures. SF students’ persistent classmates could affect them by means of mechanisms implying all sorts of unobserved characteristics that generate peer effects, such as ability and motivation. In the following, we provide strong evidence suggesting that the PC effect does not capture an ability peer effect, but rather works through a social network mechanism. As we will show, the most consistent interpretation of the data is that students simply benefit from getting peers they know and with whom they are used to interacting.
3.2
The protective role of familiarity with classmates
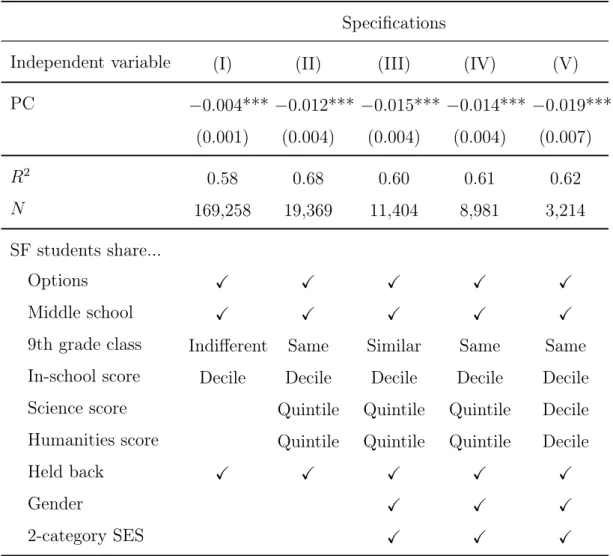
We first check that controlling or not for other class characteristics does not affect the PC estimates. In Table V, we report the previous estimates of the effect of PCs from regressions
where Cigc is the full vector (column II). In column I, the effect of the number of PCs is
estimated without controlling for the other class characteristics. The estimates are virtually identical for the two regressions, indicating that PCs are not correlated with these other class characteristics.34
This first piece of evidence strongly suggests that the number of persistent classmates does not capture any other omitted dimension of class environment. Suppose, for instance, that SF students’ persistent classmates had specific characteristics associated with higher performance, which benefit SF students without any link with familiarity. Considering
Table V’s results, such characteristics should not be correlated with DNB score, gender or SES.
In other words, to be consistent withTable V’s pattern, any credible omitted class characteristic driving the PC effect would have to be uncorrelated with all other observed class dimensions in Cigc. It is highly unlikely that such a characteristic exists.35 In section 4.2, we run a robustness
check that takes variations in PC within-classes to check that the PC estimate is unlikely to be driven by characteristics that are fixed at class level.
In the remaining tables of the present section, we systematically include quadratic controls for other class characteristics when we estimate the effect of PCs. As seen in Table V, these controls do not affect our estimates.
34
This remains true even if we allow the model to account for non-linearities in the effect of peer ability, e.g. by controlling for the share of very high- (or low-) achieving peers.
35Unfortunately, we do not have access to teachers’ characteristics at class level. Yet any correlation between PCs and teachers’ characteristics should drive a change in the PC estimate when controlling for students’ average ability, because assignment of teachers to classes is mostly related to students’ ability.
3.2.1 Distribution of the PC effect
Another reason to believe in the "familiarity" interpretation concerns the heterogeneity of the PC effect. If historical familiarity with classmates really matters, it is probably not equally important for all students. In particular, we expect that the role of former classmates is all the more important for those students who are likely to experience a difficult transition. This is exactly what we find.
We provide an analysis of the distribution of the PC effect inTable VI. We first investigate how it varies with SF students’ level of achievement (panel B). To retain enough statistical power, we split the sample into just two parts, defining SF students as either low- or high-ability based on their relative position with respect to the median continuous assessment score for their middle school of origin.36
The PC effect is strikingly heterogeneous across these two categories. While the number of PCs has virtually no effect on high-ability students, low-ability students are strongly and positively impacted. For the sake of brevity, we do not report on the magnitude of the estimates, since the effects are actually highly heterogeneous again between and high-SES within this subgroup. As reported in panel C, the effects observed on low-ability students are almost exclusively driven by low-SES students. On average, each additional PC reduces their risk of repetition by 1.4 pp, though not their risk of dropping out. They are therefore significantly more likely to enroll for either an academic or a technological major, with a similar increase in magnitude. No backlash to this strong short-term impact can be found in following grades. On average, each PC in freshman year raises their chances of taking the baccaulauréat exam and graduating by the same amount. In comparison, the estimates are very small in magnitude and never statistically significant at conventional levels for low-ability high-SES students (column V) and high-ability low-high-SES students (not reported). This suggests that keeping some classmates matters only for students who may be experiencing a hard transition both academically – they were already performing poorly in middle school – and culturally – their parents come from the working class and might not have studied at high school.
In the rest of the paper, we derive results only for this specific subsample of low-ability, low-SES students, which we call students "at risk". We focus on this subsample because the
36 Therefore, the terms "low-ability" and "high-ability" do not denote distribution ends. Besides, we use the continuous assessment score since SF groups are defined with regard to it, such that two SF students are necessarily both below or above the median. Although the anonymous DNB exam score would be a better measure of ability, two SF students may be on different sides of the median DNB score. We would thus lose part of the SF sample by analyzing the PC effect separately on each side of the median DNB score. However, doing so brings us to the same conclusions as in Table VI, though the estimates are often less accurate.
effect of persistent classmates is entirely driven by these students. As in Table V, the presence or not of other class characteristics on the right hand side of the regression does not change the estimates of the PC effect.
In panel D, we investigate this distribution pattern further by looking into how the PC effect varies with the difference in school-level social environment (measured by the share of high-SES students). This gap, denoted ∆p, is negative for one-third of low-ability low-SES students only.37
These low-ability, low-SES students are twice as likely to experience a positive ∆p, meaning that they enter an environment with more high-SES students than they used to have.
Although the sample size is to small to draw definite conclusions (the differences between the two groups are not significant to the 10 percent level), we do observe a difference in magnitude between students at risk depending on the sign of ∆p. The difference goes in the direction we would expect, i.e. that students who experience a more difficult transition (∆p > 0) are more sensitive to the presence of persistent classmates.
In panel E, we also estimate the difference of the PC effect between male and female students at risk. However, the results do not display any clear heterogeneity in the gender dimension. Persistent classmates seem to have more impact on the male repetition rate than the female repetition rate. Yet the discrepancy runs in the opposite direction for the baccaulauréat out-comes, with larger estimates for females. Both male and female students thus seem to benefit from persistent classmates in freshman year, although the benefits differ slightly depending on the stage of the high school curriculum.38
We further analyzed the distribution of the effect in middle and high school contexts. These results are not reported since no other interesting pattern can be found. For example, the effect does not appear to vary significantly with middle or high school size, the share of middle school classmates attending the high school, or the 10th grade class context.39
37 This is a mechanical consequence of the lower probability of finding low-SES students enrolled in general high schools after grade 9.
38 Although the increase in academic major enrollment is similar across both genders, persistent classmates switch male outcomes from repetition to science majors only and female outcomes to humanities only. To be more precise, both male and female PCs increase male enrollment in science, while females enroll more in humanities only when they get more female PCs. Results available on request.
39
We check, in particular, whether the extent to which your new classmates are grouped with their former classmates increases your need to be with yours. Yet again, we find no result to suggest that this is the case. This is noteworthy as it suggests that grouping former classmates would not drive negative spillovers on their other classmates, who do not necessarily have many former classmates in high school. It would be helpful, however, to confirm such a conclusion with a controlled field experiment to directly investigate externalities within the class.
All in all, the results of this investigation are consistent with our interpretation of the PC
effect. The estimates reported in Table IV are a watered-down version of the very strong PC
effect on SF students who experience an upheaval in the transition to high school.40 Already
knowing some peers in the class matters a lot to low-ability students with low socioeconomic status who come from an environment that is poor compared to the high school. This is most consistent with the interpretation of the PC effect as reflecting the impact of familiarity. By contrast, it is unlikely that the former classmates of these low-achieving underprivileged stu-dents have higher unobservables than average, which would drive the PC effect. The following section presents additional evidence in support of this.
3.2.2 Do all former peers matter?
If the effect of persistent classmates is explained by familiarity, then students at risk should be
more affected by peers with whom they have been more likely to interact at middle school.41
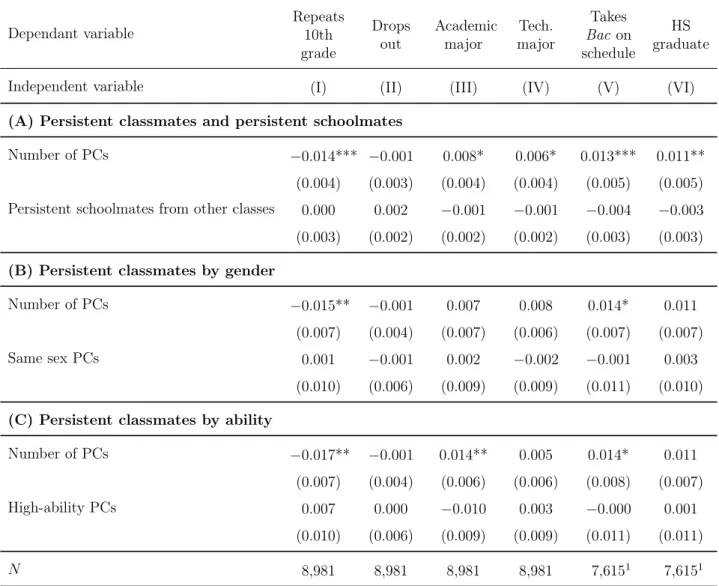
In particular, they may have interacted much more with their former classmates than with middle school peers in other classes. InTable VII, panel A, we add to the previous regressions the number of these former middle school mates from other classes. We find a small, negative effect on grade repetition, but it is not significant. Surprisingly, this effect is related to a small increase in the risk of dropping out, statistically significant at the 5 percent level. Other estimates are very small in magnitude and never statistically significant. Therefore, students seem to benefit only from their middle school mates who were in the same class, with whom they probably interacted much more.
Students do not appear to benefit more from some specific types of persistent classmates. After controlling for the number of all persistent classmates, the number of same-gender PC (panel B) and high-ability PC (panel C) do not trigger different effects on academic achievement. Interestingly, high-ability PCs do not appear to be more benefitial to students. Therefore, the PC effect is highly unlikely to result from a higher unobserved ability of persistent classmates.42
40
We check whether the other peer characteristics studied inTable IValso have a larger effect on this specific category of students "at risk". Results are provided in the online appendix (Table A.IV). Again, other peer characteristics (average ability, number of females, etc.) display non-significant and non-persisting effects on high school achievements, even for these students.
41 We focus solely on the subsample of SF students at risk since section 3.2.1shows that they are the only ones driving the PC effect. The balancing test shown inTable IIis repeated for this subsample for the different types of PCs in the online appendix(Table A.I). The test is satisfied for all types of PCs.
42 We again define "high-ability" as students with continuous assessment scores above the school median, for consistency withTable VI. However, anonymous exam scores are a better measure of ability and could be used here to define classmates’ ability without any loss of accuracy (by comparison to SF students, see again
This is another evidence that students benefit from their persistent classmates only because they know each other.
4
Robustness checks
4.1
Alternative SF group specifications
All the results presented in section 3 are based on a quite restrictive definition of SF groups. We required students to have the exact same values for all variables that were included in the registration files, binning test scores into deciles or quintiles. This degree of accuracy was necessary in order for our exogeneity tests to be valid. In this section however, we explore the sensitivity of the results for alternative definitions of the SF groups.
We test both definitions that are more restrictive and less restrictive than the main defini-tion. For instance, we can be less restrictive by allowing students to have different values for some of the variables observed by principals or by broadening the bins of the continuous test scores. Conversely, we can be more restrictive by using narrower bins. In Table VIII, we report the effect of persistent classmates on grade repetition for four alternative specifications for the primarily affected sample of "at risk" students (low-ability, low-SES). The reference definition is reproduced in column IV; columns I to III show the results for less restrictive definitions and column V presents a more restrictive definition. The details of each definition are given in the table.
All specifications yield a significant negative effect of the number of persistent classmates on grade repetition, although the magnitude of the effect varies from one specification to another. Bear in mind that the balancing test presented in section 2produces less conclusive results for the alternative specifications.43
The results in column IV therefore remain our reference results. However, the fact that the effect retains the same sign and size is reassuring for the validity and robustness of our results.
4.2
Estimation based on the impact of SF student allocation on their
classmates
In section3, the identification of peer effects within classes is based directly on the comparison of SF students randomly assigned to different classes. Yet the random assignment of SF students may also be seen itself as a shock to class composition. Receiving one or another SF classmate