HAL Id: hal-03106987
https://hal.archives-ouvertes.fr/hal-03106987
Submitted on 12 Jan 2021
HAL is a multi-disciplinary open access
archive for the deposit and dissemination of
sci-entific research documents, whether they are
pub-lished or not. The documents may come from
teaching and research institutions in France or
abroad, or from public or private research centers.
L’archive ouverte pluridisciplinaire HAL, est
destinée au dépôt et à la diffusion de documents
scientifiques de niveau recherche, publiés ou non,
émanant des établissements d’enseignement et de
recherche français ou étrangers, des laboratoires
publics ou privés.
Ice-age variability from the Vostok deuterium and
deuterium excess records
P. Yiou, F. Vimeux, J. Jouzel
To cite this version:
P. Yiou, F. Vimeux, J. Jouzel. Ice-age variability from the Vostok deuterium and deuterium excess
records. Journal of Geophysical Research: Atmospheres, American Geophysical Union, 2001, 106
(D23), pp.31875-31884. �10.1029/2001JD900147�. �hal-03106987�
JOURNAL OF GEOPHYSICAL RESEARCH, VOL. 106, NO. D23, PAGES 31,875-31,884, DECEMBER 16, 2001
Ice-age variability from the Vostok deuterium
and deuterium
excess records
P. Yiou, F. Vimeux, and J. Jouzel
IPSL, Laboratoire des Sciences du Climat et de l'Environnement, UMR CEA-CNRS, Gif-sur-Yvette, France
Abstract. The four climatic cycles obtained from the Vostok ice core offer a unique opportunity to study the high-frequency paleoclimatic variability, i.e., on time scales
smaller than 15 kyr. We focused
our study on the deuterium (5D) and deuterium
excess
(d) records,
which are proxies
for local temperature
and remote evaporation
source temperature and hence give us access to spatial climatic variations. Spectral
analyses
of paleoclimatic
records
have shown
that the last glacial period (110-15 kyr
before
present)
is characterized
by large and fast temperature
oscillations.
Examples
of such variations in the Northern Hemisphere
are the so-called
Dansgaard-Oeschger
oscillations and Heinrich events. At Vostok, these oscillations are also imprinted in the ice, with broadband periodicities between 5 and 8 kyr and between 1.4 and 1.8
kyr. Scenarios
for this behavior have recently been developed and argued, as well
as connections with the Northern Hemisphere. We now can investigate the stability
of the fast spectral features in the previous ice ages recovered
in the Vostok isotopic
records. This allows us to document the different types of climatic behavior under glacial conditions and hence connect the fast variation statistics with the slower ones controlled by insolation and sea level change. Our results show that 5D and d do have a distinct spectral behavior. We discuss the implications on the ocean circulation from such a difference.
1. Introduction
The Vostok ice core provides, to date, the longest
ice record in terms of depth and time span, since it reached a depth of ae2a m and over 450,000 years in the past. The Vostok project is a cooperative effort
among Russia, the United States, and France [Vostok Project Members, 1995]; it was drilled in East Antarc- tica (78ø28'S, 106ø48'E), where the annual average tem-
perature is m -55øC. The project involved drilling sev-
eral holes [Lorius et al., 1985; Jouzel et al., 1987, 1993; Vostok Project Members, 1995; Petit et al., 1999], for
which the data were compared and found in good agree-
ment.
From the ice core, climatic information was retrieved
local temperature variations at the top of the inversion
layer, where the precipitation formed [Jouzel and Mer-
livat, 1984; Jouzel
et al., 1997]. The 5•sO and 5D were
both measured at 5 m increment samples from 0 to 150kyr B.P., and 1 m beyond 150 kyr B.P., by Vimeua: et al.
[this issue], independantly from the 5D measurements of Petit et al. [1999]. The deuterium profile is shown in
Figure 1. The comparison between the two isotopes is
interesting, so we also used the linear residual between
5D and 5•sO, the deuterium
ea:cess
d defined
by [Craig,
1961; Dansgaard, 1964]
d = 5D - 85•80.
(1)
The deuterium excess is controled by kinetic isotopic
effect differences between 5D and 5•80 during evapo-
through
isotopic
measurements
of deuterium
[Petit et al., ration. Thus the water vapor at the source
of evapo-
1999] and deuterium excess [Vimeux et al., 1999], green- house gases (CO2 [Barnola et al., 1987; Petit et al., 1999] and CH4 [Chappellaz et al., 1990; Petit et al., 1999]), dust content [Petit et al., 1990], and various chemical species [Legrand et al., 1992]. We focused on
the isotopic
measurements
(5•sO and 5D), expressed
in
per mil with respect to the standard mean ocean water(SMOW). These two isotopes mainly account for the
Copyright 2001 by the American Geophysical Union. Paper number 2001JD900147.
0148- 0227/01/2001J D 900147509.00
ration is richer in 5D when the temperature is higher.
Hence the deuterium excess index at Vostok accounts
for nonlocal or remote information on the oceanic mois-
ture source that precipitates at the site [Craig, 1961; Dansgaard, 1964]. We used the deuterium excess profile of Vimeua: et al. [this issue] on the four cycles (Figure 2). Previous studies have shown that d in precipitation
reflects meteorological moisture source properties, i.e., mainly sea surface temperature and relative humidity
[Merlivat and Jouzel, 1979; Jouzel and Merlivat, 1984; Johnsen et al., 1989]. Moreover, both Rayleigh-type models [Vimeua:, 1999] and general circulation mod- els [Delaygue et al., 2000] have shown that d at Vos- 31,875
31,876 YIOU ET AL.' VOSTOK ICE-AGE VARIABILITY E 0 50 100 150 200 250 300 350 400 -0.5 G1 G2 G3 G4 0.0 0.5 -410 -42O 1.0 -43O -44O -45O -46O -47O -480 -490 • • ' • ' 0 50 100 150 200 250 300 350 400 Time (kyr 13P)
Figure 1. Deuterium 5D variations in the Vostok ice core for the top 3305 meters. Time is
expressed
in thousands
of years
before
present
(kyr B.P.). Deuterium
values
are normalized
by
SMOW and expressed in per mil. The four ice ages are numbered from G1 to G4, and emphasized
by boxes. The upper panel shows the sea-level change curve from the Bessinot et el. [1994] data.
tok roughly increases by i per mil when source regions
warm up by 1ø C.
The accumulation rate at Vostok is about 2 cm/yr; this means that the annual layers are too thin for visual detection and models of chronologies have to be used
to date the samples [Lorius et el., 1985; Jouzel et el., 1993; Weelbroeck et el., 1995]. Perrenin et el. [this issue] provide a methodology that combines and im-
proves the chronologies. Other approaches have been
followed, using markers like methane [Blunier et el.,
1998]
or 5x80 [Bender
et el., 1994]
in the air bubbles
to
correlate Vostok with better dated records, such as the
Greenland Ice core Project (GRIP) ice core or marine
records. In this study we will restrict our investiga-
tion to the extended glaciological timescale (EGT4) of Petit et el. [1999]. The EGT4 chronology is based on
ice flow modeling, with the constrain of a few control
points (at 110 and 390 kyr B.P.) which put Vostok in phase with marine isotopic records [Petit et el., 1999; Parrenin et el., this issue]. An important caveat is that
EGT4 is slightly different from the time scale of Lorius
et el. [1985] which was used for the first climatic cycle
and only had one control point at 110 kyr B.P. Such a change does have an impact on the exact location of the spectral peaks. Hence this is a way of obtaining error
bars on the frequency analysis [Yiou et el., 1994, 1997].
The time series derived from the experimental mea- surements are generally irregular but bear many re- semblances and recurring patterns embedded in noise. These patterns cover the well-documented glacial-inter- glacial cycle and the abrupt oscillations during the last ice age which are found in all cores. Our challenge is then to decipher the climatic information from these ap- parently noisy signals and assess the statistical signifi- cance of the near periodicities in order to infer plausible
physical mechanisms.
The purpose of the paper is to compare the sta- tistical fea(ures of the four ice ages imprinted in the Vostok ice core. Ice ages are allegedly more variable
than interglacials (e.g., the Holocene) and exhibit fast and large-scale variations (see Broecker [2000] for a recent review). These variations occur on centennial
to millenial time scales and are particularly promi-
nent in Greenland records and marine records of the
North Atlantic. Spectral analyses of those records have shown broadband periodicities near 1.5 kyr and 5 kyr
(1 kyr = 1000 years),
which are respectively
associated
with Dansgaard-Oeschger (DO) oscillations and Hein- rich events (HE). Such fast variations are explained by the instability of northern ice sheets which (more or less) regularly collapse into the ocean and modify its
YIOU ET AL.: VOSTOK ICE-AGE VARIABILITY 31,877 2O 19 18 17
• 16
,,'I, 15
• 14
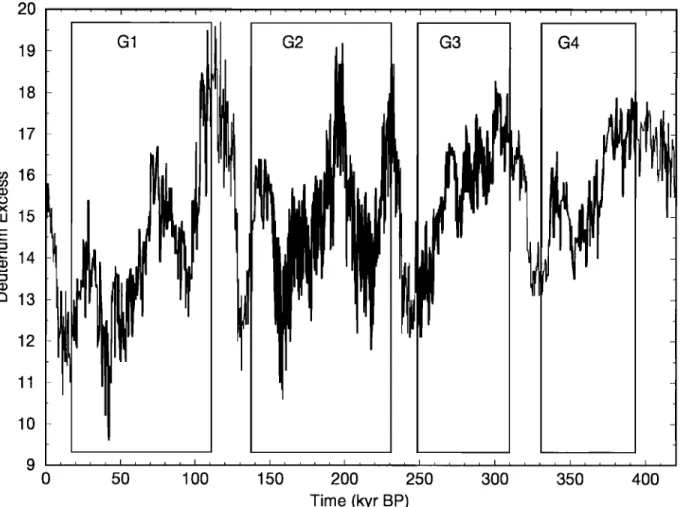
• 13 12 11 10 G1 G2 G3 0 50 100 150 200 250 Time (kyr BP) 30O 350 40OFigure 2. Deuterium excess d variations in the Vostok ice core.
emphasized by boxes.
The four ice ages G1-4 are
and Broecker [1998] give a mechanism through which
anomalies of the ocean circulation in the North can
transmit "information" to the Southern Hemisphere, by connecting energy transport changes to collapses of the
thermohaline circulation.
The joint study of the deuterium and deuterium ex-
cess records provides an opportunity to evaluate the re- spective behavior of high and lower latitudes on several
climatic cycles (assuming that moisture source regions are located in middle and low latitudes) and hence ob-
tain a better statistical stability than with a single cli- matic cycle. Thus we will be able to detect some generic features of temporal and spatial ice age variability felt at Vostok.
We isolated the four glacial ages and numbered them G1 to G4. These periods were heuristically chosen from
low 5D values (Figure 1). The four glacial boxes cover
the same periods for the two records (Figures 1 and
2). Our strategy is thus to determine the common sta-
ble frequency patterns of the four ice ages in the iso- topic records, assuming that such patterns characterize a glacial period.
Note that we only considered the data down to 420
kyr before present (B.P.), i.e., 3305 m, since the isotopic
content beyond that depth is likely to be affected by the
underlying Vostok lake [Jouzel et al., 1999]. This trun-
cation also ensured that we had a good time resolution for the high-frequency analysis.
Data treatment and spectral analyses will be dis-
cussed in section 2. Results will be discussed in section
3.
2. Spectral Analysis
The data obtained from the ice core is roughly regular
in depth (some intervals benefited from a more intense sampling), but the depth-age relationship is not linear
since the ice thinning varies with depth. Apart from a
few outliers, the deuterium profile has a sampling rate
that varies between • 0.1 kyr and 0.5 kyr (i.e., sam- pling every meter); the deuterium excess profile sam-
pling varies between • 0.2 kyr and 0.5 kyr. Hence the data have to be interpolated at regular intervals in or- der to retrieve a time series. In this paper we elected to use the finest possible time step, 5t = 100 years, so we follow the original data as closely as possible. On
the other hand, since the data time step is much larger toward the bottom of the core, we decided to conserva-
31,878 YIOU ET AL.: VOSTOK ICE-AGE VARIABILITY
problems near the Nyquist frequency. The last part of
the record will be cut at 0.6 cycles/kyr.
In this paper we used the multitaper method (MTM) of Thomson [1982] and the statistical tests developed by Mann and Lees [1996]. We also tested other spec- tral analysis methods [Dettinger et al., 1995; Yiou et al., 1996; Ghil et al., 2001] in order to cross-check our re- sults; we used the SSA-MTM Toolkit v3 (available on the Web at http://atmos.ucla.edu/tcd). We will only
show the MTM results in order not to overload the pa-
per.
The purpose of MTM [Thomson, 1982; Percival and Walden, 1993] is to circumvent the problem of the vari-
ance of spectral estimates; indeed, the variance of the Fourier spectrum of a random process equals the spec-
trum itself [Jenkins and Watts, 1968], which means that
the potential errors can be as large as the calculation itself. A set of independent estimates of the power spec- trum is computed, by premultiplying the data by K orthogonal tapers, i.e., functions that are built to min- imize the spectral leakage outside a scaled bandwidth
Nf2 (f2 is a frequency bandwidth) due to the finiteness (N) of the data. Then, averaging over this ensemble of spectra yields a better and more stable (with lower vari- ance) estimate than with single-taper methods [Thom- son, 1990]. Detailed algorithms for the calculation of those tapers are given by Thomson [1990] and Perci- val and Walden [1993]. The choice of K and Nf2 is a
trade-off between stability and frequency resolution, so
several values should be tested [Yiou et al., 1996; Mann and Park, 2000]. Here we chose a conservative set of
N f2 = 4 and K: 7 tapers for the four glacial periods.
Harmonic analysis (estimate of line frequencies and their amplitude) can be performed by MTM, with a
statistical F test on the amplitude; this test uses the ratio of the variance explained by a line frequency to
the residual variance [Thomson, 1982]. One of the main
assumptions of MTM harmonic analysis is that the sig- nal must yield periodic and separated components. If
not, a continuous spectrum (from a colored noise or a chaotic system) will be broken down to spurious lines
with arbitrary frequencies and possibly high F values.
The power spectrum is then 'ireshaped" near the found
line frequencies, hence representing the time series spec- trum as the sum of discrete line spectra and contin-
uous broadband spectra [Percival and Walden, 1993; Ghil et al., 2001].
In addition, Mann and Lees [1996] provided a method
to detect significant narrow band, "quasi-oscillatory" signals that may exhibit phase and amplitude modula-
tion as well as intermittently osciltatory behavior. Their method combines the harmonic analysis test and a "ro-
bust" estimate of the background noise. Here the back-
ground noise is assumed to be red noise (i.e., an autore- gressive process of the first order [C hatfield, 1984; Ghil et al., 2001]):
X(t + 1) = aX(t) + b(t),
where 0 < a < 1 and b(t) is a Gaussian white noise. The
retained features will be those for which the red noise null hypothesis can be rejected with a sufficient confi- dence. Discrimination against a red-noise background is particularly important in climate studies, where the system under investigation always contains longer time
scales than those of immediate interest. This leads to
greater power at lower frequencies and greater likeli-
hood of prominent peaks in the spectrum, these, even
in the absence of any signals [e.g., Hasselmann, 1976].
To summarize, significance levels for harmonic or nar- row band spectral features relative to the estimated noise background can be determined from the appropri- ate quantties of the chi-square distribution, by assuming that the spectrum as being distributed with u = 2K
degrees of freedom [Mann and Lees, 1996; Mann and Park, 2000]. A reshaped spectrum is determined in
which the contributions from harmonic signals are re-
moved [Thomson, 1982], based on their passing signifi-
cance threshold for the F variance-ratio test described
above. In this way, noise background, harmonic, and narrow band signals are isolated in two steps. The har- monic peak detection procedure provides information as to whether the signals are best approximated as har-
monic or narrow band, i.e., as phase-coherent sinusoidal
oscillations or as amplitude and phase modulated, pos- sibly intermittent oscillations. In either case, they must be formed to be significant relative to a specified noise
hypothesis such as that of red noise (2) used above.
3. Results and Discussion
The first exercise we performed was to obtain the
spectra of the 5D and d time series of Figures I and
2. The MTM spectrum of the deuterium shows promi-
nent peaks near 40, 23, and 18 kyr, i.e., near obliquity
and precessional peaks (not shown) [see also Petit et al., 1999]. A peak near 100 kyr also emerges and is
connected with the glacial to interglacial cycles. This
completes the findings of Jouzel et al. [1987] and Yiou et al. [1991], who only analyzed the first climatic cycle.
The presence of these periodicities is a strong argument
in favor of the orbital forcing theory [Hays et al., 1976].
However, it should be noted that the 100 kyr peak has a broad band, which corresponds to the fact that the in-
terval between interglacials increases with time (i.e., be- tween G3-4 and G1-2), hence yielding longer and longer
ice ages. This feature has been observed by Birchfield
and Ghil [1993] who observed the progressive appear-
ance of a 100 kyr cycle, near 700 kyr B.P., in a marine sediment core covering the Late Pleistocene.
The deuterium excess d time series yields a rather different spectrum, with more pronounced peaks near
40, 18, and 100 kyr [Vimeux et al., this issue]. Moreover,
it is also clear from a visual inspection that the peaks are broadband and nonstationary, since the precessional peak disappears before 250 kyr B.P., as discussed by
YIOU ET AL.: VOSTOK ICE-AGE VARIABILITY 31,879
Prior to further statistical analyses of the higher fre-
quencies, a few features can be pointed out on the four
ice ages G1-4. Figure i also shows the sea level vari- ations estimated from the isotopic record of Bassinet
et al. [1994]. It is clear that the low-frequency vari-
ations of the deuterium record are parallel to the sea level change curve, apart from a phase lag which can be attributed to the timescale uncertainties or a delayed response of Antarctica to a northern signal. This sim- ilarity emphasizes the two-step feature of G1 and G2,
with high 5D (or temperature) during the first parts
of the ice ages, and low 5D thereafter. On the other hand, G3 and G4 show an oscillating decrease of 5D values. Moreover, the durations of the ice ages are not similar: G1 and G2 last for around 90 kyr, while G3 and G4 last about 60 kyr. Thus we can a priori classify
the four last ice ages (at least in the Vestok data) into
two categories: the long two-stepped ones and the short ones. Such a distinction does not appear with lower
latitude sediment data [Schneider et al., 1995, 1996; E. Bard, Personal Communication, 2000]; therefore there
are differences in the spatial variability from one ice age to another, which would justify a separate study of each of them. Here we will focus on their common properties, which seem to prevail in the high latitudes.
The MTM spectral analyses of 5D during the four glacial periods G1-4 are displayed in Figure 3. Since G4 has a looser sampling rate than G1-3, we truncated
the analyses at f = 0.6 cycles/kyr (bottom panel of Figure 3). The overall shapes of the spectra are close to red noise processes (thick continuous solid lines in Figure 3), but a few features stand out of the confi-
dence intervals. On the one hand, the "orbital" low
frequencies account for the trends in all the four series. On the other hand, the four series show lines between periods of 5 and 10 kyr. This is about the time scale of
periodic ice sheet instabilities predicted by the simple
models of Ohil and Le Treut [1981] or MacAyeal [1992], and used by Paillard and Labeyrie [1994] to evaluate the
impact of the Heinrich events on the THC and climate.
Yiou et al. [1994] found similar oscillations in marine
sediments from various ocean basins, so this periodic- ity range can be considered a generic glacial feature. The results found for G1 slightly differ from the ones of
Yiou et al. [1997], due to local changes in the chronology (these differences were anticipated by Yiou et al. [1997] who tested a GRIP-tuned Vestok timescale). It is clear,
however, that such peaks are not constant through time within each ice age, and they only account for an aver-
age periodicity (hence the sensitivity of the actual fre- quency to the timescale).
Other groups of harmonic peaks appear significant in the higher-frequency domain, with consistent properties
between G2 and G3 (T • 2.3 kyr) and G1-3 (1.6 (
T ( 1.8 kyr). The latter range is robust (to method
and parameter changes) and close to the conspicuous
1.5 kyr periodicity found in many Northern Hemisphere
high resolution sediment records [Mayewski et al., 1997;
Hendy and Kennett, 2000; Schulz et al., 1999; Hinnov
et al., 2001], albeit with a very small explained variance (less than 1% of the total variance).
The deuterium excess time series behaves quite dif-
ferently. When looking at the time domain (Figure 2),
the glacial periods are characterized by global nega- tive trends, although the trend in G2 is much less pro-
nounced than for the others. This trend can be inter-
preted as a progressive cooling of the source regions at
lower latitudes [Vimeux, 1999]. As a consequence, the
power spectra are dominated by low-frequency variance,
and the high-frequency parts are akin to red noise (Fig- ure 4). The ice ages bear some similarities in the 4-5 kyr and m 2 kyr bands (G1 and G4) and in the 2.5- 3 kyr band (G1-4). We note that the line frequencies
never fall in the 5-8 kyr range found in the deuterium
records.
However, we find an intriguing difference between G1 and the other ice ages. The G1 d record does yield a cycle near 1.5 kyr, as well as the •D record, albeit not
at the same exact frequency. The excess time series in
G2-4 do not have this peak. This finding is consistent
with the observation of Mazaud et al. [2000], who cor-
related minute d minima with some 5D maxima, and
cold periods preceding a Heinrich event, in the GRIP
5•80 record. Their result was obtained on a Vestok chronology tuned to GRIP with methane content [Blu- nier et al., 1998], during the younger half of G1. Thus
such a correlation might be real throughout the whole ice age G1, but the absence of a 1.5 kyr cycle in the pre- ceding ice ages suggests that this correlation is no longer
valid (provided we accept the present Vestok chronol- ogy). Yet, one should keep in mind that the 1.5 kyr
cycle and observed d minima have a very small ampli-
tude (• 1 per mil)compared to the total variations (• 10 per mil). Therefore it cannot be excluded that
the match came by pure chance; a thorough study of d negative peaks on the full ice age in Greenland, and possibly on other ice ages, would be necessary to settle
this discrepancy.
The spectral differences between the deuterium and
excess glacial records suggest that the underlying dy-
namics that control both proxies are distinct. It is
important to note that these differences are meaning-
ful since both profiles share the same timescale and the same time resolution, so the differences would per-
sist after a chronology change. There is some evidence that the fast variability in the deuterium record is con-
nected to northern ice sheet instabilities and the THC
[Blunier et al., 1998; Ganopolski and Rahmstorf, 2001].
The conventional "seesaw" scenario is that when salin- ity and temperature anomalies occur in the high lati-
tudes of the Northern Hemisphere (e.g., due to D-O or HEs), they hinder the global THC and affect climate
near the upwelling zones in the Southern Hemisphere
[Broecker, 1998]. Thus a reduced THC would lower
the northward energy transport that cools Antarctica.
31,880 YIOU ET AL.' VOSTOK ICE-AGE VARIABILITY 10 4 10 3 10 2 1 10 4 10 3
1o.
i
101 Period (kyr) 5 4 3 2.5 2 1.5 ,:
MTM
de
'...,•,i.u••
' ,r
'/
:..._., _
- , o o.9 1 raw ! ----harmonic : reshaped i Red noise : ... 90% • 95 % ,, 0.1 0.2 0.3 0.4 0.5 0.6 0.7 0.8 Frequency (cpkyr) 10 4 10 2 1• 10 3
101Figure 3. MTM spectral analyses of the four glacial 5D records. The four ice ages G1-4 go from top to bottom. The G4 spectrum is truncated at 0.6 cycles/kyr because of its poorer resolution.
The MTM parameters are a NW = 4 bandwidth and K = 7 tapers (see Yiou et al. [1996] for methodological details). The thin wiggly lines represent the raw spectra; the thin dash-dotted lines, the harmonic peaks detected by the F-test [Mann and Lees, 1996]; the thick wiggly line, the reshaped spectra, after removal of the harmonic components [Thomson, 1982; Mann and Lees,
1996]; the thick continuous line is the equivalent red noise spectrum obtained by robust median
testing [Mann and Lees, 1996]; the dotted and dashed
lines are the 90% and 95% confidence
intervals for the red noise null hypothesis.
extremely fast variations, so only the large and long
variations will be e•ciently propagated [Blunier et al., 1998]. This is what is observed between the Greenland and the Antarctic ice cores [Bender et al., 1994; Blunier et al., 1998]. If we make the hypothesis that the signa-
ture of these glacial anomalies is quasi-periodic peaks
between intervals 5 < T < 10 kyr and 1.4 < T < 1.8
kyr, then such a "seesaw" scenario is consistent with the
statistical analysis of Greenland [Yiou et al., 1997] and
the Vostok ice cores. This scenario is also supported by
marine sediment cores in the North Atlantic (albeit dur- ing marine isotopic stage (MIS) 3 only) where benthic
YIOU ET AL- VOSTOK ICE-AGE VARIABILITY 31,881 10 2 ,_ 10 • (.9 10 o 10 2 101 10 o 10-'• Period (kyr) 10 5 4 3 2.5 2 1.5 0.1 0.2 0.3 0.4 0.5 0.6 Frequency (cpkyr) raw ---- harmonic reshaped Red noise ... 90% 95 %
0 o.7 o.8 o.9 1
10 2 10 o 10 -1 10 2 lO 10 o 1
Figure 4. MTM spectral analyses of the four glacial d records (G1-4 from top to bottom, respectively). The MTM parameters are a NW - 4 bandwidth and K - 7 tapers. The legends
are the same as for Figure 3.
and planktonic foraminifera were analyzed in high reso-
lution [Shackleton et al., 2000]; in this core the benthic
(deep
ocean)
5z80 variations
are similar to the Vostok
deuterium variations, whereas the planktonic (surface
ocean)
5z80 follows
the GRIP 5z80 record.
Schulz
et al.
[1999] make the important point that this 1.5 kyr fea-
ture has a modulated amplitude throughout the last ice
age and is prominent during its last phase (i.e. marine isotopic stage 3), when ice volume was higher. In the
absence of detailed Northern Hemispheric data during
G2-4, the correlation between this pseudo cyclic feature
and large (and unstable) ice sheets has to be assumed.
Moreover, since there are no long and high-resolution
data sets from the southern oceans, the attribution of
this period range found in the Vostok 5D to the Dans- gaard Oeschger events that take place in Greenland is
also speculated here. Ganopolski and Rahmstorf [2001]
present a long simulation of the CLIMBER2 model in which they simulated 1.5 kyr periodic DO/HEs in the
31,882 YIOU ET AL.: VOSTOK ICE-AGE VARIABILITY
Antarctic temperature, albeit with a low amplitude and opposite phase from what is seen in Greenland. Their result hence supports our hypothesis that the m 1.5 cy-
cle in the Vostok data is a shadow of the DOs of the
Northern Hemisphere.
Interestingly, the deuterium excess d does not yield
such spectral features. Excess d is connected to a sur-
face source signal of the water vapor at Vostok located
mainly in the southern Indian Ocean [D½lay9u½ ½t al., 2000], and with only m 30% of moisture from the At-
lantic and Pacific oceans. Estimates of surface tem-
perature variations at subtropical latitudes in the At-
lantic and the Pacific are around 30 to 5øC [Sachs and Lehmann, 1999; Hendy and Kennett, 2000] and around 3øC in the southern Indian Ocean [Salvi9nac, 1998]. If
such surface variations were to be felt in the subtropi- cal Indian Ocean, they would translate into deuterium
excess variations of m 3 per mil, which is larger than
the fast peak-to-peak amplitude (Figure 2) and hence
detectable. Thus we infer that the high latitude • 5- 10 and m 1.5 kyr oscillatory signals do not propagate through the surface Indian ocean or the atmosphere from the North to the South because of their absence in
the Vostok d record which should have contained them.
However, the quasi-cyclic variations imprinted in the d record suggest that the midlatitude source regions of
the Vostok ice reflect local oscillations that are inde-
pendent from the D-O/HE, except possibly from the second part of the last glacial period. A simple tenta-
tive explanation for this spectral difference is that the
southern Indian Ocean is at the "end" of the THC con- veyor belt and hence would mitigate surface and deep ocean signals of different phases. On the other hand, the
result of Mazaud et al. [2000] suggests that the surface
anomalies induced by the few HE iceberg discharges were sufficiently strong to have a greater impact than
their counterparts in early G1 and G2-4 and hence did
have a global impact.
4. Conclusions
In this paper we investigated the spectral properties of two isotopic records from the full Vostok ice core:
the deuterium and the deuterium excess records. The
deuterium content is a proxy for local temperature vari- ations, and the deuterium excess reflects changes in the source of the water vapor that precipitates at Vostok. We could thus assume that they are independent.
The spectral analyses of both records separated the low-frequency variability associated to the insolation
forcing through the presence of orbital frequencies [Pe- tit et al., 1999]. Given that the extended glaciological chronology (EGT4) of Vostok is independent from or- bital tuning (except for two control points at 110 kyr B.P. and 390 kyr B.P. [Petit et al., 1999], which does have an influence on a 100 kyr cycle), this result com- forts the classical orbital theory of paleoclimates [Hays
et al., 1976; Crowley and North, 1991]. The parallel
between the deuterium record and the sea level change
record (from the Bassinot et al. [1994] record) is also
striking along each glacial period.
We extracted the four ice ages imprinted in the records. Since the last ice age has been well documented in the Vostok and other records throughout the globe, it was natural to compare the properties of the preceding ones. The four 5D glacial records yield the conspicuous 5-8 kyr periodicity, and millenial variability in the 1.5-1.8
kyr range is also present in three of the ice ages (G 1-3).
This shows that this feature is not only general among
paleorecords during the last ice age [Yiou et al., 1994; Mayewski et al., 1997; Yiou et al., 1997], but it is also
a characteristic feature of the previous ice ages. The deuterium excess d glacial records do not show those periodicities, and we are hence tempted to exclude that d follows the rapid glacial events connected to iceberg discharges in the northern oceans. Thus we can infer that in general, a glacial signal due to an iceberg dis- charge into the North Atlantic mainly propagates to the South through the deep ocean circulation and the up- welling zones of the southern oceans, as suggested by the coupled model simulation of Ganopolski and Rahm-
storf [2001]. The last ice age (G1), especially during MIS 3 (between 60 kyr and 20 kyr B.P.) yields the pe-
culiarity of showing a d record that varies in correlation
with Heinrich events [Mazaud et al., 2000]. This is not
in contradiction with our main conclusion but rather
refines it: climatic variability during MIS 3 is largely
associated with HEs [Bond et al., 1993; Broecker, 1994]
which come from the Laurentide ice sheet. On the other
hand, the early G1 does not have traces of Lauren-
tide iceberg discharges but, possibly, of Scandinavian or Greenland ice sheets, and the global ice volume is lower. Thus we interpret the correlation of d events with isotopic anomalies in the GRIP ice core by the pen-
etration of cold and fresh water from the Laurentide ice
sheet into midlatitudes, while other ice sheet discharges do not flow that much into the South. Reconstructing the history of each ice sheet is hence essential to verify
this conjecture.
We note that this result supports the genericity of
oscillating ice sheet/ocean circulation mechanisms [Ghil
and Le Treut, 1981; MacAyeal, 1992; Paillard and Labey-
rie, 1994; Verbitzky and Saltzman, 1995]. The caveat of
this deduction is that the deuterium excess reflects con-
ditions at the moisture source, and this source can move
with time, so the relevant information is smeared over
a wide geographical area [Vimeux et al., 1999].
Therefore we need more high-resolution records of deep and surface marine conditions, especially in the subtropical Indian Ocean, to constrain the spatial vari- ability during the last ice age and be able to assess the "seesaw" scenario, which might have many exceptions. Moreover, other deep ice cores covering several climate cycles will help to document the genericity of the glacial features found at Vostok. In particular, we have shown
YIOU ET AL.: VOSTOK ICE-AGE VARIABILITY 31,883
that the Vostok isotopic data are just a piece of the
paleocean circulation puzzle.
Acknowledgments. This work was supported by the Vostok project. The authors wish to thank V. Masson, E. Michel and C. Waelbroeck for a useful discussion. The manuscript was greatly improved by the thoughtful sugges- tions of two anonymous reviewers. This is contribution 0527 of LSCE.
References
Barnola, J. M., D. Raynaud, Y. N. Korotkevitch, and C. Lo- flus, Vostok ice core provides 160,000-year record of at- mospheric CO2, Nature, 329,408-414, 1987.
Bassinot, F., L. Labeyrie, E. Vincent, X. Quidelleur, N.J. Shackleton, and Y. Lancelot, The astronomical theory of climate and the age of the Brunhes-Matuyama magnetic reversal, Earth Planet. Sci. Lett., 126, 91-108, 1994. Bender, M., T. Sowers, M. L. Dickson, J. Orchardo,
P. Grootes, P. A. Mayewski, and D. Meeses, Climate cor- relations between Greenland and Antarctica during the past 100,000 years, Nature, 372,663-666, 1994.
Birchfield, G. E., and M. Ghil, Climate evolution in the
Pliocene-Pleistocene as seen in deep sea 5•sO records and
in simulations: Internal variability versus orbital forcing, J. Geophys. Res., 98, 10,385-10,399, 1993.
Blunier, T., et al., Asynchrony of Antarctic and Greenland climate change during the last glacial period, Nature, 39•,,
739-743, 1998.
Bond, G., W. S. Broecker, S. Johnsen, J. McManus, L. Labeyrie, J. Jouzel, and G. Bonani, Correlations be- tween climate records from North Atlantic sediments and Greenland ice, Nature, 365, 143-147, 1993.
Broecker, W. S., Massive iceberg discharges as triggers for global climate change, Nature, 372,421-424, 1994. Broecker, W. S., Paleocean circulation during the last
deglaciation: A bipolar seesaw?, Paleoceanography, 13,
119-121, 1998.
Broecker, W. S., Abrupt climate change: Causal constraints provided by the paleoclimate record, Earth Sci. Rev., 51,
137-154, 2000.
Chappellaz, J., J. M. Barnola, D. Raynaud, Y. S. rotkevitch, and C. Lorius, Ice-core record of atmospheric methane over the past 160,000 years, Nature, 3•,5, 127-
131, 1990.
Chatfield, C., The Analysis of Time Series: An Introduc- tion, 3rd ed., Chapman and Hall, New York, 1984. Craig, H., Isotopic variations in meteoritic waters, Science,
133, 1702-1703, 1961.
Crowley, T. J., and G. B. North, Paleoclimatology, Oxford Univ. Press, New York, 1991.
Dansgaard, W., Stable isotopes in precipitation, Tellus, 16,
436-447, 1964.
Delaygue, G., V. Masson, J. Jouzel, R. D. Koster, and R. J. Healy, The origin of Antarctic precipitations, Tellus, 52B,
19-36, 2000.
Derringer, M.D., M. Ghil, C. M. Strong, W. Weibel, and P. Yiou, Software expedites singular-spectrum analysis of noisy time series, Eos Trans. AGU, 76, 12, 20, 21,
1995, (Version 4.0 available on the World Wide Web at http://www. atmos. ucla. edu/).
Ganopolski, A., and S. Rahmstorf, Rapid changes of glacial climate simulated in a coupled climate model, Nature,
•09, 153-158, 2001.
Ghil, M., and H. Le Treut, A climate model with cryody- namics and geodynamics, J. Geophys. Res., 86, 5262- 5270, 1981.
Ghil, M., et al., Advanced spectral methods for climatic time series, Rev. Geophys., in press, 2001.
Hasselmann, K., Stochastic climate models, Tellus, 6,473-
485, 1976.
Hays, J. D., J. Imbrie, and N.J. Shackleton, Variations in the Earth's orbit: Pacemaker of the ice ages, Science, 19•,,
1121-1132, 1976.
Hendy, I. L., and J. P. Kennett, Dansgaard-Oeschger cycles and the California current system: planktonic foraminiferal response to rapid climate change in Santa Barbara Basin, Ocean Drilling Program hole 893a, Pale- oceanography, 15, 30-42, 2000.
Hinnov, L., M. Schulz, and P. Yiou, Interhemispheric space-time attributes of the quasi-1500 year Dansgaard- Oeschger oscillations between 0-110 kyr, Quatern. Sci. Rev., accepted, 2001.
Jenkins, G. M., and D. G. Watts, Spectral Analysis and Its Applications, Holden-Day, San Francisco, 1968.
Johnsen, S. J., W. Dansgaard, and J. W. White, The origin of Arctic precipitation under present glacial conditions,
Tellus, Set. B, •,IB, 452-468, 1989.
Jouzel, J., and L. Merlivat, Deuterium and oxygen 18 in precipitation: Modeling of the isotopic effects during snow formation, J. Geophys. Res., 89, 11,749-11,757, 1984. Jouzel, J., C. Lorius, J. R. Petit, C. Genthon, N. I. Barkov,
V. M. Kotlyakov, and V. M. Petrov, Vostok ice core: A continuous temperature record over the last climatic cycle
(160,000 years), Nature, 329,403-408, 1987.
Jouzel, J., et al., Extending the Vostok ice-core records of palaeoclimate to the penultimate glacial period, Nature,
36•,, 407-412, 1993.
Jouzel, J., et al., Validity of the temperature reconstruction from water isotopes in ice cores, J. Geophys. Res., 102,
26,471-26,488, 1997.
Jouzcl, J., et al., More than 200 meters of lake ice above subglacial Lake Vostok, Antarctica, Science, 286, 2138-
2141, 1999.
Legrand, M., M. DeAngelis, T. Stafflebach, A. Ncftel, and B. Stauffer, Large perturbations of ammonium and or- ganic acids content in the Summit-Greenland ice core. Fingerprint from forest fires?, Geophys. Res. Left., 19,
473-475, 1992.
Lorius, C., J. Jouzel, C. Ritz, L. Merlivat, N. I. Barkov, V. M. Kotlyakov, and V. M. Petrov, A 150,000 year cli- matic record f•om Antarctic ice, Nature, 316, 591-596,
1985.
MacAyeal, D. R., Irregular oscillations of the West Antarctic ice sheet, Nature, 359, 29-32, 1992.
Mann, M. E., and J. M. Lees, Robust estimation of back- ground noise and signal detection in climatic time series,
Clim. Change, 33,409-445, 1996.
Mann, M. E., and J. Park, Oscillatory spatiotemporal signal detection in climate studies: A multiple-taper spectral domain approach, Adv. Geophys., J1, 1-131, 2000. Mayewski, P. A., L. D. Meeker, M. S. Twickler, S. I. Whir-
low, Q. Yang, and M. Prentice, Major features and forcing of high-latitude Northern Hemispheric atmospheric circu- lation over the last 110,000 years, J. Geophys. Res., 102, 26,345-26,366, 1997.
Mazaud, A., F. Vimeux, and J. Jouzel, Short fluctuations in antarctic isotope records: a link with cold events in the North Atlantic?, Earth Planet. Sci. Left., 1J2, 19-27,
2000.
Merlivat, L., and J. Jouzel, Global climatic interpretation of the deuterium-oxygen 18 relationship for precipitation, J.
Geophys. Res., 8•,, 5029-5033, 1979.
Paillard, D., and L. D. Labeyrie, Role of the thermohaline circulation in the abrupt warming after Heinrich events, Nature, 372, 162-164, 1994.
31,884 YIOU ET AL.: VOSTOK ICE-AGE VARIABILITY Parrenin, F., J. Jouzel, C. Waelbroeck, C. Ritz, and J.-M.
Barnola, Dating the Vostok ice core by an inverse method, J. Geophys. Res., this issue.
Percival, D. B., and A. T. Walden, Spectral Analysis for
Physical Applications, Cambridge Univ. Press, New York,
1993.
Petit, J. R., L. Mounier, J. Jouzel, Y. S. Korotkevitch, V. I. Kotlyakov, and C. Lorius, Paleoclimatological and chronological implications of the Vostok dust record, Na-
ture, $•$, 56-58, 1990.
Petit, J. R., et al., 420,000 years of climate and atmospheric history revealed by the Vostok deep Antarctic ice core,
Nature, 399,429-436, 1999.
Sachs, J.P., and S. J. Lehmann, Subtropical North Atlantic temperature 60,000 and 30,000 years ago, Science, œ86, 756-759, 1999.
Salvignac, M. E., Variabilitd hydrologique et climatologique
dans l'ocdan austral (secteur indien) au cours du Quater-
naire Terminal, Essai de corrdlation interhdmisphdrique, Ph.D. thesis, Univ. Bordeaux 1, France, 1998.
Schneider, R. R., P. J. Mfiller, and G. Ruhland, Late Qua- ternary surface circulation in the east equatorial South Atlantic: Evidence from alkenone sea-surface tempera- tures, Paleoceanography, 10, 197-219, 1995.
Schneider, R. R., P. J. Mfiller, G. Ruhland, G. Meinecke, H. Schmidt, and G. Weifer, Late Quaternary surface tem- perature and productivity in the east-equatorial South At-
lantic: Response to changes in trade/monsoon wind forc-
ing and surface water advection, in The South Atlantic: Present and Past Circulation, edited by G. Wefer, W. H. Berger, G. Siedler, and D. J. Webb, pp. 527-551, Springer- Verlag, 1996.
Schulz, M., W. H. Berger, M. Sarnthein, and P.M. Grootes, Amplitude variations of 1470-year climate oscillations during the last 100,000 years linked to fluctuations of continental ice mass, Geophys. Res. Lett., œ6,3385-3388,
1999.
Shackleton, N.J., M. A. Hall, and E. Vincent, Phase re- lationship between millenial-scale events 64,000-24,000 years ago, Paleoceanography, in press, 2001.
Thomson, D. J., Spectrum estimation and harmonic analy- sis, Proc. IEEE, 70, 1055-1096, 1982.
Thomson, D. J., Quadratic-inverse spectrum estimates: ap- plications to palaeoclimatology, Phil. Trans. R. Soc. Lon-
don Set. A, 332,539-597, 1990.
Verbitsky, M. Y., and B. Saltzman, A diagnostic analysis of
Heinrich glacial surge events, Paleoceanography, 1, 59-65,
1995.
Vimeux, F., Variations de l'exc&s en deuterium en antarc- tique au cours des 400000 dernitres anndes: Implications climatiques, Ph.D. thesis, Univ. Paris 7, France, 1999. Vimeux, F., V. Masson, J. Jouzel, M. Stievenard, and J. R.
Petit, Glacial-interglacial changes in the ocean surface conditions in the Southern Hemisphere, Nature, $98,410-
413, 1999.
Vimeux, F., V. Masson, G. Delaygue, J. Jouzel, J.-R. Pe- tit, and M. Stievenard, A 420,000 year deuterium excess record from East Antarctica: Information on past changes in the origin of precipitation at Vostok, J. Geophys. Res.,
2001, .this issue.
Vostok Project Members, International effort helps decipher mysteries of paleochmate from Antarctic ice cores, Eos
Trans. AGU, 76, Spring Meet. Suppl., 169, 1995.
Waelbroeck, C., J. Jouzel, L. D. Labeyrie, C. Lorius,
M. Labracherie, M. Stidvenard, and N. I. Barkov, Com- paring the Vostok ice deuterium record and series from Southern Ocean core MD88-770 over the last two glacial- interglacial cycles, Clim. Dyn., 12, 113-123, 1995. Yiou, P., C. Genthon, J. Jouzel, M. Ghil, H. Le Treut,
J. M. Barnola, C. Lorius, and Y. N. Korotkevitch, High- frequency paleovariability in climate and in CO2 lev- els from Vostok ice-core records, J. Geophys. Res., 96,
20,365-20,378, 1991.
Yiou, P., M. Ghil, J. Jouzel, D. Paillard, and R. Vautard, Nonlinear variability of the climatic system, from singu- lar and power spectra of Late Quaternary records, Clim. Dyn., 9,371-389, 1994.
Yiou, P., M. F. Loutre, and E. Baert, Spectral analysis of climate data, Surv. Geophys., 17, 619-663, 1996. Yiou, P., K. Fuhrer, L. D. Meeker, J. Jouzel, S. Johnsen, and
P. A. Mayewski, Paleoclimatic variability inferred from the spectral analysis of Greenland and Antarctic ice core data, J. Geophys. Res., 102, 26,441-26,454, 1997. J. Jouzel, F. Vimeux, and P. Yiou, Institut Pierre- Simon Laplace, and Laboratoire des Sciences du Climat
et de l'Environnement, UMR CEA-CNRS, CE Saclay, l'Orme des Merisiers, 91191 Gif-sur-Yvette Cedex, France.
([email protected]. cea.fr)
(Received July 7, 2000; revised February 7, 2001; accepted February 16, 2001.)