To link to this article:
DOI: 10.1115/1.4032457
URL:
http://dx.doi.org/10.1115/1.4032457
Any correspondence concerning this service should be sent to the repository
administrator:
[email protected]
O
pen
A
rchive
T
OULOUSE
A
rchive
O
uverte (
OATAO
)
OATAO is an open access repository that collects the work of Toulouse researchers and
makes it freely available over the web where possible.
This is an author-deposited version published in:
http://oatao.univ-toulouse.fr/
Eprints ID: 15759
To cite this version:
Bousquet, Yannick and Binder, Nicolas and Dufour,
Guillaume and Carbonneau, Xavier and Trébinjac, Isabelle and Roumeas,
Mathieu Numerical Investigation of Kelvin–Helmholtz Instability in a Centrifugal
Compressor Operating Near Stall. (2016) Journal of Turbomachinery, vol. 138
(N° 7). 071007-1-071007-9. ISSN 0889-504X
Y. Bousquet
1D!epartement A!erodynamique, Energ!etique et Propulsion, Universit!e de Toulouse, ISAE, 10, Avenue Edouard Belin BP 54032, Toulouse Cedex 4 31055, France e-mail: [email protected]
N. Binder
D!epartement A!erodynamique, Energ!etique et Propulsion, Universite de Toulouse, ISAE, 10, Avenue Edouard Belin BP 54032, Toulouse Cedex 4 31055, France e-mail: [email protected]
G. Dufour
D!epartement A!erodynamique, Energ!etique et Propulsion, Universite de Toulouse, ISAE, 10, Avenue Edouard Belin BP 54032, Toulouse Cedex 4 31055, France e-mail: [email protected]
X. Carbonneau
D!epartement A!erodynamique, Energ!etique et Propulsion, Universite de Toulouse, ISAE, 10, Avenue Edouard Belin BP 54032, Toulouse Cedex 4 31055, France e-mail: [email protected]
I. Trebinjac
Laboratoire de M!ecanique des Fluides et d’Acoustique, Ecole Centrale de Lyon, UCBLyon 1, INSA, 36 Avenue Guy de Collongue, Ecully Cedex 69134, France e-mail: [email protected]
M. Roumeas
D!epartement a!eroacoustique, Liebherr-Aerospace Toulouse SAS, 408 Avenue des Etats-Unis, Toulouse 31016, France e-mail: [email protected]
Numerical Investigation of
Kelvin–Helmholtz Instability in a
Centrifugal Compressor
Operating Near Stall
The present work details the occurrence of the Kelvin–Helmholtz instability in a centrifugal compressor operating near stall. The analysis is based on unsteady three-dimensional simulations performed on a calculation domain covering the full annulus for the impeller and the vaned diffuser. A detailed investigation of the flow structure is presented, together with its evolution consequent to the mass flow reduction. It is demonstrated that this reduc-tion leads to an enlargement of the low-momentum flow region initially induced by the combination of the secondary and leakage flows. When the compressor operates near stall, the shear layer at the interface between the main flow and this low-momentum flow becomes unstable and induces a periodic vortex shedding. The frequency of such an unsteady phenomenon is not correlated with the blade-passing frequency. Its signature is thus easily isolated from the deterministic rotor/stator interaction. Its detection requires full-annulus simulations with an accurate resolution in time and space, which explains why it has never been previously observed in centrifugal compressors. [DOI: 10.1115/1.4032457]
1
Introduction
Centrifugal compressor stages used in the aeronautical industry have to simultaneously produce a high pressure ratio and high effi-ciency while minimizing the size of the element. In such applica-tions, the trend has been toward the design of high-speed impellers and vaned diffusers, which ensures a high static pressure recovery. During the design procedure, extending the operating range consti-tutes also a major challenge. In axial configurations, at low mass flow rate, the stable operating range of a compressor system is lim-ited by the occurrence of instabilities known as rotating stall and surge [1]. Such unstable phenomena induce a considerable drop of performance in terms of pressure ratio, efficiency, and mass flow.
It may also lead to serious mechanical failures. Consequently, a safety margin (surge margin) is usually imposed to prevent the compressor operation from these situations. This causes the operat-ing range reduction as much as the surge margin is important.
Many works can be found in the literature aiming at enlarging the stable operating range. This can be achieved, for example, by the use of flow control strategies as presented in the study of Skoch [2]. The reduction of the surge margin as much as possible is also an option to extend the allowed operating range. However, before considering a possible reduction of the surge margin or the design of efficient flow control strategies, it is required to achieve a good comprehension of mechanisms that develop prior the stall onset.
In axial configurations, the experimental work of Camp and Day [3] shows two different flow patterns leading to the stall inception process. The first one concerns the growth of a small amplitude disturbance with a long length scale (modal stall), while the second one concerns the growth of a higher amplitude disturb-ance but with a smaller length scale (several blade passages)
1Corresponding author.
Contributed by the International Gas Turbine Institute (IGTI) of ASME for publication in the JOURNAL OFTURBOMACHINERY. Manuscript received December 4,
2015; final manuscript received December 15, 2015; published online February 17, 2016. Editor: Kenneth C. Hall.
termed spike. More recently, another family of aerodynamic insta-bility has been observed while the compressor is still running in a stable mode. It is described as a part-span stall with a fluctuation of the number of cells. This phenomenon is known as rotating instability (RI) and has been studied in axial configurations (see, for example, Refs. [4–6]).
Considering centrifugal configurations, works on the topic can be segregated in two categories, depending on the application addressed. Works dealing with transonic compressors reaching a high pressure ratio (above 4) and associated with a vaned diffuser [7,8] and works dealing with low pressure ratio compressors (lower than 2) using vaneless diffuser [9,10]. For transonic config-urations, there is evidence that stall precursors occur in the vane-less space or in the diffuser entry region at least at the nominal rotation speed. In axial configurations, spike and modal perturba-tions have also been observed by Spakovszky and Roduner [11]. For low pressure ratio configurations, rotating stall is reported at the inlet of the rotor [12] or in the vaneless diffuser [9]. The pres-ent contribution concerns an intermediate configuration using a vaned diffuser but reaching a 2.5 pressure ratio at the design oper-ating point.
The majority of the works above mentioned aims at studying the stall inception process principally with experimental proce-dures. The description of the flow is thus partial as it is only based on steady pressure measurements. There is therefore a clear lack of knowledge considering unsteady mechanisms which may de-velop at low mass flow rate while the compressor is still running in a stable mode. Based on massively parallel computations, the present work focuses on a numerical detailed analysis of the Kelvin–Helmholtz instability occurring at the impeller inlet when the compressor operates near stall. The works demonstrate that the mass flow reduction leads to an accumulation of low-momentum flow near the leading edge of the splitter blade, close to the shroud. This low-momentum flow interacts with the main flow through a shear layer to form the Kelvin–Helmholtz instabil-ity. Despite the presence of this local flow instability, the com-pressor is still stable as no evolution toward stall and/or surge has been observed. Such unsteady phenomenon is observed for the first time in a centrifugal configuration as it requires a whole annulus computational (360 deg) associated to an accurate spatial and temporal discretization.
Following this introduction, the test case is described, together with the numerical procedure. Then, the mechanisms inducing the low-momentum flow region are presented through time-averaged flow analysis. Afterward, the development of the Kelvin–Helmholtz instability is detailed, thanks to unsteady data set postprocessing. Finally, a technique is proposed to detect such an unsteady phenom-enon in an experimental procedure as a perspective to stall detection.
2
Test Case Description
The test case is a centrifugal compressor stage, part of an air-conditioning system designed by the Liebherr-Aerospace Tou-louse SAS, TouTou-louse, France.
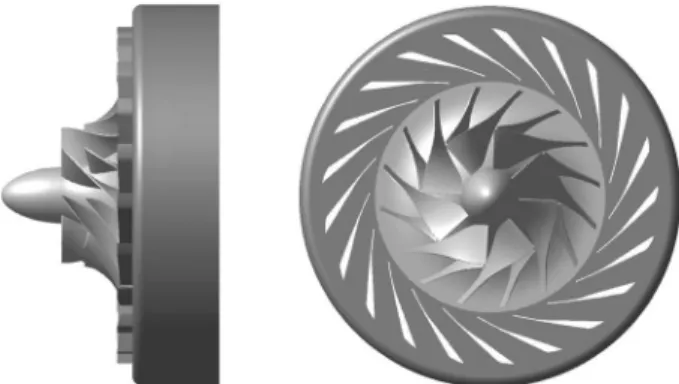
The stage is composed of a backswept splittered unshrouded impeller and a radial vaned diffuser. The flow is collected in a vo-lute in the industrial environment. The design specification is based on a stage static-to-total pressure ratio of 2.5 with a design rotation speed of 38,000 rpm. The impeller contains eight main blades and eight splitter blades with a backsweep angle of 32 deg. The impel-ler exit radius is around 100 mm. The impelimpel-ler tip gap represents 0.5% of the section height at the inlet and 3% at the exit. The vaned diffuser consists of 21 wedge-type blades. Figure 1 presents a three-dimensional view of the centrifugal compressor stage.
3
Numerical Procedure
3.1 Mesh Parameters. The calculation domain contains all the impeller and diffuser channels over 360 deg. Even though the distortion induced by the volute tongue may have an impact at
near stall condition, the volute is not modeled for cost issues. The impeller and the diffuser structured mesh grids were generated with Autogrid V5 using classical H, O, and C topologies. The pa-rameters to generate the mesh are derived from a previous study performed for the same compressor [13] in order to ensure grid-converged results. The size of the first cell is set to 3lm corre-sponding to an averaged-normalized wall distanceyþ below 1 at
the walls. The impeller main blade passage grid and splitter blade passage grid consist of 89 points in the spanwise direction includ-ing 29 points in the gap region, 92 points in the pitchwise direction, and 161 points in the streamwise direction. The diffuser blade pas-sage contains 57 points in the spanwise direction, 119 points in the pitchwise direction, and 141 points in the streamwise direction. The impeller blade passage and the diffuser blade passage include, respectively, 2:6" 106and 1:7
" 106grid points. The single
pas-sage is repeated to obtain the full annulus, and the calculation do-main reaches a total of approximately 60" 106
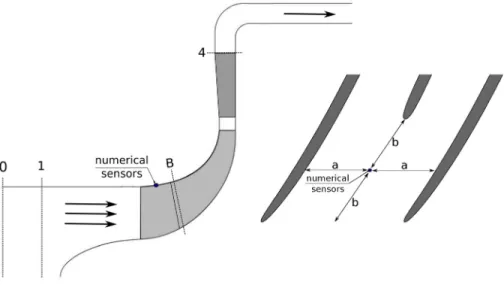
points. Figure 2
represents a meridional view of the computational domain. 3.2 Flow Solver and Numerical Parameters. Computations are performed with the ELSAsoftware owned and developed by
ONERA and codeveloped by CERFACS [14]. It uses a cell-centered approach on multiblock structured grids. The governing equations are the unsteady compressible Reynolds-averaged Navier–Stokes equations based on the conservation of mass, mo-mentum, and energy. Turbulence is modeled according to the Reynolds decomposition, and the equations are closed using the one-equation Spalart–Allmaras turbulence model [15]. The con-vective fluxes are computed with a centered second-order scheme with artificial dissipation of Jameson type, and the diffusive fluxes with a second-order centered scheme. Time integration uses the second-order dual time stepping method proposed by Jameson [16]. The time-marching in the inner loop is performed with an implicit scheme composed of the backward Euler scheme and a scalar lower-upper symmetric successive over-relaxation method as proposed by Yoon and Jameson [17]. The number of physical time steps to discretize a complete rotation is set to 1680, corre-sponding to 210 time steps per impeller main blade-passing period (the impeller has eight main blades). This temporal resolution is adequate for a satisfying description of the impeller–diffuser interactions, according to what is usually reported in the literature [18]. For each physical time step, subiterations are performed in the inner loop until a reduction of 2 orders of magnitude is reached for the residuals. This condition is generally achieved in less than ten subiterations. At least 12 impeller rotations are needed to reach the periodic state, which corresponds to approxi-mately 20,000 physical time steps. Calculations are running on 512 computing cores and require approximately 200,000 CPU hours for a single operating point.
3.3 Boundary Conditions. Considering the inlet boundary conditions, the total pressure, the total temperature, and the flow angles (axial flow) are prescribed. When the operating point
moves toward the surge line, the slope of the stage pressure ratio characteristic may reach zero or even positive values. Therefore, a static pressure exit condition is no more robust because two solu-tions may be obtained (different mass flow rates) for a same outlet pressure. Therefore, the outlet is modeled using a throttle condi-tion, coupled with a simplified radial equilibrium law. The outlet static pressurepoutis set by the relation
poutðnþ 1Þ ¼ pi0þ K m n_ð Þ
mref
! "2
(1)
wherepi0is the inlet total pressure,m_ðnÞ is the mass flow rate at
iterationn through the exit section, andK is the throttle parameter. The simulated operating point can move from choke to the surge by simply increasing the value of the throttle parameter. The rotor–stator interface is treated with a sliding mesh method [19]. At the blade, hub, and shroud walls, no-slip adiabatic conditions are prescribed.
4
Validation of the Numerical Model
Three operating points have been simulated with the numerical model above mentioned. They are referenced as OP1, OP2, and NS. OP1 represents the best efficiency operating point, while NS is localized near the experimental surge line. The operating point OP2 is located near the maximum pressure ratio.
Figure 3 depicts the total-to-static pressure ratio defined as p ¼ p4=pi1as a function of the corrected mass flow from both the
numerical simulations and measurements, for the design speed-line. The corrected mass flow is defined as
_ mcor¼m_ ffiffiffiffiffiffiffiffiffiffiffiffiffiffiffi Ti0=Tref p pi0=pref (2)
The experimental curve comes from previous work [20]. The ex-perimental value of p4 corresponds to the mean value of three
static pressure probes located on the hub surface at diffuser exit ra-dius. The static pressure from the numerical results is extracted using the same approach. Concerning the global indicators, the three computed operating points are in good agreement with the experimental data in terms of global performances. The validation of the numerical model can be assessed at this level of description.
5
Formation of the Shear Layer
The first step necessary for the understanding of the Kelvin–Helmholtz instability is to analyze the mechanism
responsible for the formation of the low-momentum flow zone. To do so, the evolution of the flow structure induced by the mass flow reduction is presented through time-averaged flow quantities. The period of the time-averaging operation equals that of a full impeller rotation. The mass flow reduction consequent to the dis-placement along the speed-line (from OP1 to NS) leads to some severe modifications of the flow pattern in the inducer part of the impeller. Theses modifications come from the natural increase of the incidence angle. It is a consequence of the composition of the velocities while decreasing the mass flow at constant rotational speed. The operating point displacement from OP1 to NS results in an increase of the incidence angle from 4 deg to 12 deg. This variation of incidence initiates the separation of the boundary layer, which occurs on the impeller blade suction side all over the span. To illustrate this separation, Fig.4represents the line inte-gral convolution of the skin friction pattern on the impeller blade suction side for the operating point OP1 and NS. Only 70% of the streamwise coordinate are illustrated.
For the operating point OP1, the friction lines are in a general trend toward the axial direction, in the first section of the inducer (after the leading edge) and move toward the radial direction when the streamwise coordinate increases. The meridional curva-ture is one of the multiple sources of secondary flow found in the centrifugal impeller [21]. It induces a flow migration from hub to shroud (positive radial migration) of the low-momentum flow confined in the impeller blade boundary layer. Therefore, it can be noticed that the friction lines do not follow the shroud and hub
Fig. 3 Pressure ratio of the compressor stage Fig. 2 Meridional view of the compressor stage with the position of the numerical
curvature but are oriented toward the shroud where the meridional curvature is high. For the operating point NS, the friction lines clearly show the boundary layer separation. The friction lines are consequently oriented toward the radial direction around the sepa-ration line. It means that the low-momentum flow in the separa-tion zone is driven toward the shroud.
This mechanism occurring at low mass flow rate, which associ-ates the boundary layer separation and the radial migration, pro-vokes a significant enlargement of the wake of the usual jet-wake structure observed in the centrifugal impeller. In unshrouded impellers, the jet-wake structure is generally formed by the associ-ation of the main flow and of the tip leakage and secondary flows. Presently, at OP1 operating point, the jet-wake structure develop-ment begins after the leading edge of the splitter blade (high meridional curvature part). This means that in the inducer part, the low-momentum flow is mainly a consequence of the leakage flow effect. But for the NS operating point, the migration toward the shroud of the low-momentum fluid concentrated in the sepa-rated region interacts with the leakage flow. It is transported and stretched all over the circumferential direction near the shroud. This mechanism is presented in Fig.5. As a consequence, for the operating point NS, the low-momentum fluid concentrates near the shroud in the impeller inducer.
The alteration of the jet-wake structure is illustrated in Fig.6. It represents the normalized time-averaged meridional velocity in section B localized 2 mm after the leading edge of the splitter blade (Fig.2) for both operating points OP1 and NS. The velocity is normalized by Vm0, which represents the averaged value at
the inlet of the numerical domain. At the operating point OP1, the right channel is mostly composed of the main flow, while in the left channel the leakage flow effects generate a low-momentum fluid zone near the shroud. The mass flow reduction does not sig-nificantly affect the right channel. However, in the left channel, a large region of low-momentum flow is noticeable near the shroud for the NS operating point. Again, this accumulation of low-momentum flow is the consequence of the separation occurring on the impeller blade suction side and of the radial flow migration.
The main flow and the low-momentum flow are also repre-sented in Fig. 7. It shows again the normalized time-averaged meridional velocity at 90% span in the impeller inducer. At this specific spanwise position, the trace of the leakage flow presents a strong development, in response to the displacement of the operat-ing point from OP1 to NS. Initially confined in the left channel (channel defined by the suction side of the main blade and the pressure side of the splitter blade), it expands to the point of a partial contamination of the right channel (channel defined by the suction side of the splitter blade and the pressure side of the main blade). In addition to the spatial expansion, a large decrease of
Fig. 4 Line integral convolution of the skin friction pattern on the impeller blade suction side for OP1 and NS operating points
Fig. 5 Illustration of the flow mechanism in the blade tip region
Fig. 6 Contours of time-averaged reduced meridional velocity at section B for OP1 and NS operating points
momentum is observed, which results in very low velocity magnitude. The consequence is the intensification of the velocity gradients at the interface between the main flow region and the low-momentum flow region.
This accumulation of low-momentum flow has some consequen-ces on the vorticity field. This is illustrated in Fig.8, which repre-sents the time-averaged magnitude of the vorticity vector at 90% span in the impeller. It clearly shows that for the operating point NS, the interface between the main flow and the low-momentum flow is associated with an increase of the magnitude of the vortic-ity. The thickness of the shear layer is denoted 2d0 and will be
used in Sec.6. The boundaries of the shear layer zone are defined by vorticity values equal to 10% of the maximum value.
6
Investigation of the Kelvin–Helmholtz Instability
This section focuses on the development of the Kelvin–Helmholtz instability, thanks to the postprocessing of the unsteady data set.
6.1 Unsteady Flow Pattern. The analysis of the unsteady flow field in one channel reveals that the shear layer at the inter-face between the main flow and the low-momentum flow region
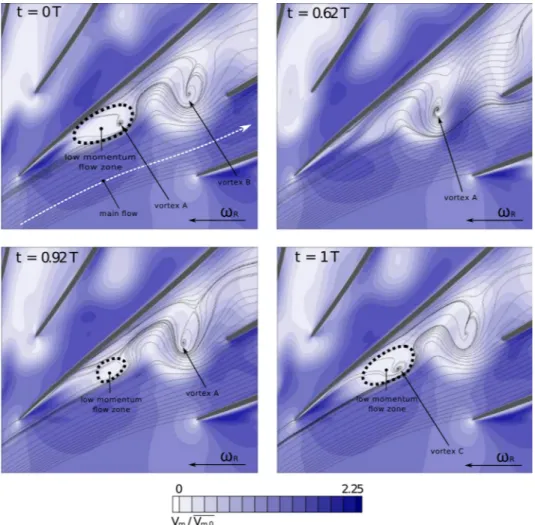
(defined in Sec. 5) is significantly unsteady. This unsteadiness originates from the Kelvin–Helmholtz instability, which induces a vortex shedding phenomenon, as illustrated in Fig.9. It represents the instantaneous meridional velocity with a superposition of the instantaneous streamlines at 90% span in the impeller inlet, for four different time steps. The formation and the displacement of the vortices can be observed. The mechanism can be described as follows:
— Att¼ 0T (T represents the period of the vortex shedding), a low-momentum flow region is visible near the suction side of the impeller blade (black circle), due to the bound-ary layer separation. The relative velocity inside this zone reaches zero. As mentioned before, the flow from the sepa-ration migrates toward the shroud and is transported by the leakage flow. The viscous interaction with the main flow finally generates a vortex (referenced vortex A) in the low-momentum flow region. This instant is referenced ast¼ 0 and represents the beginning of the vortex development; — Fromt¼ 0T to t ¼ 0:62T, the vortex A expands and is
con-vected by the main flow. Att¼ 0:62T, the low-momentum flow region previously mentioned (black circle) is no
Fig. 7 Contours of time-averaged reduced meridional velocity
longer observed near the leading edge. This low-momentum fluid has been driven downstream by the vortex core;
— Att¼ 0:92T, a low-momentum flow region appears again (black circle) while the vortex A is still noticeable and reaches the leading edge of the splitter blade;
— Att¼ 1T, the low-momentum flow region (black circle) has reached the critical size. The intensity of the velocity gradients in the shear layer is such that a new vortex is forming.
Approximately six vortices are shed during one impeller rota-tion. A three-dimensional view of the vortex structure is presented in Fig. 10. It shows an isosurface of k2 vortex criteria [22] (golden), an isosurface of positive axial velocity (blue) represent-ing the main flow, and an isosurface of negative axial velocity (red) representing the low-momentum flow. To obtain the k2 values, the velocity gradient tensorJ is decomposed into its sym-metric partS and antisymmetric partX. Then, the second eigen-values ofJ2þ X2are determined and referenced ask
2. It can be observed that the vortex is localized at the interface between the two flow structures. This unsteady mechanism is similar to the type of Kelvin–Helmholtz instability that develops at the interface between two fluids with different velocities.
6.2 Spectral Analysis. In a general way, for operating points far enough from the surge line, the major source of unsteadiness is expected to come from the interaction between the impeller and the vaned diffuser. In the present analysis, unsteady postprocess-ing is performed with the discrete Fourier transform applied to static pressure signals. The data are extracted from eight
numerical probes (the impeller has eight main blades) positioned at shroud, at the impeller inlet (see Fig.2). More precisely, the probes are localized at midway between the leading edge of the main blade and the splitter blade. The position of the probes relative to the blades is therefore identical for each channel. The extraction is performed in the rotating frame. It means that
Fig. 9 Contours of instantaneous reduced meridional velocity in the impeller inducer at 90% span for the NS operating point
Fig. 10 Isosurface of positive axial velocity (blue), isosurface of negative axial velocity (red), and isosurface of k2vortex
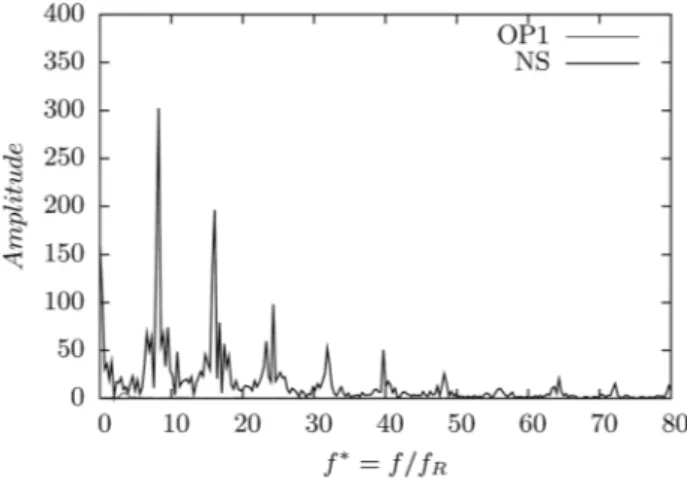
the numerical probes rotate with the impeller. For the operating point OP1, the amplitude of the discrete Fourier transform reveals that the fluctuating part of the signal only results from the blade passage effects (not presented here). At operating point NS, the spectral content is much more complex due to the presence of the Kelvin–Helmholtz instability. New frequencies emerge, decorre-lated from the blade-passing frequency (Fig.11). The frequency is reduced by the impeller rotational frequency fR that is equal to xR=2p. In the rotating frame, the emergence of the fundamental
frequency consequent to the potential effects of the 21 vanes of the diffuser could be expected. Indeed, a peak located at the reduced frequencyf&¼ 21 is visible in the spectra, even if the
extraction of the data is performed in the inlet part of the impeller. The upstream propagation of the potential effect is actually possi-ble, thanks to the subsonic regime of the flow inside the compres-sor. Other peaks are present, such as the one observed near f&¼ 6. This unsteadiness is induced by the vortex shedding
phe-nomenon. It is detected with the same properties (frequency and amplitude) by all the eight numerical probes. It is thus similar in intensity in the eight main blade channels of the impeller. The sec-ond harmonic of this unsteady phenomenon, close tof&¼ 12, is
also noticeable in the frequency spectra. Also, the interaction of the frequency f&¼ 6 and the blade-passing frequency f&¼ 21
induces two more peaks located atf&¼ 21 ' 6 and f&¼ 21 þ 6.
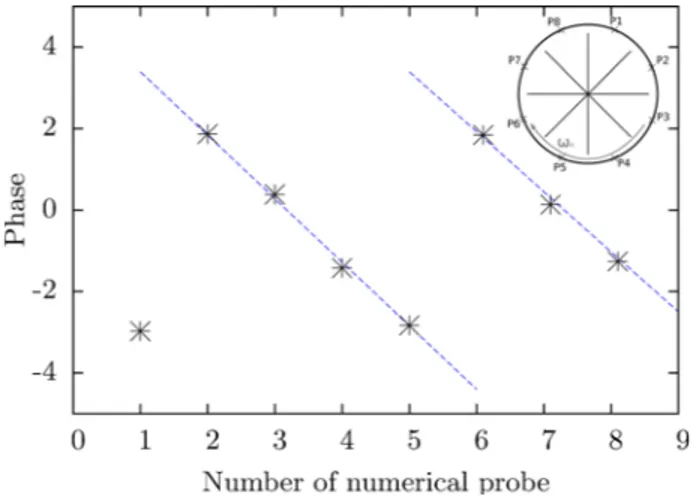
The fact that the vortex shedding phenomenon resulting from the Kelvin–Helmholtz instability occurs in all the blade passages of the impeller is not surprising. Indeed, the origin of this mecha-nism comes from the separation on the impeller blade suction side induced by the increase of the incidence. The high incidence values affect equally all the impeller blades. Consequently, the amplitude of the peak atf&¼ 6 observed in the spectra is similar
for each channel of the impeller. However, the phase of this unsteadiness changes from one channel to another, as shown in Fig.12, where the phase part of the discrete Fourier transform is represented for this specific frequency. The figure shows that the vortex shedding phenomenon in the opposite channels (1 and 5, 2 and 6…) is in phase. This specificity is illustrated in Fig.13 repre-senting the static pressure at 90% span for five channels. The posi-tion of the vortices can be tracked by the presence of rounded zones with low static pressure values (circles). In channels 1 and 5, the position of the vortex is nearly identical. Then, it exists a spatial periodicity of four channels. It can therefore be concluded that the modal nature of this vortex shedding phenomenon is a two-lobe mode. As all the impeller blades are similar, such a dis-tribution may be linked to spatial modes resulting from the inter-action between the impeller and the vaned diffuser. However, beside the presence of the Kelvin–Helmholtz instability, it has to be reminded that the compressor is still running in a stable mode.
6.3 Kelvin–Helmholtz Interpretation. A theoretical repre-sentation of a velocity profile leading to Kelvin–Helmholtz insta-bility is presented in Fig.14. The thickness of the shear layer is denoted 2d0. The linear stability of a temporally evolving shear
layer [23] predicts that the most unstable perturbation, known as Kelvin–Helmholtz mode, has a longitudinal wave-number a equal to
a ¼0:4446d
0
(3)
which corresponds to a wavelength of kx¼2p
a (4)
It can be measured by the distance between two consecutive vortices when the shear layer has rolled-up to form Kelvin–Helmholtz bil-lows. In the compressor test case, the thickness of the time-averaged shear layer (2d0) has been measured and is approximately equal to
2:8 mm. The theoretical distance between the center of two vortices is thus predicted and equal tokx¼ 19:8 mm. The distance extracted
from the simulation data iskx¼ 17:66 mm, which is in acceptable
agreement with the theory.
7
Toward the Detection of the Instability
For this compressor, the unsteadiness generated by the Kelvin–Helmholtz instability could be used as an indication of approaching the surge line. The present part evaluates the possi-bilities to detect such an unsteady phenomenon. The static pres-sure signals used to build the frequency spectra, previously discussed (Fig.11), are extracted in the rotating frame. There is no equivalent experimental procedure to provide this data. Indeed, the pressure sensors are generally flush mounted at the shroud, and the extraction is in the fixed frame. It is thus interesting to check if the signature of such an unsteady phenomenon is still present. To do so, the static pressure is extracted with a numerical probe at the same location but in the fixed frame. Figure15 repre-sents the frequency spectra of this static pressure signal for the two operating points. No clear differences are observed between the two operating points. The peaks in amplitude are localized on the impeller blade-passing frequenciesf&¼ n ( NR¼ n ( 8.
There-fore, the detection of the Kelvin–Helmholtz instability with sen-sors in the fixed frame appears difficult at a first sight.
In fact, another step in the data processing is necessary to reveal the signature of the Kelvin–Helmholtz instability. It mainly
Fig. 11 Amplitude of the discrete Fourier transform of static pressure signals extracted in the relative frame in the impeller inducer for the operating point NS
Fig. 12 Phase of the vortex shedding frequency extracted from the height numerical probes positioned in the impeller blade channels at shroud
consists of the filtering of the mean pattern of the blade passage from the instantaneous signal. First of all, the original static pres-sure signal p(t) is phase-averaged, based on the blade-passing period. This gives the averaged evolution of the pressure during one impeller blade passage. This sample is denoted aspðtÞR. It is then duplicated to cover the full length of the signalp(t). A fluctu-ation of the static pressure defined as gpðtÞ ¼ pðtÞ ' pðtÞR is thus calculated. Finally, a discrete Fourier transform is applied on the signal gpðtÞ. This processing method is applied for the operating points OP1 and NS, and the results are presented in Fig.16. For the operating point OP1, the frequency spectrum does not show any peaks of amplitude. The flow is strictly periodic with the blade-passing frequency. Therefore, the result of the phase-averaged operation is similar to the instantaneous pattern over one period of the impeller blade passage. All the fluctuating contribu-tions have been filtered. For the operating point NS, the flow is no more strictly periodic with the blade-passing frequency, because of the presence of the vortices and their phase-lag between the channels. Therefore, the signal gpðtÞ is the fluctuation of the static pressure around the mean pattern of a blade passage. This fluctua-tion is significant, and its spectral characterizafluctua-tion shows peaks of amplitude nearf&¼ n ( NR¼ n ( 8. It is thus possible to detect this
vortex shedding phenomenon with the data collected by a static pressure sensor in the fixed frame. The effective detection of this precursor still needs to be demonstrated in an experimental envi-ronment. However, it is a promising approach for the indication of the proximity of the stability limit.
8
Additional Comments
The unsteady phenomenon presented in this paper is different than the usual rotating stall. Indeed, the unsteadiness is not com-ing from a rotatcom-ing boundary layer separation. Also, the reason for the unsteadiness is local (the Kelvin–Helmholtz local instability),
and the constant phase shift between the channels is just due to cyclic periodicity (not the rotation of a phenomenon from one channel to the other). However, this phenomenon may be a pre-cursor to a rotating stall. It is also different than rotating instabil-ities, as discussed for instance in Ref [4]. Indeed, in Ref [4], RI is characterized by a nonpermanent behavior in time (quoting: “fluctuating number of cells”), which is not the case here as the phenomenon is permanent in time (frequency and modal content do not evolve).
9
Conclusion
Unsteady numerical simulations comprising the full annulus of the impeller and the vaned diffuser have been performed in a
Fig. 13 Contour of instantaneous reduced static pressure in the impeller at 90% span for the NS operating point
Fig. 14 Theoretical representation of the velocity profile in a shear layer
Fig. 15 Amplitude of the discrete Fourier transform of a static pressure signal in the fixed frame in the impeller inducer
Fig. 16 Amplitude of the discrete Fourier transform of a treated static pressure signal in the fixed frame in the impeller
centrifugal compressor stage. The main objectives were to present a new unsteady mechanism occurring at near stall condition while the compressor is still running in a stable mode. The detailed anal-ysis has revealed that the mass flow reduction leads to an accumu-lation of low-momentum fluid near the leading edge of the splitter blade close to the shroud. The interface between the low-momentum flow and the main flow forms an intense shear layer zone. At near stall condition, the intensity of the velocity gradient in the shear layer is such that the Kelvin–Helmholtz instability develops and leads to a periodic vortex formation. The data-processing of the time-dependent static pressure signals shows that the characteristic frequency of this unsteady phenomenon compares favorably with the linear theory of a temporal shear layer. Finally, a methodology has been developed in order to export the possible detection of this phenomenon to the experi-mental environment and thus of the surge onset in centrifugal compressor.
Acknowledgment
The authors would like to express their thanks to Liebherr Aerospace Toulouse S.A.S for supporting the present research program and to the CFD team of CERFACS for its help and sup-port in the achievement of numerical simulations. The authors are also grateful to GENCI-CINES for providing computational resources.
Nomenclature
f¼ frequency (s) _
m¼ mass flow (kg/s) MB, SB¼ main blade, splitter blade
p¼ pressure (Pa)
PS, SS¼ pressure side, suction side t¼ time (s)
T¼ time period (s), temperature (K) V¼ absolute velocity (m/s)
Greek Symbols
X ¼ vorticity vector x ¼ rotation speed (rad/s)
Superscripts and Subscripts
i¼ total quantity
m, r, t¼ meridional, radial, tangential R¼ rotor
ref¼ reference S¼ stator
*¼ reduced quantity
0¼ location of the calculation domain inlet 1¼ location of the impeller inlet
4¼ location of the diffuser exit
References
[1] Greitzer, E. M., 1981, “The Stability of Pumping Systems—The 1980 Freeman Scholar Lecture,”ASME J. Fluids Eng.,103(2), pp. 193–242.
[2] Skoch, G. J., 2003, “Experimental Investigation of Centrifugal Compressor Sta-bilization Techniques,”ASMEPaper No. GT2003-38524.
[3] Camp, T. R., and Day, I. J., 1998, “1997 Best Paper Award—Turbomachinery Committee: A Study of Spike and Modal Stall Phenomena in a Low-Speed Axial Compressor,” ASME J. Turbomach.,120(3), pp. 393–401.
[4] Mailach, R., Lehmann, I., and Vogeler, K., 2001, “Rotating Instabilities in an Axial Compressor Originating From the Fluctuating Blade Tip Vortex,”ASME J. Turbomach.,123(3), pp. 453–460.
[5] Marz, J., Hah, C., and Neise, W., 2002, “An Experimental and Numerical Inves-tigation Into the Mechanisms of Rotating Instability,”ASME J. Turbomach., 124(3), pp. 367–374.
[6] Inoue, M., Kuroumaru, M., Tanino, T., Yoshida, S., and Furukawa, M., 2001, “Comparative Studies on Short and Long Length-Scale Stall Cell Propagating in an Axial Compressor Rotor,”ASME J. Turbomach.,123(1), pp. 24–30. [7] Trebinjac, I., Bulot, N., Ottavy, X., and Buffaz, N., 2011, “Surge Inception in a
Transonic Centrifugal Compressor Stage,”ASMEPaper No. GT2011-45116. [8] Toyama, K., Runstadler, P., and Dean, R., 1977, “An Experimental Study of
Surge in Centrifugal Compressors,”ASME J. Fluids Eng.,99(1), pp. 115–124. [9] Mizuki, S., and Oosawa, Y., 1991, “Unsteady Flow Within Centrifugal
Compressor Channels Under Rotating Stall and Surge,” ASME Paper No. 91-GT-085.
[10] Tomita, I., Ibaraki, S., Furukawa, M., and Yamada, K., 2013, “The Effect of Tip Leakage Vortex for Operating Range Enhancement of Centrifugal Compressor,”ASME J. Turbomach.,135(5), p. 051020.
[11] Spakovszky, Z., and Roduner, C., 2009, “Spike and Modal Stall Inception in an Advanced Turbocharger Centrifugal Compressor,” ASME J. Turbomach., 131(3), p. 031012.
[12] Emmons, H., Pearson, C., and Grant, H., 1955, “Compressor Surge and Stall Propagation,” Trans. ASME,77(4), pp. 455–469.
[13] Dufour, G., Carbonneau, X., Arbez, P., Cazalbou, J.-B., and Chassaing, P., 2004, “Mesh-Generation Parameters Influence on Centrifugal Compressor Sim-ulation for Design Optimization,”ASMEPaper No. HT-FED2004-56314. [14] Cambier, L., and Gazaix, M., 2002,elsA: An Efficient Object-Oriented Solution
to CFD Complexity, Office National d Etudes et de Recherches Aerospatiales Onera-Publications-Tp(15).
[15] Spalart, P. R., and Allmaras, S. R., 1994, “A One-Equation Turbulence Model for Aerodynamic Flows,”La Rech. A!erospaciale,1, pp. 5–21.
[16] Jameson, A., 1991, “Time Dependent Calculations Using Multigrid, With Applications to Unsteady Flows Past Airfoils and Wings,”AIAAPaper No. 1596.
[17] Yoon, S., and Jameson, A., 1987, “An Lu-SSOR Scheme for the Euler and Navier–Stokes Equations,”AIAAPaper No. 600.
[18] Sicot, F., Dufour, G., and Gourdain, N., 2012, “A Time-Domain Harmonic Balance Method for Rotor/Stator Interactions,”ASME J. Turbomach.,134(1), p. 011001.
[19] Fillola, G., Le Pape, M.-C., and Montagnac, M., 2004,Numerical Simulations Around Wing Control Surfaces, Office National d Etudes et de Recherches Aerospatiales Onera-Publications-Tp(186).
[20] Dufour, G., Carbonneau, X., Cazalbou, J.-B., and Chassaing, P., 2006, “Practical Use of Similarity and Scaling Laws for Centrifugal Compressor Design,”ASMEPaper No. GT2006-91227.
[21] Cumpsty, N. A., 1989,Compressor Aerodynamics, Longman Scientific & Tech-nical, Essex, UK.
[22] Jeong, J., and Hussain, F., 1995, “On the Identification of a Vortex,”J. Fluid Mech.,285, pp. 69–94.
[23] Michalke, A., 1964, “On the Inviscid Instability of the Hyperbolictangent Velocity Profile,”J. Fluid Mech.,19(4), pp. 543–556.