https://doi.org/10.4224/40001818
Vous avez des questions? Nous pouvons vous aider. Pour communiquer directement avec un auteur, consultez la première page de la revue dans laquelle son article a été publié afin de trouver ses coordonnées. Si vous n’arrivez pas à les repérer, communiquez avec nous à PublicationsArchive-ArchivesPublications@nrc-cnrc.gc.ca.
Questions? Contact the NRC Publications Archive team at
PublicationsArchive-ArchivesPublications@nrc-cnrc.gc.ca. If you wish to email the authors directly, please see the first page of the publication for their contact information.
https://publications-cnrc.canada.ca/fra/droits
L’accès à ce site Web et l’utilisation de son contenu sont assujettis aux conditions présentées dans le site LISEZ CES CONDITIONS ATTENTIVEMENT AVANT D’UTILISER CE SITE WEB.
READ THESE TERMS AND CONDITIONS CAREFULLY BEFORE USING THIS WEBSITE. https://nrc-publications.canada.ca/eng/copyright
NRC Publications Archive Record / Notice des Archives des publications du CNRC :
https://nrc-publications.canada.ca/eng/view/object/?id=b2302cbe-9fe2-4e78-be55-480ef531af91
https://publications-cnrc.canada.ca/fra/voir/objet/?id=b2302cbe-9fe2-4e78-be55-480ef531af91
NRC Publications Archive
Archives des publications du CNRC
For the publisher’s version, please access the DOI link below./ Pour consulter la version de l’éditeur, utilisez le lien DOI ci-dessous.
Access and use of this website and the material on it are subject to the Terms and Conditions set forth at
Object model creation from multiple range images: acquisition,
calibration, model building and verification
Beraldin, Jean-Angelo; Cournoyer, Luc; Rioux, Marc; Blais, François;
El-Hakim, Sabry; Godin, Guy
National Research Council Canada Institute for Information Technology Conseil national de recherches Canada Institut de technologie de l'information
Object Model Creation from Multiple Range
Images: Acquisition, Calibration, Model
Building and Verification *
Beraldin, J.-A., Cournoyer, L., Rioux, M., Blais, F., El-Hakim,
S.F., and Godin, G.
May 1997
* published in the Proceedings of the International Conference on Recent Advances in 3-D Digital Imaging and Modeling. Ottawa, Ontario, Canada. May 12-15, 1997. pp. 326-333. NRC 40169.
Copyright 1997 by
National Research Council of Canada
Permission is granted to quote short excerpts and to reproduce figures and tables from this report, provided that the source of such material is fully acknowledged.
Object model creation from multiple range images: Acquisition, Calibration,
Model Building and Verification.
1J-A Beraldin, L. Cournoyer, M. Rioux, F. Blais, S.F.El-Hakim and G. Godin
National Research Council of Canada
Institute for Information Technology
Ottawa, Ontario, Canada, K1A 0R6
beraldin@iit.nrc.ca
1 NRC 40169
Abstract
This paper demonstrates the accuracy of a prototype Laser Range Camera (LRC) developed at the National Research Council of Canada for the creation of models of real objects. A laser survey performed in collaboration with the Canadian Space Agency and NASA is used as a test case. The object selected for this particular test case is the Orbiter Docking System (ODS) located at the Kennedy Space Center, Florida. During the laser survey, 128 range (and registered intensity) images were acquired all around the ODS. These images were then processed in our laboratory. A full model of the top portion of the ODS was created along with an almost complete model of the ODS. The ODS has a diameter of 1.6 m and a height of 3.9 m. Targets mounted on the top portion of the ODS were used to assess the accuracy of the calibration and of the image registration process. These targets were measured with a network of theodolites a day prior to the laser survey and used as a reference. With the current calibration and range image registration techniques, an accuracy better than 0.25 mm in X and Y, and, 0.80 mm in Z was achieved. These results compare favorably with the single point accuracy obtained after calibration, i.e., about 0.25 mm in X and Y, and, 0.50 mm in Z. These figures and others should testify on the usefulness of a LRC for accurate model building.
1. Introduction
1.
1. Virtual environment technology
Virtual Environment (VE) technology is in the process of radically changing the way people interact with computers. The entertainment industry is obviously a leading market. Other fields that benefit from VE
technology are training, industrial design/prototyping, and medical, to name a few. The main components of a VE system are an accurate modeling of the behavior of objects in a given environment and a visual representation of that environment which can give a person a compelling sense of immersion. One way to obtain a computer-generated environment that is a truthful representation of a real environment is to use a Laser Range Camera (LRC) for the digitization of objects and their surroundings. This LRC has to be precise and well calibrated, i.e., accurate. El-Hakim et al. [1] described the National Research Council of Canada (NRC) Virtual Environment Wall (ViEW). The primary goal of this facility is to develop a 3D electronic visualization testbed that will integrate technologies in the field of VE, real-time imaging and 3D sensing. Other goals are to demonstrate the realism of a reconstruction from digital models produced with our LRC’s, to develop new modeling schemes, test devices to interact with the VE, and to assess the usefulness of VE in new applications.
1.
2. ODS experiment
Results demonstrating the accuracy of NRC’s LRC for the creation of models and measurements of real objects are presented with a test case that was performed in collaboration with the Canadian Space Agency (CSA) and NASA. The goal of this test was to evaluate a laser range imaging technology in tasks that will ease the assembly of the space station ALPHA. Because of the harsh lighting conditions found in space, this technology is regarded as a key element during the construction and the maintenance of the space station. Currently, MIR is used more or less as a testbed. In November 1995, the space shuttle Atlantis (STS-74) was launched with the objective of assembling and installing a permanent docking port for future shuttle
flights to MIR. This Docking port is composed of 2 sections: the Russian Docking Module (RDM) and the Orbiter Docking System (ODS). Together, these will provide the mechanism to attach the shuttle to MIR and allow equipment and crew members to move back and forth between the space crafts. The following sections present the results of a laser survey of the Orbiter Docking System performed in January 1996 in the Vehicle Assembly Building (VAB) located at the Kennedy Space Center (KSC).
1.
3. Accuracy and model building
For active range cameras, accuracy evaluation in the context of model building has not been extensively investigated [1][2]. Some papers cover the comparison of the measurement accuracy of one or many range vision technologies based on a number of tests and criteria [3][4]. Therefore, the primary objective of this paper is to provide accuracy figures related to the process of building a model from multiple range images. The authors hope to fill some of the gaps found in the literature, and consequently encourage vision system manufacturers as well as users to publish accuracy results with similar testing procedures. This paper is divided in 5 sections. Section 2 gives some background material on the laser range camera and its calibration. Section 3 is devoted to the analysis of the data gathered on the ODS. The first half contains the results on the accuracy assessment on features (targets and surfaces). Where applicable, measurements on targets are compared to those obtained from an independent method based on a network of theodolites. The second half presents the results on the creation of multi-resolution models from multiple scans taken at various locations accessible around the ODS. Section 4 discusses the results obtained with the LRC. An example demonstrating the strength of a laser survey is shown. Finally, a conclusion appears in Section 5.
2. Laser range camera
2.
1. Principle
Among the many non-contact techniques proposed for the extraction of 3-D information from a scene, active triangulation is used in applications as diverse as reverse engineering [5] and wood measurement [6]. Three-dimensional digital imaging systems based on two different optical arrangements were developed and demonstrated at NRC. They are the auto-synchronized principle [7] upon which the LRC is based, and the BIRIS system [6]. These range cameras provide registered range
and intensity data for visible surfaces. Rioux [7] introduced this synchronized scanning scheme, with which large fields of view with small triangulation angles can be obtained without sacrificing precision. With smaller triangulation angles, a reduction of shadow effects is inherently achieved. The intent is to synchronize the projection of the laser spot with its detection. For this optical geometry, the instantaneous field of view of the position detector follows the spot as it scans the scene. Therefore, the focal length of the lens is related to the desired depth of field (DOF) and not to the field of view (FOV). Implementation of this triangulation technique by an auto-synchronized scanner approach allows a considerable reduction in the optical head size compared to conventional triangulation methods. Figure 1 depicts the auto-synchronization effect produced by a double-sided mirror.
A 3-D surface map can be captured in three ways. The triangulation plane defined by the laser beam (as depicted in Figure 1) can be
• translated in a direction orthogonal to it with a precise translation stage,
• rotated around an axis parallel to it with a precise rotation stage, or
• scanned by a second mirror that is placed orthogonal to the first one.
By translating or rotating the object, one can achieve similar results. Figure 2 displays schematically the basic components of a dual scan axis auto-synchronized camera. See Beraldin et al. [8] for the functions of 3-D coordinate computation. The LRC for this laser survey uses this method. CCD Lens Fixed Mirror Scanning Mirror Source Fixed Mirror
Figure 1. Single-axis auto-synchronized scanner.
0.5 m Position Detector Laser Y-Axis Scanner X-Axis Scanner Collecting Lens
Figure 2. Dual-axis auto-synchronized scanner.
2.
2. Calibration
Owing to the shape of the coordinate system spanned by the variables measured with range cameras, the resultant images are not compatible with the coordinate system used by most geometric image processing algorithms, e.g., rectangular coordinate system. A calibration of the range camera is therefore required for any scanning method. The calibration techniques used at NRC are divided in two main groups [8]: 1) look-up table construction with linear interpolation (or local model fitting) and 2) global model fitting. The latter procedure relies on the fact that the parameters of a mathematical model describing the camera operation can be extracted from known target locations. This model includes internal (lens focal length, distortion parameters, scanning parameters, etc.) and external (LRC orientation) camera parameters. The expected precision of a particular laser range camera is computed from the error propagation of measurements of the position of the laser spot on the detector, the scanning mirror or motion stage controller, and the geometry of the sensor. These precision estimates are used to determine the optimal distance
camera-to-object for a given survey.
In a laser survey such as the one of the ODS, a large portion of the time is devoted to planning the number of views and on the proper sequence in acquiring those views. The time constraint being an important one, it was determined that about 128 views could be taken on the ODS within the time slot allowed by NASA. This number of images gives an average spatial resolution in X and Y
of about 1 mm × 0.5 mm for a distance camera-ODS, Z, varying between 1.0 m and 2.5 m. With a LRC field of view of 40° × 50°, one gets an image resolution of 512 × 1024. These choices are optimal considering the dimension of the ODS, i.e., diameter of 1.6 m, height of 3.9 m and a span of the supporting structure of 4.5 m.
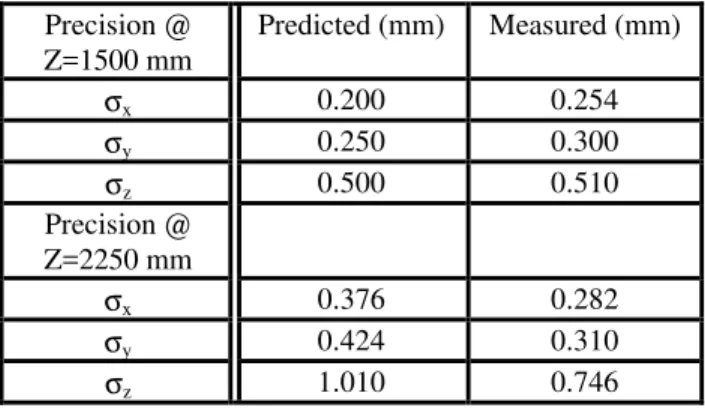
The LRC was calibrated in our laboratory at a temperature of about 26oC. During the 2-day laser survey, the temperature near the ODS varied between 24oC and 28oC. The camera precision in XYZ as obtained after the calibration process is presented in Table 1. The results are in agreement with the values published in previous papers [4][8][9]. It is important to note that the Z axis points away from the LRC. The X and Y axes are obviously orthogonal to it. With the LRC model parameters, it is then possible to convert the raw range images of the ODS acquired during the laser survey into calibrated (X,Y,Z) images. Definitions of resolution, precision and accuracy are available in [8]-[10].
Table 1. Comparison of precision: predicted versus measured after calibration and at two distances from the LRC.
Precision @ Z=1500 mm Predicted (mm) Measured (mm) σx 0.200 0.254 σy 0.250 0.300 σz 0.500 0.510 Precision @ Z=2250 mm σx 0.376 0.282 σy 0.424 0.310 σz 1.010 0.746
3. Data analysis and results
3.
1. Accuracy assessment from object feature
extraction
The first part of this section is devoted to the assessment of the combined accuracy of the calibration and the range image registration process using targets. The range image is used to determine the shape of the object (surfaces) while the intensity image serves to extract edges and features such as holes and targets. There are a total of 6 targets on the ODS. Not all targets are visible in one image. Figure 3 shows a typical intensity image of two targets as acquired by the LRC. Figure 4 shows the results after synthetically shading 2 merged range images. The targets were extracted in each images
and a circle was fitted to the range data with a technique described in [9]. This technique yields the diameter and the location of the targets center. After the extraction, each coordinates of the centers must be transformed with a rigid body transformation, into a common coordinate system. Actually, two rigid body transformations are performed on the coordinates of the targets.
Figure 3. Typical intensity image of two targets as acquired by the LRC.
Figure 4. Range image of four targets and ODS surfaces displayed with synthetic shading.
The first transformation uses the matrices obtained from the registration process originating at the ODS model creation level (see Section 3.2). This process yields
the location of the targets in the ODS model coordinate system. The second step performs another rigid body transformation, that is from the ODS model to the actual Space Shuttle coordinate system. This last transformation was done with the data collected from the theodolite survey and is necessary in order to compute the accuracy.
The average distance between the targets and the laser range camera is about 1.4 m. Multiple measurements at each target (about 2 per target) were averaged. Table 2 shows the differences between the target centers taken from the two surveys, i.e., Laser and Theodolite. The YODS axis in the Space Shuttle coordinate system
corresponds to the Z axis of the LRC. Hence, this translates to XODS -> XLRC, YODS -> ZLRC, and ZODS ->
YLRC.
Table 2. Difference between Theodolite and Laser range camera surveys on targets.
Target Number Difference (mm) XODS YODS ZODS
Target 1 +0.168 +1.016 -0.097 Target 2 +0.122 +1.107 -0.175 Target 3 -0.066 -0.376 +0.020 Target 4 -0.424 -0.257 +0.310 Target 5 -0.145 -1.062 -0.394 Target 6 +0.345 -0.428 +0.336 Accuracy (RMS) 0.246 0.793 0.259
3.
2. Model creation
The second part of this section presents how multi-resolution models of the ODS were created. First, the images have to be aligned. Then, a model is created after merging (removal of overlaps) and compression processes. The technique implemented in the software is explained in the paper by Soucy and Laurendeau [11].
The primary goal of the laser survey is to have an as complete dimensional description of the ODS as possible. In order to achieve this task, multiple scans were taken at various locations all around the ODS. These views have enough overlap between them to find the registration and to merge them together. Two models were created. The first model is a representation of the top portion of the ODS. For this model (Figure 5), 24 views are re-interpolated at every 2 mm from the original files and are aligned together using the IMAlignTM program from the POLYWORKSTM software [12]. The views are then merged in one integrated model using IMMergeTM with a step size of 4 mm. Although this model (Figure 6) has a reduced resolution compared to the original data (Figure
5), still, it contains 406 000 polygons. To allow real time manipulation on a graphic workstation, another representation of the same model with fewer polygons was generated with IMCompressTM. The tolerance level is 1 mm and results in 90 000 polygons (see Figure 7).
Figure 5. Top view of ODS obtained from 24 images combined using IMAlignTM
.
Figure 6. Top view of the ODS with 406 000 polygons, shown with synthetic shading.
Figure 7. Compressed model with 90 000 polygons made by IMCompressTM
, shown in wiremesh (resolution 1 mm).
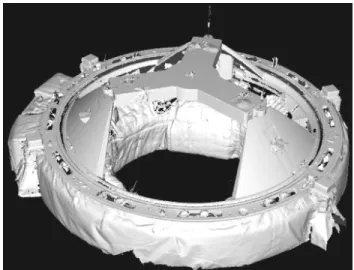
The second model is a representation of the entire ODS. It was generated with the merging of 72 views. This model is much coarser than the previous one and is composed of 516 000 polygons with a step size of 10 mm (see Figure 8). The compressed version is also computed with a tolerance level of 10 mm and yields 52 000 polygons (see Figure 9).
Figure 8. Model of ODS with 516 000 polygons, shown with synthetic shading.
Figure 9. Compressed model of the ODS with 52 000 polygons shown in wiremesh.
Although the number of views may appear high, the complexity of the ODS and its supporting structure is such that there are still some gaps remaining. These gaps correspond to holes in the models of Figure 8 and Figure 9. These holes could be filled by re-scanning these areas or by closing the surfaces with artificial polygons. The program IMEditTM can be used to touch up the polygons, remove undesired ones or create new ones. Also, the models can be ported to a CAD software using, for example, the DXF data format.
4. Discussion of the laser survey
4.
1. General observations
The first observation applies to the image resolution used either for features extraction or for creating the ODS models. The authors found, as expected, that the extraction of the location of the targets gave better results when the full resolution (same as the acquisition resolution) was used. For the determination of the transformation matrices from the image registration task, a lower image resolution (through re-interpolation of original images to a coarser pitch, e.g., ÷2 or ÷4) gave results that were as good as those obtained with the full resolution of the range camera. This observation facilitates the manipulation of the multi-resolution models with current workstations.
The second observation originates from the experiments pertaining to fitting geometric primitives to surfaces located on the top portion of the ODS. It was noticed that when planar surfaces were fitted on some
areas, the fitting error perpendicular to the planar surface gave precision that were better than the precision predicted and estimated from the calibration (Section 2.2). For example, the data displayed in Table 3 were obtained after fitting planar surfaces on all pertinent images (Figure 10 being an example) and averaging the results.
Table 3. Fitting error on planar surface as a function of distance to LRC.
Distance Plane-LRC (mm) Fitting Error: 1σ (mm)
900 0.071
950 0.071
1150 0.100
4.
2. LRC versus theodolite survey
During the laser survey, a procedure that is totally different from what is currently being used with a network of theodolites was tested. In the current setup, the network of theodolites is required to measure the location of the center of the ODS. The technique makes use of 3 cylindrical pegs mounted on a Y-shaped bracket positioned on top of the ODS. The pegs are modified such that 2 small targets per peg can be engraved on the planar surface created by two cut-outs removed from the center towards the outside of a peg. Extraction of those 6 targets provide the center and the axis of the ODS.
With a LRC, it makes sense to use structural information to infer positional and orientation information when surveying an object with so many geometrical features. For example, the pegs are cylindrically shaped objects and hence a cylinder can be fitted to the data. Unfortunately, due to their small size, only 6 lines of data could be acquired on their surface. But after inspection of Figure 10, one can envision a procedure where a cylinder is fitted in the bottom portion of the peg mounted on the Y-shaped plate. Then, the intersection of the axis of the cylinder with the planar surface located on top of it gives the location of the peg (assuming that the peg and the cylindrical portion of the plate are concentric). In order to establish a comparison with theodolite measurements, one could extrapolate the data to the theodolite targets mounted on the pegs with the ODS CAD drawings. The authors believe that this is not necessary because the three intersection points computed with this procedure are sufficient to determine the ODS axis and the location of its center. This procedure can be extended to other parts of the ODS. Figure 10 shows the original data (with synthetic shading) of the alignment Y-shaped plate with one of the three pegs. The two theodolite targets are not visible from this range camera view point.
Figure 10. Synthetically shaded range image showing the alignment Y-shaped plate and one of the 3 pegs.
Figure 11. Orthographic views of a) PPCT [peg] #3 and b) PPCT [peg] #2 displayed as a cloud of points. The lack of parallelism between the Theodolite target supports is evident in the lower left image (≈10°).
Another benefit of a LRC survey, can be found in the fact that with all the surface information available, it is possible to verify any defects that would otherwise go unnoticed with a theodolite survey. The following case
should exemplify this fact. As seen on Figure 11a, the planar surfaces supporting the theodolite targets on PPCT (peg) #3 are not parallel (≈10°). As clearly demonstrated on Figure 11b, they are parallel on PPCT (peg) #2.
5. Conclusion
In this paper, the accuracy of a prototype laser range camera (LRC) built at the National Research Council of Canada (NRC) was demonstrated for the creation of models of objects for virtual environments and for accurate dimensional measurements. The laser survey of the Orbiter Docking System (ODS) located at the Kennedy Space Center, Florida was selected as a good test case to demonstrate the calibration and the image registration process. Targets mounted on the top portion of the ODS were used to assess the accuracy. These targets were measured with a network of theodolites a day prior to the laser survey and used as a reference. With the current calibration and range image registration techniques, accuracy’s better than 0.25 mm in X and Y, and, 0.80 mm in Z were achieved (in the LRC rectangular coordinate system). These results compare favorably with the single point accuracy obtained after calibration, i.e., about 0.25 mm in X and Y, and, 0.50 mm in Z. The ODS has a diameter of 1.6 m and a height of 3.9 m. Hence, it confirms the high level of accuracy possible with the LRC calibration procedure and image merging process used for the creation of models.
The laser survey was also required to create a model of the ODS with the most complete dimensional description possible. In order to achieve these tasks, multiple scans were performed at various locations accessible all around the ODS. Adjacent views with sufficient overlap for registration were merged together. This task enhances the real strength of the laser survey with the creation of multiple resolution models from surface measurements. Two models (top of ODS and complete ODS) were constructed at different resolution levels (2 mm, 4 mm and 10 mm). The transformation matrices computed during the merging of the different views permitted very accurate (X,Y,Z) localization of the targets as reported earlier.
It was observed that the point density (spatial sampling) of each image used to create the model was high and could have been reduced without compromising the process. This would have decreased the size and the acquisition time for each image. With a reduction of the acquisition time, more images taken at many more points of view would have increased the coverage of the ODS and would have allowed the creation of a complete model. A preferred way of scanning an object as complex as the ODS is to integrate the images and create the model as images are being acquired. Then, it would be easier to
scan the surfaces for which there are no data and fill all the gaps on the model. This might increase slightly the time required to scan the object, but the model would be more complete.
A new procedure is proposed for dimensional measurements on the ODS or on similar space objects. It is based on the fact that for a LRC, it makes more sense to use structural information to infer positional and orientation information when surveying an object with so many geometrical features.
6. Acknowledgments
Jacques Domey, Pierre Boulanger, Gerhard Roth and, Marc Soucy made many contributions through the discussions the authors had with them. We would like to thank the Canadian Space Agency for the financial support and NASA for their logistical support throughout this work. We are indebted to Roger Serafini from Neptec Design Group Ltd. for his much appreciated help during the course of the planning and the survey of the ODS.
7. References
[1] S.F.El-Hakim, J.-A. Beraldin, G. Godin, and P. Boulanger, "Two 3-d sensors for environment modeling and virtual reality: calibration and multi-view registration ", Proc. Int. Arch. Of Photogram. and Remote Sensing, Vol. XXXI, Part B5, 140-146, Vienna, July , 1996.
[2] W. Malz, ,"Free-flying 3-D sensors for efficient close-range measurement and reverse engineering", Proc. Int. Arch. Of Photogram. and Remote Sensing, Vol. XXXI, Part B5, 336-346, Vienna, July, 1996.
[3] J.Paakkari and I. Moring, "Method for evaluating the performance of range imaging devices", Proc. Industrial Applications of Optical Inspection, Metrology, and Sensing, SPIE-1821, 350-356, 1992.
[4] S.F.El-Hakim, J.-A. Beraldin, and F. Blais, "A Com-parative Evaluation of Passive and Active 3-D Vision Systems", Proc. Dig. Photogram., St-Petersburg, June 25-30, 1995.
[5] P.Boulanger, "Reverse Engineering of Complex Surfaces based on a New Hierarchical Segmentation Method," Videometrics II, SPIE-2067, 186-197, 1993.
[6] F.Blais, M. Lecavalier, J. Domey, P. Boulanger, and J. Courteau, "Application of the BIRIS Range Sensor for Wood Volume Measurement," NRC-ERB-1038, October, 92.
[7] M.Rioux , "Laser Range Finder based on Synchronized Scanners,'' Appl. Opt., 23, 3837-3844, 1984.
[8] J-A. Beraldin, S.F. El-Hakim, and L. Cournoyer, "Practical Range Camera Calibration", Videometrics II, SPIE-2067, 21-31, 1993.
[9] S.F.El-Hakim and J.-A. Beraldin, "On the Integration of Range and Intensity Data to Improve Vision-based Three-dimensional Measurements", Videometrics III, Proc. SPIE 2350, 306-321, 1994.
[10] American National Standard for Automated Vision Systems - Performance Test - Measurement of Relative Position of Target Features in Two-Dimensional Space. ANSI/AVA A15.05/1 - 1989.
[11] M.Soucy and D. Laurendeau, “A General Surface Approach to the Integration of a Set of Range Views”, PAMI(17), No. 4, April 1995, pp. 344-358.
[12] Software: POLYWORKSTM from InnovMetric Software Inc, 2065 Charest Ouest, Suite 218, Ste-Foy, Quebec, G1N 2G1, ; IMCompressTM: Polygon Reduction Software; IMViewTM: a 3-D Viewer; and IMEditTM: Polygon Editing