HAL Id: hal-01648426
https://hal.archives-ouvertes.fr/hal-01648426
Submitted on 26 Nov 2017HAL is a multi-disciplinary open access archive for the deposit and dissemination of sci-entific research documents, whether they are pub-lished or not. The documents may come from teaching and research institutions in France or abroad, or from public or private research centers.
L’archive ouverte pluridisciplinaire HAL, est destinée au dépôt et à la diffusion de documents scientifiques de niveau recherche, publiés ou non, émanant des établissements d’enseignement et de recherche français ou étrangers, des laboratoires publics ou privés.
Probabilistic analysis of chloride penetration in
reinforced concrete subjected to pre-exposure static and
fatigue loading and wetting-drying cycles
Xiao-Hui Wang, Emilio Bastidas-Arteaga, Yang Gao
To cite this version:
Xiao-Hui Wang, Emilio Bastidas-Arteaga, Yang Gao. Probabilistic analysis of chloride penetration in reinforced concrete subjected to pre-exposure static and fatigue loading and wetting-drying cycles. Engineering Failure Analysis, Elsevier, 2017, �10.1016/j.engfailanal.2017.11.008�. �hal-01648426�
Please cite this paper as: Wang XH, Bastidas-Arteaga E. Gao Y. (2017). Probabilistic analysis of chloride penetration in reinforced concrete subjected to pre-exposure static and fatigue loading and wetting-drying cycles.
Engineering Failure Analysis. In press https://doi.org/10.1016/j.engfailanal.2017.11.008
Probabilistic analysis of chloride penetration in reinforced concrete subjected
to pre-exposure static and fatigue loading and wetting-drying cycles
Xiao-Hui Wang∗1, 2 Emilio Bastidas-Arteaga 3 Yang Gao4
1 Institute for Infrastructure & Environment, Heriot-Watt University, Edinburgh, UK
2 College of Ocean Science and Engineering, Shanghai Maritime University, Shanghai 201306, China 3UBL, University of Nantes, Institute for Research in Civil and Mechanical Engineering/Sea and Littoral Research
Institute, CNRS UMR 6183/FR 3473, Nantes, France
4 Shanghai Municipal Engineering Design Institute (Group) Co., LTD, Shanghai 200092, China
Abstract
Reinforced concrete (RC) structures are subjected to environmental actions and loading that could significantly affect their serviceability and safety. Among these actions these paper focuses on the interaction between concrete cracking produced by static and fatigue loading and chloride ingress. Given the complexity of the problem and its related uncertainties, we carried out an experimental study that provided information for the probabilistic characterization of chloride ingress model parameters by accounting for static and fatigue loading effects. In the experimental part of the study RC specimens (beams) were subjected to pre-exposure loading and wetting-drying chloride exposure. At the end of the simulated chloride environmental attack, ϕ100×120-mm cylinders were drilled out from the bottom side of the central zone of the beams and used to measure chloride profiles within the concrete cover. The probabilistic analysis of test results showed that static and fatigue loading increases both the mean and standard deviation of chloride content for concrete depths larger than 15 mm. In order to evaluate the effect of loading on modeling chloride ingress processes, experimental data was used to fit the surface chloride concentration and the chloride diffusion coefficient for an analytical chloride ingress model as random variables. The identified random variables are then used to determine the distribution of the time to corrosion initiation for the present experimental configuration and to evaluate the long-term probability of corrosion initiation for other environmental exposures and cover configurations. The overall results confirm that considering pre-exposure loading conditions has an important effect in lifetime assessment. This effect depends on the aggressiveness of the surrounding environment.
Keywords: pre-exposure loads and wetting/drying cycle; reliability; chloride-induced corrosion;
random variable identification; reinforced concrete
1. Introduction
One of the main causes of reinforced concrete (RC) deterioration is the corrosion of the reinforcing bars due to chloride ingress from the surrounding environment [1]. Chloride-induced corrosion leads to loss of cross-section of reinforcing bars, loss of bond between steel and concrete [2, 3] and concrete cracking [4, 5]. These deterioration effects produce a significant reduction of structural lifetime, increase maintenance costs and compromise structural serviceability and safety
[1, 6]. Consequently, in the past decades, both experimental and analytical works were devoted to study the chloride penetration into sound, uncracked concrete. However, in reality most RC structures are subjected to static and fatigue solicitations [6-8] that generate concrete cracks significantly affecting the transport processes of chloride ions into concrete.
Experimental research works dealing with chloride ion penetration in cracked concrete considered realistic (destructive) or artificial (non-destructive) techniques for generating cracks. Several methods were used to produce realistic cracks in concrete specimens: (1) splitting tensile test [9-11]; (2) modified wedge splitting test [12]; (3) three-point loading tests [13-14] and four-point loading tests [15-16]; (4) mechanical expansive core [18]; (5) compressive loading [19-20] and (6) other methods, such as rapid freeze/thaw exposure [21], central tensile test [22] and two-beam stressed back to back [23]. While for artificial cracks, single and double smooth crack samples were produced by saw, cutting concrete cylinders longitudinally into two (or three for double crack samples) equal width parts. The cracks were created by clamping the cut cylinder parts back together and using brass shims of various thicknesses at the edges to keep the gap open [24]. Artificial cracks in concrete specimens were also made by means of the positioning and removal after approximately 4 h of thin copper sheets inside the specimen at a depth in the concrete of 5 mm, 10 mm, 15 mm or 20 mm, where the copper sheets had a thickness of 0.2 mm, 0.3 mm or 0.5 mm [25]. Although the above-mentioned research works highlighted the importance of considering cracks as a major influencing factor for chloride ingress processes, most of the tests were realized in concrete specimens without reinforcing bars [9-11, 18-21, 24-25]. On the other hand, field surveys have reported the significant influence of the chloride penetration in cracked concrete on the corrosion initiation time of the reinforcing bars. For example, a field survey of 57 bridges in Kansas, USA, has indicated that the chloride concentration at a depth of 76 mm from the location of a surface crack can exceed the corrosion threshold of conventional reinforcement within the first year [26]. Another survey of 219 marine structures along the Norwegian coastline has shown that the signs of corrosion could be seen as early as 5-10 years [27]. This early time for corrosion initiation greatly influence the whole lifetime assessment of the RC structures.
Experimental results in cracked concrete are very useful for modeling and lifetime purposes. For example, Djerbi et al [10] and Jang et al [11] identified functions and factors to account for the effects of concrete cracking on the chloride diffusion coefficient. Such functions and factors could be introduced in chloride ingress models to estimate the time to corrosion initiation by considering cracking effects. To simulate the chloride ingress into concrete porous, Fick’s diffusion law [28] has been widely used and considered as an acceptable approach with more or less complex analytical [29-34] and numerical solutions [35-36]. However, the penetration of chlorides in concrete is controlled by complex interactions among physical and chemical mechanisms, which are inherent at this problem and related to large number of uncertainties; consequently, it can only be accurately analyzed considering probabilistic approaches [7-8, 30-31; 33, 35; 37-39]. These uncertainties are mainly related to material properties and exposure conditions [6, 30, 33-35]. They are also influenced by temporal and spatial variability of associated deterioration processes [40-42].
The main objective of this paper is to study the chloride ingress process in cracked RC specimens, where the cracks in RC beams were generated by three-point static and fatigue loading tests. Taking into account that the problem is subjected to larger uncertainties related to material properties, exposure and loading, several concrete samples were considered for unloaded, static and fatigue loading conditions to determine probability distributions for model parameters in each case. The paper is organized as follows: section 2 details the experimental setup used to obtain the experimental data reported in section 3. Section 4 discusses the main results about the influence of
pre-exposure loading on chloride penetration including the identification of random variables for the considered loading conditions and the effects on lifetime assessment.
2. Experimental procedure and methods
In the present paper, we prepared 300×120×1500 (mm) RC test specimens (Fig.1) [43-44]. After 28-day curing, test specimens were subjected to pre-exposure in-service static (one-time 18kN load) and fatigue loads (500,000 cycles and 5.4 to 18kN), respectively. After loading tests, the unloaded and loaded test specimens were repeatedly fully immersed in 3.5%~5% NaCl solution and air-dried; these wetting/drying cycles continued for 388 days. Once simulated chloride environmental attacks finished, ϕ100×120mm cylinders were drilled out in the central 300 mm length of bottom surface of test specimens. Then, the part of the cylinder corresponding to the bottom concrete cover was cut into 10 mm slices. Those slices were dried in oven and each was ground to powder to make a complete mixing. And then, the powder was used to measure the total chloride content of concrete at several depths.
2.1 Specimen details and materials
All test specimens (RC beams) were designed with a rectangular cross section (Fig.1) [43-44] reinforced by three 12 mm diameter deformed bars (flexural reinforcements) and 8 mm diameter smooth bars (distribution reinforcements). Reinforcing bars were bought from OSD Company in Jiangsu Province, China. The clear concrete cover of the tensile bars, ct, is designed as 40 mm, see
Fig.1b [45].
Three groups of test specimens were considered in the experimental tests (see Table 1), where test specimens were identified with letters and numbers designation. Each group was defined depending on the loading condition.
Commercial concrete from the same batch was used to cast all the test specimens. The concrete had a target strength of 40 at 28 days. The concrete mixture contained Portland cement PII 52.5 with micro furnace slag as cementitious materials with a water-cement ratio of 0.44. Additional details of the concrete mixture are provided in Table 2. The mean compressive strength of 150×150×150mm concrete cube at 28 days determined according to GB/T 50081-2016 [46] was 50 MPa.
2.2 Induction of cracks by loading test
Once 28 day curing finished, test specimens in Groups 2 and 3 were prepared for static and fatigue loading tests. The test specimen was placed in the test set-up with both ends simply supported and a single, mid-span load point. A 100 kN pulse fatigue testing machine was used in the static and fatigue loading tests. Displacements at mid-span and the two pivots of the supports of each test specimen were measured by displacement transducers. A load cell was used to control and record the magnitudes of static and fatigue loads [43]. Fatigue loading test details for test specimens in Group 3 are found in [47].
After finishing the loading test, the test specimen was moved from the test setup and turned upside down; location of reinforcing bars 1 and 3 on bottom surface was determined according to Fig.1b, where the depth of lateral concrete cover is 60 mm. The design bottom concrete cover was 40 mm which is within the range of measured values reported in Table 1. Maximum crack width and crack spacing of the bottom surface of each specimen were measured and recorded.
2.3 Chloride exposure conditions
The test specimens in Groups 1 to 3 (Table 1) were subjected to simulated seawater attacks after loading tests. They were turned upside down, horizontally placed and covered by wet sponges on the bottom surfaces for two weeks. Sponges were wetted by 3.5%~ 5% NaCl solution to simulate the situation where RC elements are exposed to natural marine environments or deicing salts. Two weeks later, the plastic sheets and sponges were moved away to make the specimens air-dried for one week. Thus three weeks constituted one cycle of wetting and drying [43].
The test specimens were fully immersed in a pool filled with a 3.5%~ 5% NaCl rich solution to accelerate chloride ingress after four wetting-drying cycles. Test specimens were subjected to one-month fully immersion period followed by one-month air-drying period. A total of three fully immersion-drying cycles were performed in the pool and the whole simulated chloride environmental exposure was 388 days [44].
2.4 Location of samples in RC test specimens
After 388 days of exposure, four concrete cores (ϕ100×120mm) were extracted from the bottom central part of the beams (see Fig.1a). Figs. 2 to 4 present the positions of concrete cores for Groups 1, 2 and 3, respectively. As expected, for test specimens in Group 1, there were no cracks in central 300mm length of bottom surface of test specimen (Fig. 2). On the contrary, various concrete cracks were observed for each test specimen in Groups 2 and 3 (Figs. 3-4). The location of drilled-cylinder for each specimen was identified with numbers, where the first number denotes the location of the reinforcing bar 1 or 3 on the bottom surface (Fig. 1b) while the second number just describes the different positions along the bars (1 or 2). A total of 12 concrete cores were therefore extracted for each group.
2.5 Samples preparation for measuring chloride content in concrete
Once extracted, concrete cores were transported to the laboratory of Shanghai Research Institute of Building Science CO., LTD for measuring chloride content in concrete. Since the design bottom concrete cover of the test specimen is ct = 40 mm (Fig.1b), from the outmost layer of
concrete cover to the surface of tensile bar, four slices with the same depth were cut. Considering the 1 mm thickness of saw blade, the actual thickness of each slice is about 9 mm. Then, those slices were dried in an oven. Afterwards, each slice was ground to powder and 1.5 g fully-mixed powder was used to determine the total chloride content in each slice after an acid extraction procedure in accordance with the standard JTJ 270-98 [48].
3. Test Results 3.1 Concrete cover
The average clear concrete cover is summarized in Table 1. The maximum dimension error of actual average clear concrete cover in tensile zone is 1mm, indicating a comparatively accurate dimension control.
3.2 Test results of loaded test specimens
The test results of loaded test specimens in Group 2 are shown in Table 3, including actual maximum static load, maximum mid-span deflection at maximum load and residual mid-span deflection at zero load, maximum crack width and crack spacing of the bottom surface after unloading. It can be seen from Table 3, that difference in maximum crack widths at the bottom surfaces of the three test specimens is very small.
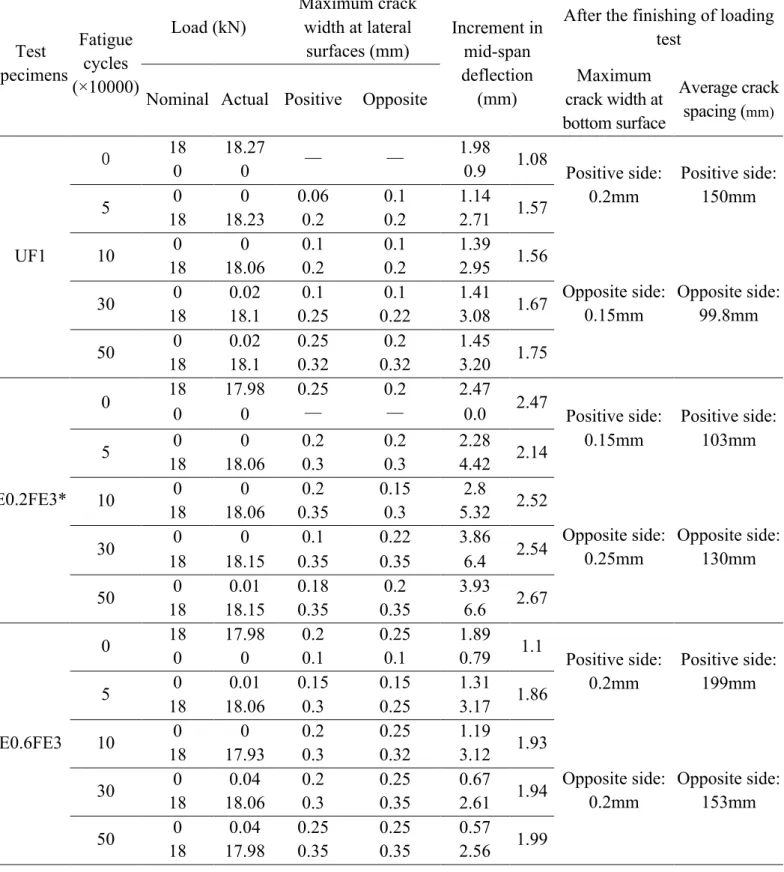
The test results of loaded test specimens in Group 3 are shown in Table 4. Maximum actual load, maximum crack width at two lateral surfaces and the increment in mid-span deflection are presented for 0, 50,000, 100,000, 300,000 and 500,000 loading cycles. Maximum crack width and crack spacing of the bottom surface after unloading are also shown. It can be seen that, with the increase of the repetition of loading cycles, increased maximum crack widths in two lateral surfaces and increment in mid-span deflection are presented. Among the three test specimens, the largest increment in mid -span deflections at each load stopping is shown in specimen E0.2FE3. This indicates more load -induced concrete damage in this specimen. Once the fatigue loading test finished, the maximum crack width varied between 0.15 and 0.25 mm which are large values in comparison with crack widths measured for Group 2. The average crack spacing range remained similar for both groups.
3.3 Penetration of chloride into the bottom concrete cover of test specimens
Test results of the measurements of the chloride content in the concrete cover are presented in Figs. 5-7. Actual clear concrete cover of each cylinder was designed to cut into four nominal10 mm thick slices and, it is assumed that the chloride content obtained for each slice corresponds to the depth from the surface to the midpoint of the slice, i.e., the measured chloride contents correspond to the depths of 5, 15, 25 and 35 mm.
3.3.1 Penetration of chloride into the bottom concrete cover of test specimens in Group 1
The total chloride content in concrete weight (%) in relation to concrete cover depth in test specimens of Group 1 is shown in Fig. 5. In most cases, the chloride content gradually decreases with the concrete cover depth except for cylinders 11/U1 and 32/E0.2E2. This can be explained by the possible existence of a convection zone in the first centimeter due to alternate immersion and wetting cycles.
For test specimens of Group 1, similar chloride profiles are found for specimens E0.2E2 and E0.6E2. However, near the reinforcing bar surface (35 mm depth), the average total chloride contents in concrete for specimens E0.2E2 and E0.6E2 are lower than those for specimen U1. The chloride content at the level of reinforcement in the specimen U1 varies between 0.027% and 0.093% by the weight of concrete. Signs of corrosion were observed in both bars at the end of the test. The chloride contents in the U1 are also lower near the concrete surface indicating that the chloride diffusion in the U1 was higher than that in specimens E0.2E2 and E0.6E2. Since no cracks were observed in those three specimens (see Fig. 2), the differences may be related to concrete compaction resulting from different vibration times for each test specimen and/or to the natural variability of concrete.
3.3.2 Penetration of chloride into the bottom concrete cover of test specimens in Group 2
The total chloride content in weight of concrete (%) in relation to concrete cover depth in test specimens of Group 2 is shown in Fig. 6. Similarly to Group 1, the chloride ion concentration decreased gradually with concrete cover depth, except of cylinder 31/UD1 at the 5-mm depth. A possible reason for that behavior has been explained previously.
Compared with the microstructure of concrete in unloaded test specimens, the external loading may induce increased microcracking density in the concrete [22], indicating the effect of external loading on chloride penetration into concrete. For test specimens of Group 2, it is observed that the average chloride content at depths larger than 15 mm is larger than the average values obtained for Group 1.
3.3.3 Penetration of chloride into the bottom concrete cover of test specimens in Group 3
The total chloride content in weight of concrete (%) in relation to concrete cover depth in test specimens of Group 3 is shown in Fig. 7. The average chloride profile indicated that the chloride ion concentration also decreased with concrete cover depth.
The specimens in this group were subjected to pre-exposure fatigue loading that induced damage to the concrete in the form of visible and invisible cracks but much more numerous micro-cracks. This led to an increase in the concrete diffusivity and an increase in the chloride content at the level of reinforcement in comparison with Groups 1 and 2. Signs of corrosion were also observed in bars of 12/E0.2FE3 at the end of the test.
3.4 Analysis and discussion
The mean and standard deviation of chloride profiles for each group are presented and compared in Fig. 8. It is observed that static and fatigue loading increases both the mean and standard deviation for concrete depths larger than 15 mm. For example, the mean 35 mm chloride concentration depth increases from 0.036% (Group 1) up to 0.06% and 0.085% for Groups 2 and 3, respectively. It was also noted that there is a large scatter on the profiles shown in Figs. 6-7 in comparison to those of Fig. 5 by increasing the standard deviation when the specimens are loaded (Fig. 8b). These higher standard deviations are related to the complex chloride ingress process in a cracked concrete that is influenced by of both fatigue load-induced micro-cracks and visible cracks.
The effect of loading on the chloride ingress process can be also evaluated by studying the cumulated probability of chloride content at given depths (Fig. 9). By comparing cumulative probabilities of chloride concentrations at 25 and 35 mm depth for the same loading group, it is generally observed that larger chloride contents are found at 35 mm for a fixed cumulative probability. A distribution fitting was performed for each group and depth. The values were fitted to a lognormal distribution because it provided best maximum likelihood estimate. It is observed in Fig. 9 that the best fitting for both depths correspond to the unloaded conditions (Group 1). By comparing the results between the considered groups for a fixed depth, it is confirmed that for a given cumulative probability, the loading process increases the chloride concentration. For example, by considering the fitted distributions and for a probability of 0.5, static and fatigue load increase respectively chloride content, with respect to the unloaded conditions, by 1.4 and 1.6 times at 25 mm depth and by 1.8 and 2.5 times at 35 mm depth. These larger chloride contents will increase corrosion initiation risks as will be studied in the following section.
4. Effects of loading conditions on the structural lifetime
The objective of this section is to evaluate the effect of loading on modeling chloride ingress processes. This section starts by characterizing the parameters for an analytical chloride ingress model as random variables (section 4.1). The identified random variables are then used to (i) determine the distribution of the time to corrosion initiation for the experimental configuration considered in previous sections, and (ii) evaluate the probability of corrosion initiation for other environmental exposures and cover configurations.
4.1 Chloride ingress model and identification of random variables
In saturated concrete, the Fick’s diffusion equation [28] is usually used to predict the unidirectional diffusion (in x-direction):
∂Cf c ∂t = D ∂2C fc ∂x2 (1)
where Cfc (kg/m3) is the concentration of chloride dissolved in pore solution, t (year) is the time and
D (m/s2) is the effective chloride diffusion coefficient. Assuming that concrete is a homogeneous and isotropic material with the following initial conditions (i) the chloride concentration is zero at time t = 0 and (ii) the chloride surface concentration is constant during the exposure time, the free chloride ion concentration C(x,t) at depth x after time t for a semi-infinite medium is:
( )
, 1 2 s x C x t C erf D t ⎡ ⎛ ⎞⎤ = ⎢ − ⎜ ⎟⎥ ⋅ ⎝ ⎠ ⎣ ⎦ (2)where Cs (kg/m3) is the chloride surface concentration and erf(.) is the error function.
Equation (2) remains valid when RC structures are saturated and subjected to constant concentration of chlorides on the exposure surfaces. In real structures, these conditions are rarely present because concrete is a heterogeneous material and the chloride concentration in the exposed surfaces could be time-variant. Besides, this solution does not consider chloride binding capacity, concrete aging and other environmental factors such as the influence of surrounding temperature and humidity in chloride ingress process [35-36, 39, 49]. Although this solution neglects some important physical phenomena, this model will be used herein to identify the random variables and evaluate the effects of loading on lifetime assessment because its complexity is sufficient to account for non-linear effects in x-direction and time. The methodology can be after extended to more realistic chloride ingress and concrete cracking models.
Experimental data is used to fit the surface chloride concentration and the chloride diffusion coefficient from equation (2). The results of the fitting are summarized in Table 5. For all parameters and cases, lognormal distributions provided the best maximum likelihood estimates. Consequently, lognormal distributions will be used to model Cs and D. Concerning Cs, the results
indicate that the mean and standard deviation are very close for all groups. This result is expected because all specimens were exposed to the same environmental chloride concentrations. On the contrary, it is noted that loading conditions increase the identified values for the mean and standard deviation of D with respect to the unloaded condition. Similarly, Konin et al [22] also pointed out that, chloride rate and content increase with concrete microcracking density. The following section will illustrate the effect of these larger diffusivities and related uncertainties on structural lifetime assessment.
4.2 Probabilistic assessment of loading conditions on the RC durability
The integration of the chloride ingress described by equation (2) into a suitable probabilistic framework allows to estimate the cumulative distribution function (CDF) of the time to corrosion initiation, Ft ini, as [34]:
( )
Pr{
}
( ) ini ini t ini t t F t t t f d ≤ = ≤ =∫
x x (3)where x is the vector of the random variables to be taken into account and f(x) is the joint probability density function of x. Failure is related herein to corrosion initiation and is reached when the chloride concentration at the cover depth, ct, reaches a critical value (Cth) depassivating
corrosion. In such a case the limit state function, g(x, t), becomes:
( )
, th( )
tc(
, ,t)
g x t =C x −C x c t (4)
probability, pf, represents, in this case, the probability of corrosion initiation and is obtained by
integrating the joint probability function over the failure domain:
( )
( , ) 0 ( ) f g t p t f d ≤ =∫
x x x (5)Monte Carlo simulations will be used in this study to estimate both the probability distribution function (PDF) of the time to corrosion initiation and the probability of failure. Section 4.2.1 will focus on the assessment of the PDF of tini for the data considered in the experimental study. Finally,
Section 4.2.2 will study the effect of several loading conditions on long-term probability of corrosion initiation.
4.2.1 PDF of the time to corrosion initiation
The objective of this section is to estimate the effects of the considered loading conditions on the PDF of the time to corrosion initiation. tini is estimated from equation (2) as the time at which a
threshold concentration of chlorides that induces corrosion reaches the cover depth: –2 2 –1 1 4 t th ini s c C t erf D C ⎡ ⎛ ⎞⎤ = ⎢ ⎜ − ⎟⎥ ⎝ ⎠ ⎣ ⎦ (6)
Three random variables are considered in this study: D, Cs and Cth. D, Cs are modeled as
lognormal random variables defined according to the experimental data (Table 5). Cth was modeled
as a uniform random variable [29]. Its mean was defined according to the recommendations of European Standards [50] as 0.4% cement weight. The coefficient of variation (COV) of Cth was
fixed at 19% according to [30, 37]. The concrete cover was modeled as a deterministic value (ct= 4
cm) because the variability of this parameter was very low according to Table 1.
After propagating uncertainties by using Monte Carlo simulations in equation (6), the simulated values of tini for the considered loading conditions are given in Fig. 10 in the form of
histograms. Fig. 10 also includes the fitting of the PDFs of tini to lognormal distributions.
Distribution fitting was carried out by using the Statistics Toolbox of Matlab® that estimates the distribution parameters using the maximum likelihood method. A detailed description of the maximum likelihood estimates method for the lognormal distribution can be found in [51].
It is noted in Fig. 10 that static and fatigue loading decrease mean of the time to corrosion µtini
by 1 and 1.5 years, respectively. The standard deviation also decreases; then the coefficient of variation was reduced from 61% (Group 1) to approximately 50% (Groups 2 and 3). The early mean corrosion initiation times reported in Fig. 10 are explained by the fact that the surface chloride concentration (Table 5) is very high and corresponds to an extreme exposure case [7]. In addition, even if the chloride ingress model is an approximation of the real process and experimental data was not used to characterize Cth, the experimental observations of section 3.3 indicated that
corrosion initiation took place for one case after 388 days. Since this section focused on a case where Cs was very large, next section will consider other environmental exposures to illustrate the
potential effect of loading conditions on long-term RC durability.
4.2.2 Probability of Corrosion Initiation
The aim of this section is to use the experimental results and the chloride penetration model to estimate the effects of loading conditions on probability of corrosion initiation for two environmental conditions (Table 6). Exposure conditions were defined according to [7] and modeled by considering different values for the random variable Cs. According to McGee [38], Cs
will follow a lognormal distribution whose mean and COV increase with the proximity to the seashore. For each exposure a different mean value of concrete cover was defined according to European Standards [50]. As expected, the mean value of ct increases for the more aggressive
environments. According to Val and Stewart [31], ct will be represented by a normal distribution
truncated at 10 mm.
Fig. 11 presents the probabilities of corrosion initiation for all considered cases. As expected,
pf increases with time due to the accumulation of chlorides in the surrounding area of the rebar
during the exposure time. The increase of the probability of corrosion initiation is mainly driven by the exposure conditions. For example after 20 years and for the unloaded case (Group 1), the probabilities of corrosion initiation are 0.07 and 0.51 for the moderate and high exposure scenarios, respectively. The effect of loading conditions depends therefore on the exposure.
For moderate exposure conditions, the effects of loading are almost negligible because Cs is
small and an increase of D (as a consequence of loaded-induced concrete cracking) has a lower influence on the corrosion initiation time predicted by equation (6) (Fig. 11). However, these results could be different if Cth considers the effects of concrete cracking that increase oxygen and water
availability at the corrosion cell. The effect of loading is more important for high exposure conditions. For example, the times to reach a fixed probability of corrosion initiation (e.g., pf =0.5)
are 19.2, 12.8 and 10.3 for Groups 1, 2 and 3, respectively. This implies a lifetime reduction with respect to the case of unloaded condition (Group 1) of 6.4 and 8.9 years for Groups 2 and 3, respectively. This increase in corrosion initiation risks will imply additional maintenance costs when structures are subjected to static and fatigue loads. On the basis on these results it is possible to conclude that the combined effects of loading conditions and chloride ingress depend on the type of mechanical solicitation and environmental exposure. Further studies will focus on the improvement and/or development of deterioration models more representative of the considered deterioration processes.
5. Conclusions
The main findings of this study are summarized as follows:
1) The differences in total chloride contents in various samples may result from the original differences in concrete compaction and/or related to the natural variability of concrete for unloaded test specimens in Group 1. For loaded test specimens in Groups 2 and 3, the load-induced microcracking density and visible cracks added more variability to the chloride profiles, especially for test specimens subjected to pre-exposure fatigue loading.
2) The comparison of the mean and standard deviation of chloride profiles for each group showed that static and fatigue loading increase both the mean and standard deviation of chloride content for concrete depths larger than 15 mm.
3) The analysis of the cumulative probabilities of chloride concentrations confirmed that for a given cumulative probability at a fixed depth, the loading process increased the chloride concentration; 4) The fitting of the chloride diffusion coefficient from experimental data showed that loading
conditions increased the identified values for the mean and standard deviation of this parameter with respect to the unloaded condition.
5) The probabilistic assessment of the time to corrosion initiation for the experimental configuration indicated that static and fatigue loading decrease mean of the time to corrosion by 1 and 1.5 years, respectively. Loading also decreased the coefficient of variation from 61% (unloaded case) to approximately (50%).
conditions showed that the effects of loading were almost negligible for moderate exposure conditions while it is more important for high exposure conditions.
Acknowledgments
The authors gratefully acknowledge the support provided by the National Natural Science Foundation of China (No. 51178266).
References
[1] E. Bastidas-Arteaga, F. Schoefs, Sustainable maintenance and repair of RC coastal structures, Proc. Inst. Civ Eng. – Marit. Eng. 168(4) (2015) 162-173.
[2] L. Wang, X. Zhang, J. Zhang, L. Dai, Y. Liu, Failure analysis of corroded PC beams under flexural load considering bond degradation, Eng. Fail. Anal. 73 (2017) 11-24.
[3] L. Wang, X. Zhang, J. Zhang, J. Yi, Y. Liu, Simplified model for corrosion-induced bond degradation between steel strand and concrete, J. Mater. Civ. Eng. 29 (2017) 4016257-1-11. [4] X. Du, L. Jin, Meso-scale numerical investigation on cracking of cover concrete induced by
corrosion of reinforcing steel, Eng. Fail. Anal. 39 (2014) 21-33.
[5] L. Dai, L. Wang, J. Zhang, X. Zhang, A global model for corrosion-induced cracking in prestressed concrete structures, Eng. Fail. Anal. 62 (2016) 263-275.
[6] L. Saad, A. Aissani, A. Chateauneuf, W. Raphael, Reliability-based optimization of direct and indirect LCC of RC bridge elements under coupled fatigue-corrosion deterioration processes, Eng. Fail. Anal. 59 (2016) 570-587.
[7] E. Bastidas-Arteaga, P. Bressolette, A. Chateauneuf, M. Sánchez-Silva, Probabilistic lifetime assessment of RC structures under coupled corrosion–fatigue deterioration processes,Struct. Saf. 31(1) (2009) 84-96.
[8] E. Bastidas-Arteaga. Reliability of Reinforced Concrete Structures Subjected to Corrosion-Fatigue and Climate Change. International Journal of Concrete Structures and
Materials. Under review. 2017
[9] C.-M. Aldea, S. P. Shah, A. Karr, Effect of cracking on water and chloride permeability of concrete, J. Mater. Civ. Eng. 11(3) (1999) 181-187.
[10] A. Djerbi, S. Bonnet, A. Khelidj, V. Baroghel-bouny, Influence of traversing crack on chloride diffusion into concrete, Cem.Concr. Res. 38(6) (2008) 877-883.
[11] S. Y. Jang, B. S. Kim, B. H. Oh, Effect of crack width on chloride diffusion coefficients of concrete by steady-state migration tests, Cem.Concr. Res. 41(1) (2011) 9-19.
[12] B. Šavija, E. Schlangen, J. Pacheco, S. Millar, T. Eichler, G. Wilsch, Chloride ingress in cracked concrete: A laser induced breakdown spectroscopy (LIBS) study, J. Adv. Concr. Technol. 12(10) (2014) 425-442.
[13] N. Gowripalan, V. Sirivivatnanon, C.C. Lim, Chloride diffusivity of concrete cracked in flexure, Cem.Concr. Res. 30(5) (2000) 725-730.
[14] G. Li, F. Hu, Y. Wu, Chloride ion penetration in stressed concrete, J. Mater. Civ. Eng. 23(8) (2011) 1145-1153.
[15] E. Kato, Y. Kato, T. Uomoto, Development of simulation model of chloride ion transportation in cracked concrete, J. Adv. Concr. Technol. 3(1) (2005) 85-94.
[16] M. Şahmaran, Effect of flexure induced transverse crack and self-healing on chloride diffusivity of reinforced mortar, J. Mater. Sci. 42 (2007) 9131-9136.
[17] Y. Wang, C. Lin, Y. Cui, Experiments of chloride ingression in loaded concrete members under the marine environment, J. Mater. Civ. Eng. 26(6) (2014) 04014012 1-7.
[18] M. Ismail, A. Toumi, R. François, R. Gagné, Effect of crack opening on the local diffusion of chloride in inert materials, Cem.Concr. Res. 34(4) (2004) 711-716.
[19] M. Saito, H. Ishimori, Chloride permeability of concrete under static and repeated compressive loading, Cem.Concr. Res. 25(4) (1995) 803-808.
[20] C.C. Lim, N. Gowripalan, V. Sirivivatnanon, Microcracking and chloride permeability of concrete under uniaxial compression, Cem.Concr.Compos. 22(5) (2000) 353-360.
[21] S. Jacobsen, J. Marchand, L. Boisvert, Effect of cracking and healing on chloride transport in OPC concrete, Cem.Concr. Res. 26(6) (1996) 869-881.
[22] A. Konin, R. François, G. Arliguie, Penetration of chloride in relation to the microcracking state into reinforced ordinary and high strength concrete, Mater. Struct. 31 (1998) 310-316. [23] K. Z. Kahhaleh, E. Vaca-Cortés, J. O. Jirsa, H. G. Wheat, R. L. Carrasquillo, Corrosion
performance of epoxy-coated reinforcement–beam tests, Research Report No. 1265-4, Texas Department of Transportation, U.S.A., 1998.
[24] O. G. Rodriguez, R. D. Hooton, Influence of cracks on chloride ingress into concrete, ACI Mater. J. 100(2) (2003) 120-126.
[25] L. Marsavina, K. Audenaert, G. De Schutter, N. Faur, D. Marsavina, Experimental and numerical determination of the chloride penetration in cracked concrete, Constr. Build. Mater. 23(1) (2009) 264-274.
[26] W. D. Lindquist, D. Darwin, J. A. Browning, G. G. Miller, Effect of cracking on chloride content in concrete bridge decks, ACI Mater. J. 103 (2006) 467-473.
[27] O.E. Gjørv, Durability of reinforced concrete wharves in Norwegian harbours, Mater. Struct. 2(6) (1969) 467-476.
[28] K. Tuutti, Corrosion of steel in concrete. Swedish Cement and Concrete Research Institute, Stockholm, 1982.
[29] M. G. Stewart, D. V. Rosowsky, Time-dependent reliability of deteriorating reinforced concrete bridge decks, Struct. Saf. 20(1) (1998) 91-109.
[30] K. A. T. Vu, M. G. Stewart, Structural reliability of concrete bridges including improved chloride-induced corrosion, Struct. Saf. 22 (2000) 313-333.
[31] D. V. Val, M. G. Stewart, Life-cycle cost analysis of reinforced concrete structures in marine environments, Struct. Saf. 25 (2003) 343-362.
[32] M. Boulfiza, K. Sakai, N. Banthia, H. Yoshida, Prediction of chloride ions ingress in uncracked and cracked concrete, ACI Mater. J. 100 (1) (2003) 38-48.
[33] G. C. Nogueira, E. D. Leonel, Probabilistic models applied to safety assessment of reinforced concrete structures subjected to chloride ingress, Eng. Fail. Anal. 31 (2013) 76-89.
[34] E. A. P. Liberati, C. G. Nogueira, E. D. Leonel, A. Chateauneuf, Nonlinear formulation based on FEM, Mazars damage criterion and Fick’s law applied to failure assessment of reinforced concrete structures subjected to chloride ingress and reinforcements corrosion, Eng. Fail. Anal. 46 (2014) 247-268.
[35] E. Bastidas-Arteaga, A. Chateauneuf, M. Sánchez-Silva, P. Bressolette, F. Schoefs, A comprehensive probabilistic model of chloride ingress in unsaturated concrete, Eng. Struct. 33(3) (2011) 720-730.
[36] P.-T. Nguyen, E. Bastidas-Arteaga, O. Amiri, C.-P. El Soueidy, An efficient chloride ingress model for long-term lifetime assessment of reinforced concrete structures under realistic climate and exposure conditions, Int. J. Concr. Struct. Mater. 11(2) (2017) 199-213.
[37] DuraCrete, Statistical quantification of the variables in the limit state functions, DuraCrete - Probabilistic Performance based Durability Design of Concrete Structures, EU - Brite EuRam
III, Contract BRPR-CT95-0132, Project BE95-1347/R9, 2000.
[38] R. McGee, Modelling of durability performance of Tasmanian bridges; in R. E. Melchers & M. G. Stewart (Eds.), Applications of statistics and probability in civil engineering (pp. 297-306), Rotterdam: Balkema, 2000.
[39] E. Bastidas-Arteaga, M. G. Stewart, Damage risks and economic assessment of climate adaptation strategies for design of new concrete structures subject to chloride-induced corrosion, Struct. Saf. 52 (2015) 40-53.
[40] L. Peng, M. G.Stewart, Spatial time-dependent reliability analysis of corrosion damage to RC structures with climate change, Mag. Concr. Res. 66 (2014) 1154-1169.
[41] F. Schoefs, E. Bastidas-Arteaga, T. V. Tran, G. Villain, X. Derobert, Characterization of random fields from NDT measurements: A two stages procedure, Eng. Struct. 111(2016) 312-322.
[42] F. Schoefs, E. Bastidas-Arteaga, T. V. Tran, Optimal Embedded Sensor Placement for Spatial Variability Assessment of Stationary Random Fields. Eng. Struct. 17(2017) 35-44.
[43] X.-H. Wang, B. Chen, Y. Gao, J. Wang, L. Gao, Influence of external loading and loading type on corrosion behavior of RC beams with epoxy-coated reinforcements, Constr. Build. Mater. 93(15) (2015) 746-765.
[44] X.-H. Wang, Y. Gao, Corrosion behavior of epoxy-coated reinforced bars in RC test specimens subjected to pre-exposure loading and wetting-drying cycles, Constr. Build. Mater. 119 (2016) 185-205.
[45] GB50010-2010, Code for design of concrete structures, National Standards of Peoples Republic of China, Beijing, China, 2010.
[46] GB/T 50081-2016, “Standard for test method of mechanical properties on ordinary concrete”, National Standards of Peoples Republic of China
[47] X.-H. Wang, Y. Gao, R.-D. Gao, J. Wang, X.-L. Liu, Influence of different fatigue loads and coating thicknesses on service performance of RC beam specimens with epoxy-coated reinforcement, Comput. Concr. 19(3) (2017) 243-256.
[48] JTJ270-98, Testing code of Concrete for Port and Waterwog Engineering, Construction Industry Standard of the People's Republic of China, Beijing, China, 1998.
[49] E. Bastidas-Arteaga, M. G. Stewart, Economic assessment of climate adaptation strategies for existing RC structures subjected to chloride-induced corrosion, Struct. Infrastruct. Eng. 12(4) (2016) 432-449.
[50] Comité Européen de Normalisation (CEN), Concrete – part 1: specification, performance, production and conformity, Brussels: Comité Européen de Normalisation, EN 206-1:2000, 2000.
[51] B. F, Ginos. Parameter Estimation for the Lognormal Distribution. MSc Thesis. Department of Statistics Brigham, Young University 2009.
List of all Tables
Table 1 Description of groups, notation and cover
Groups and description Notation Average clear
concrete cover (mm) Group 1: subjected to simulated chloride
environmental attacks U1 E0.2E2 E0.6E2 40.5 40.5 41 Group 2: subjected to 18kN static load and
simulated chloride environmental attacks
UD1 E0.2DE4 E0.6DE3 40 41 40.5 Group 3: subjected to 500,000 cycles
fatigue load (5.4 to18kN) and simulated chloride environmental attacks
UF1 E0.2FE3* E0.6FE3 40 40 40
Note: * E0.2FE3 had a 60mm length crack in the opposite surface before loading, resulting from the transporting damage.
Table 2 Characteristics of the concrete mixture
Target strength C40 Slump 140±20mm
Mix Materials Water Cement Sand Aggregate Superplasticizer Admixture
proportion
Varieties and
specifications — PII 52.5 Medium 5-25 LN800
S95 (Furnace micro-slag ) Amount
(kg/m3) 180 320 770 1020 4.51 90.0
Table 3 Loading test results of test specimens in Group 2
Test specimen Actual maximum load (kN) Maximum mid-span deflection (mm) Residual mid-span deflection (mm) Maximum crack width after unloading(lateral surfaces)
After the finishing of loading test (bottom surface) Maximum crack width(mm) Average crack spacing (mm) Positive side Opposite side Positive side Opposite side UD1 18.36 3.02 1.54 0.05 0.04 0.04 98 107 E0.2DE4 18.15 2.07 0.83 0.15 0.04 0.04 134 99 E0.6DE3 18.27 2.06 0.90 0.10 0.04 0.06 140 118
Table 4 Loading test results of test specimens in Group 3 Test specimens Fatigue cycles (×10000) Load (kN) Maximum crack width at lateral surfaces (mm) Increment in mid-span deflection (mm)
After the finishing of loading test
Nominal Actual Positive Opposite
Maximum crack width at bottom surface Average crack spacing (mm) UF1 0 18 18.27 — — 1.98 1.08 Positive side: 0.2mm Opposite side: 0.15mm Positive side: 150mm Opposite side: 99.8mm 0 0 0.9 5 0 0 0.06 0.1 1.14 1.57 18 18.23 0.2 0.2 2.71 10 0 0 0.1 0.1 1.39 1.56 18 18.06 0.2 0.2 2.95 30 0 0.02 0.1 0.1 1.41 1.67 18 18.1 0.25 0.22 3.08 50 0 0.02 0.25 0.2 1.45 1.75 18 18.1 0.32 0.32 3.20 E0.2FE3* 0 18 17.98 0.25 0.2 2.47 2.47 Positive side: 0.15mm Opposite side: 0.25mm Positive side: 103mm Opposite side: 130mm 0 0 — — 0.0 5 0 0 0.2 0.2 2.28 2.14 18 18.06 0.3 0.3 4.42 10 0 0 0.2 0.15 2.8 2.52 18 18.06 0.35 0.3 5.32 30 0 0 0.1 0.22 3.86 2.54 18 18.15 0.35 0.35 6.4 50 0 0.01 0.18 0.2 3.93 2.67 18 18.15 0.35 0.35 6.6 E0.6FE3 0 18 17.98 0.2 0.25 1.89 1.1 Positive side: 0.2mm Opposite side: 0.2mm Positive side: 199mm Opposite side: 153mm 0 0 0.1 0.1 0.79 5 0 0.01 0.15 0.15 1.31 1.86 18 18.06 0.3 0.25 3.17 10 0 0 0.2 0.25 1.19 1.93 18 17.93 0.3 0.32 3.12 30 0 0.04 0.2 0.25 0.67 1.94 18 18.06 0.3 0.35 2.61 50 0 0.04 0.25 0.25 0.57 1.99 18 17.98 0.35 0.35 2.56
Note: * E0.2FE3 had a 60mm length crack in the opposite surface before loading, resulting from the transporting damage.
Table 5 Mean and standard deviation of chloride ingress models parameters for different loading
conditions Group
Mean of Cs Std. Dev. of Cs Mean of D Std. Dev. of D
(Total Cl– in conc. Weight %) (Total Cl– in conc. Weight %) (mm 2/day) (mm2/day) 1 (Unloaded) 0.28 0.05 0.94 0.52 2 (Static load) 0.27 0.06 1.31 0.60 3 (Fatigue load) 0.3 0.05 1.65 0.77
Table 6 Mean and COV of Cs and ct for various exposures
Exposure Mean of
Cs* COV of Cs
Mean of ct
(mm) COV of ct
Moderate: Structures located between 0.1
and 2.84 km from the coast without direct contact with seawater
0.0489
(1.15) 0.5 45 0.15
High: Structures situated to 0.1 km or less
from the coast, but without direct contact to seawater. RC structures subjected to de-icing salts can also be classified in this level
0.1255
(2.95) 0.5 50 0.15
List of all Figures
(a)
(b)
(a) Specimen U1
(b)Specimen E0.2E2
(c) Specimen E0.6E2
Fig.2 Position of cylinders on the bottom surface of test specimens in Group 1 and the drilled-out
(a)Specimen UD1
(b)Specimen E0.2DE4
(c)Specimen E0.6DE3
Fig.3 Position of cylinders on the bottom surface of test specimens in Group 2 and the drilled-out
(a)Specimen UF1
(b)Specimen E0.2FE3
(c)Specimen E0.6FE3
Fig.4 Position of cylinders on the bottom surface of test specimens in Group 3 and the drilled-out
Fig.5 Total chloride content profiles for specimens of Group 1
Fig.6 Total chloride content profiles for specimens of Group 2
0 0.05 0.1 0.15 0.2 0.25 0.3 0.35 0.4 0 10 20 30 40 To ta l C l-in c on cr et e w eig ht (% ) Depth (mm) Cyl. 11/U1 (no cracks) Cyl. 12/U1 (no cracks) Cyl. 31/U1 (no cracks) Cyl. 32/U1 (no cracks) Cyl. 11/E0.2E2 (no cracks) Cyl. 12/E0.2E2 (no cracks) Cyl. 31/E0.2E2 (no cracks) Cyl. 32/E0.2E2 (no cracks) Cyl. 11/E0.6E2 (no cracks) Cyl. 12/E0.6E2 (no cracks) Cyl. 31/E0.6E2 (no cracks) Cyl. 32/E0.6E2 (no cracks) 0 0.05 0.1 0.15 0.2 0.25 0.3 0.35 0.4 0 10 20 30 40 To ta l C l-in c on cr et e w eig ht (% ) Depth (mm) Cyl. 11/UD1 (one crack) Cyl. 12/UD1 (one crack) Cyl. 31/UD1 (one crack) Cyl. 32/UD1 (one crack) Cyl. 11/E0.2DE4 (one crack) Cyl. 12/E0.2DE4 (one crack) Cyl. 31/E0.2DE4 (one crack) Cyl. 32/E0.2DE4 (two cracks) Cyl. 11/E0.6DE3 (one crack) Cyl. 12/E0.6DE3 (one crack) Cyl. 31/E0.6DE3 (one crack) Cyl. 32/E0.6DE3 (one crack)
Fig.7 Total chloride content profiles for specimens of Group 3 0 0.05 0.1 0.15 0.2 0.25 0.3 0.35 0.4 0 10 20 30 40 To ta l C l-in c on cr et e w eig ht (% ) Depth (mm) Cyl. 11/UF1 (one crack) Cyl. 12/UF1 (one crack) Cyl. 31/UF1 (one crack) Cyl. 32/UF1 (no cracks) Cyl. 11/E0.2FE3 (one crack) Cyl. 12/E0.2FE3 (no cracks) Cyl. 31/E0.2FE3 (one crack) Cyl. 32/E0.2FE3 (no cracks) Cyl. 11/E0.6FE3 (no cracks) Cyl. 12/E0.6FE3 (no cracks) Cyl. 31/E0.6FE3 (one crack) Cyl. 32/E0.6FE3 (no cracks)
(a) Mean value of total chloride content at different depths
(b) Standard deviation of total chloride content at different depths
(a) 25mm depth
(b) 35mm depth
Fig.10 Probability density of the time to corrosion initiation for the considered loading conditions
Fig.11 Probability of corrosion initiation for three environmental conditions considering loading
effects 0 0.1 0.2 0.3 0.4 0.5 0.6 0.7 0.8 0.9 1 0 10 20 30 40 50 60 70 80 Pr ob ab ili ty o f c or ro si on in iti ati on Time (years) Moderate (Group 1) Moderate (Group 2) Moderate (Group 3) High (Group 1) High (Group 2) High (Group 3)