HAL Id: hal-00264941
https://hal.archives-ouvertes.fr/hal-00264941
Preprint submitted on 18 Mar 2008
HAL is a multi-disciplinary open access
archive for the deposit and dissemination of sci-entific research documents, whether they are pub-lished or not. The documents may come from teaching and research institutions in France or abroad, or from public or private research centers.
L’archive ouverte pluridisciplinaire HAL, est destinée au dépôt et à la diffusion de documents scientifiques de niveau recherche, publiés ou non, émanant des établissements d’enseignement et de recherche français ou étrangers, des laboratoires publics ou privés.
Use of advanced cluster analysis to characterize seafood
consumption patterns and methyle mercury exposures
among pregnant women
François Pouzaud, Assia Ibbou, Sandrine Blanchemanche, Philippe
Grandjean, Michel Krempf, Philippe Verger
To cite this version:
François Pouzaud, Assia Ibbou, Sandrine Blanchemanche, Philippe Grandjean, Michel Krempf, et al.. Use of advanced cluster analysis to characterize seafood consumption patterns and methyle mercury exposures among pregnant women. 2008. �hal-00264941�
N° 2007/14
Use of advanced cluster analysis to characterize seafood
consumption patterns and methyle mercury exposures among
pregnant women
François Pouzaud Met@risk, INRA Assia Ibbou Met@risk, INRA Sandrine Blanchemanche Met@risk, INRA Philippe GrandjeanInstitute of Public Health, University of Southern Denmark Michel Krempf
INSERM U539 - Nantes University Hospital Philippe Verger
ABSTRACT
Because of the variability in food contamination and nutrient contents, consumers must balance the risks and benefits of fish consumption through their choice of species, meal size and frequency. The objectives of this study were to characterize the risk of MeHg exposure in French pregnant women consuming fish, and to explore the use of unsupervised statistical learning as an advanced type of cluster analysis to identify patterns of fish consumption that could predict exposure to MeHg and the coverage of the Recommended Daily Allowance for n-3 PUFA. The proportion of pregnant women exposed at levels higher than the Tolerable Weekly Intake (PTWI) for MeHg is similar to that observed amongst women of childbearing age in previous French studies. At the same time, only about 50% of the women reached the recommended intake of 500 mg/day n-3 PUFA. Cluster analysis of the fish consumption showed that they could be grouped in five major clusters that are largely predictable of the intake of both MeHg and n-3 PUFA. This study provides demonstrates that a global increase in seafood consumption could lead to MeHg exposure above the toxicological limits, thereby questioning the potential beneficial effects of n-3 PUFA intakes. Only pregnant women consuming a high proportion of fatty fish meet the n-3 PUFA intake requirements without exceeding the toxicological limit for MeHg. The clusters identified suggest that different intervention strategies may be needed to address the dual purpose of ensuring high PUFA intakes at acceptable MeHg exposures.
Key words: Methylmercury, pregnancy, fish, dietary exposure, biomarker,
non-supervised clustering.
Funding: This research was jointly funded by grants from the Research Program on
Human Subjects Review: All research methods and materials were approved by the
local Ethics Committee for Pays de Loire (Nantes) regarding the protection of individuals participating in biomedical research programs.
INTRODUCTION
Fish is a valuable food because it provides considerable amounts of easily digestible protein of high biological value and, especially in the case of marine species, can constitute a good source of iodine, selenium and vitamins A and D (EFSA, 2005). Fish is beneficial to the development of cognition during infancy and the maintenance of cardiovascular health in the whole population because it contains long-chain polyunsaturated fatty acids of the n-3 variety (n-3 PUFA). These nutrients are crucial to fetal development; in particular, eicosapentaenoic acid (EPA), docosapentaenoic acid (DPA) and docosahexaenoic acid (DHA) appear important to ensuring optimum development of the central nervous system (Alessandri et al., 2004).
At the same time, fish consumption is also the primary dietary source of human exposure to methylmercury (MeHg), a well-known human neurotoxicant absorbed almost exclusively from eating fish and seafood products. Of the organic mercury compounds, MeHg is the most toxic form and is highly absorbed in humans (>95% of ingested dose) (Aberg et al., 1969). It passes easily across the placenta to the fetus and is retained with a long half-life in the nervous system (UNEP, 2002; NRC, 2000).
Most epidemiological studies of populations with high fish and seafood consumption have reported that maternal MeHg exposure during pregnancy adversely affects the developing nervous system of the fetus (McKeown-Eyssen et al. 1983; Kjellstrom 1991; Lebel et al., 1996a, 1998b; Grandjean et al. 1999; Murata et al. 1999a, 1999b; Steuerwald et al. 2000; Cordier et al. 2002; Stewert et al. 2003). Neuropsychological tests have shown that children exposed to MeHg during prenatal development perform less well on several neuropsychological tests, including those representing concentration, fine motor speed and verbal memory, than non-exposed children (Grandjean et al. 1997; NRC, 2000; UNEP, 2002). The MeHg-associated adverse effects may be less pronounced at high fish nutrient intakes (Oken et al., 2005; Budtz-Jørgensen et al., 2007)..
Safe intake levels of MeHg have recently been reviewed (WHO, 1990; NRC, 2000; US EPA, 2001; AFSSA, 2003; JECFA, 2003), and a new provisional tolerable weekly intake (PTWI) of 1.6 µ g / Kg body weight per week was proposed by the Joint FAO/WHO Expert Committee on Food Additives and Contaminants (JECFA, 2003). The US NRC, using slightly different calculations, arrived at a PTWI of 0.7 µ g/kg/week (NRC, 2000).
The concentrations of LC n-3 PUFA and MeHg present in different fish species vary considerably (Mahaffey, 2004). Lean fish has a relative PUFA content of less than 1% to 4% of total fat (FAO, 2003) corresponding to about 0.25 to 1 gram LC n-3 PUFA per 100 grams of fish. However, fatty fish may contain more than 10% of total fat, corresponding to up to around 5 grams LC n-3 PUFA per 100 g of fish. As for MeHg, major predatory species such as shark, swordfish or bluefin tuna can be contaminated to a degree higher than the 1 µg/kg limit, while small non-predatory fish like herring or sardine contain MeHg at concentrations that are one-tenth of that level or lower.
In previous publications (Crépet et al., 2005; Verger et al., 2007), and by combining data on fish consumption and contamination, our research team demonstrated that about 3% to 5% of French women of childbearing age consuming fish were likely to exceed the PTWI for MeHg. In view of the variability described above regarding both food contamination and nutrient content, the choice of fish species by consumers is crucial to the balance between the risks and benefits of consuming fish (Mahaffey, 2004). The objectives of this paper were thus, firstly, to determine whether the probability of exceeding the PTWI for MeHg was similar in women during pregnancy as in women of childbearing age. Secondly, we wanted to compare modeled dietary exposure with both measurements of the hair-mercury concentration of our subjects and with the Benchmark Dose Level (BMDL) obtained from major epidemiological studies on MeHg. Finally, in order to contribute to the risk/benefit analysis of eating fish, we applied unsupervised statistical learning to identify different clusters of fish consumption
behaviors that may be predictable of exposure to MeHg and/or coverage of the Recommended Daily Allowance for LC n-3 PUFA.
MATERIALS AND METHODS Subjects
Between December 2005 and August 2006, fish consumption was assessed in pregnant French women attending the Nantes University Hospital, Nazaire Hospital and the Saint-Herblain Polyclinic. Nantes, Saint-Nazaire and Saint-Saint-Herblain are towns in the coastal region of Loire Atlantique where the frequency of fish consumption is higher than in other French regions distant from the sea (Credoc, 1996; Ofimer, 2005).
Participants were recruited at 12 weeks of pregnancy (gestational age was determined from the first day of the last menstrual period) at the time of their initial visit for an ultrasound examination. Those eligible needed to be capable of completing study questionnaires in French, were not planning to move out of the study area before the end of their pregnancy, were no younger than 18 years of age and had hair that was 3 cm long or longer. Criteria for exclusion from the study were African hair, permed or dyed hair, no fish or seafood consumption, multiple pregnancies, pathological conditions (HIV, hepatitis or metabolic diseases), hormone therapy and the consumption of fish oil preparations. Of the 355 women approached, 326 agreed to take part in the study (92%) and 29 women refused to participate (mainly because of a lack of interest). Amongst those who agreed, 165 were ineligible (51% of those who agreed), because of dyed or permed hair (12%), pathological pregnancy (8%), African hair (3%), no fish and seafood consumption (3%), multiple pregnancies (2%) and other reasons (23%). Of the 161 eligible participants, 137 women (85%) agreed to return for a second visit (at 32 weeks of pregnancy), satisfactorily completed food frequency questionnaires and provided hair samples. At the time of enrolment, 86% of women were
between 25 and 30 years of age (mean=30 ± 4, range: 19 to 43). The mean body weights of women at 12 and 32 weeks of pregnancy were 59.7 ± 11.2 and 72.6 ± 12.1 kg, respectively.
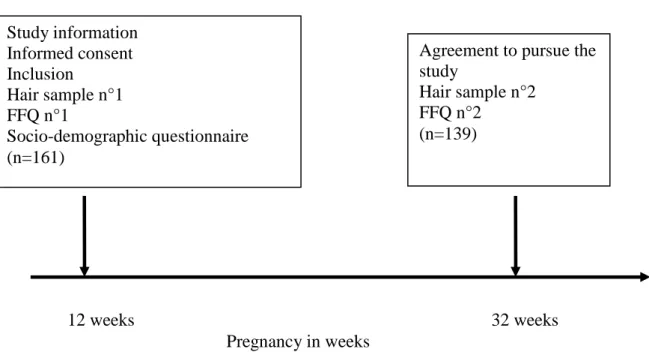
Experimental protocol (Figure 1)
A meeting was held at each recruitment center with the head of the Maternity Unit and medical staff members. Practical aspects of the study were explained by one of the research team. At enrolment, each participant was invited to read an information letter explaining the study, and then those who were eligible were asked to sign the informed consent form. Each participant completed the initial food frequency questionnaires (FFQ). At that time (T0), a hair sample was collected by gathering strands of hair and cutting them from the occipital area of the scalp (approximately the diameter of a matchstick) (Grandjean et al., 2002; Weihe et al., 2005). Hair samples were stored in a labeled paper envelope at room temperature. Before the end of the interview, the women received a stamped envelope containing a questionnaire for the collection of socio-demographic data, and information on their awareness to advisories, risk perceptions concerning food consumption and dietary habits.
During the second visit, performed at 32 weeks of gestation, participants completed a second FFQ. A hair sample was collected using the same methods as those described above.
During the study, participants were interviewed face to face by the same trained researcher. Questionnaires and hair samples were collected, coded and packaged by the same researcher. All procedures were carried out in compliance with the ethical standards for human experimentation established by the Declaration of Helsinki1. The study was approved by the local Ethics Committee (CCPPRB) for Pays de Loire (Nantes). All participants signed an informed consent form before any study procedures were carried out.
1
Fish consumption
Fish consumption was assessed using a detailed FFQ which had previously been used and calibrated (CALIPSO, 2006). The interviewer inquired about the average quantity (in grams) and frequency of consumption of all fish and seafood products during past months. The questionnaire contained 49 items and also included four food sections regarding the intake of 36 species of freshwater fish, canned fish (anchovies, mackerel, sardines and pilchards, tuna), smoked fish (haddock, herring, mackerel, salmon) and seafood products (fish cakes, surimi, fish soup, paella and fish eggs).
Response options on the questionnaire ranged from never to once a day (never, less than once a month, once a month, 2-3 times a month, once a week, 2-3 times a week, 4-6 times a week, daily). Portion sizes of fresh fish and seafood products were identified using a catalogue of photos (SUVIMAX, 1994). Fish consumption was normalized to a weekly consumption for each of the 49 items (36 fresh fish, 4 canned fish, 4 smoked fish and 5 seafood products); for example, we coded “2-3 times a month” as 0.625 times a week.
The FFQ was administered twice to each subject during pregnancy at an interval of 5 months, in order to allow for changes to hair-mercury concentrations. The questions focused on frequencies of consumption from once a month to more than once a day. Under these conditions, this type of questionnaire is deemed to be reproducible (Feunekes et al., 1995).
Estimated intake of n-3 PUFA
The amount of each fish species eaten by each subject was also combined with the corresponding average level of n-3 PUFA. The concentration of n-3 PUFA in fish species on the French market was estimated from the results of analyses of the total fat content in fish performed since 2004 by the French Ministry of Agriculture and Fisheries and assuming that
25% of total fats were n-3 PUFA. If these data were not available for a particular fish species, a default value was taken from the literature (Mahaffey, 2004; EFSA, 2005).
Assessment of MeHg exposure Dietary exposure modeling
The amount of each fish species eaten by each subject was combined with the corresponding mean MeHg content. Figures on methylmercury concentrations originated from the analyses conducted by the Ministry of Agriculture, Food, Fisheries and Rural Affairs in France between 1998 and 2003 (Verger et al., 2007). In order to ensure comparability with previous publications (Crépet et al., 2005; Verger et al, 2007), analytical results expressed as total mercury were converted into methylmercury using published conversion factors (Cossa et al., 1989; Thibaud et al., 1989; Claisse et al., 2001).
Mercury in hair
Mercury analyses were performed using atomic-absorption spectrometry (Pineau et al., 1990; Grandjean et al., 2002). After microwave digestion of an accurately weighed hair sample representing a 2-cm segment close to the scalp, the digested sample was further prepared and analyzed in duplicate. Mercury analyses were performed by flow-injection cold-vapor atomic absorption spectrometry using Perkin-Elmer apparatus (FIMS-400; Perkin-Elmer, Norwalk, Connecticut). The mercury results were read against a standard curve prepared from a mercury stock treated in the same way as digested samples. The limit of detection for the dissolved sample was estimated to be 0.42µg/l, i.e., three times the standard deviation of the blank. Total analytical imprecision was estimated to be 2.0% and 3.8% at mercury concentrations of 4.7 µg/g and 11.8 µg/g, respectively. The accuracy of mercury determinations in human hair was ensured using the certified reference material CRM 397 (BCR, Brussels, Belgium) as a quality
control; mercury concentrations averaged 11.80 µg/g compared to the assigned value of 11.93 µg/g+0.77 µg/g.
Statistical analysis
A first analysis consisted of comparing the results concerning individual variables (consumption and exposure) between 12 and 32 weeks of pregnancy. The results are presented as means, median and 95th percentile. A paired T-test was applied to means and a non-parametric test (Wilcoxon test) to enable comparisons between groups. The level of statistical significance was set at 5%.
Unsupervised statistical learning
An important goal of this paper was to apply a “segmentation” of the fish consumers examined during the study, in order to highlight subgroups that were homogeneous with respect to their pattern of fish consumption and to clarify their characteristics. This so-called unsupervised learning task was based on a cluster analysis aimed at partitioning a dataset into subgroups such that those in each particular subgroup are more “similar” than those found in other subgroups. Numerous methods have been proposed and studied in the statistical literature to identify such clusters (Gordon 1999 for a review), most of them relying on a specific distance to measure dissimilarity between pairs of objects. In the present case, the objects examined were the vectors indicating fish consumption frequencies. Two fish consumers were assumed to be “similar” if the corresponding frequency vectors were close according to Euclidian distance. This approach resulted in clusters of consumers with a simultaneously small dispersion regarding all types of fish (i.e. the consumption frequencies of individuals within each subgroup were simultaneously close regarding all types of fish).
From several candidate clustering algorithms (mobile centroids, ascending hierarchical classification, etc.) which could minimize distance-based dispersion measurements, the
optimization procedure that appeared to provide the strongest results was Kohonen’s neural
algorithm approach, which we now briefly describe (Kohonen 2001).
Kohonen’s self-organizing maps (SOM)
SOMs belong to the family of artificial neural networks and produce low dimensional representations (2-dimensional in our case) of (possibly very high dimensional) data sets. They are very convenient from the interpretation perspective in the sense that they preserve the
topological properties of the input space (here, the space of all possible values of the vector of fish consumption frequencies): “adjacent classes” of SOMs contain objects that are close in the input space. It is then easy to see which subgroups should be eventually merged so as to obtain a parsimonious clustering of objects. An SOM is obtained by training a standard neural network algorithm on the data set. In the present case, computations were performed by implementing the SAS routines developed by Patrick Letrémy (see http://matisse.univ-paris1.fr/). As a result of the Kohonen classification, macro-classes are statistically different using a multidimensional test (Hotelling test).
After clustering for fish consumption, the objective was to predict consumer exposure to MeHg. To determine MeHg levels in the diet, we used as thresholds the PTWI values established by JECFA (1.6 µg/kg bw/week) and US NRC (0.7 µg/kg bw/week). For mercury in hairs we chose arbitrarily the value of the 75th percentile of the distribution of this concentration in our subjects (0.93 µg/g hair). Similarly, we used the median of the distribution (0.43 g/day - close to the Recommended Daily Allowance of 0.5 g/day) as a threshold for n-3 PUFA. Subjects within the clusters were classified as a function of these three parameters.
Finally, we compared the macro-classes resulting from clustering at 12 and 32 weeks. The differences between macro-classes at 12 and 32 weeks of pregnancy were estimated using a multidimensional test (Hotelling test). The level of statistical significant was set at 5%.
RESULTS
Fish and seafood consumption
The most frequently consumed fish species were cod, Alaska hake, tuna (canned) and salmon, and the distribution of their consumption is described in Table 1. The results were similar at 12 and 32 weeks of pregnancy. The mean level of consumption of each of the other fish species was less than 20 grams per week.
Dietary exposure to methylmercury and n-3 PUFA
Dietary exposure to MeHg was similar at 12 and 32 weeks of pregnancy, with respective mean values of 0.56 µ g/kg bw/week and 0.67 µ g/kg bw/week. At the 95th percentile of the distribution curve, dietary exposure was estimated to be 1.79 and 1.66 µg/kg bw/week, respectively, at the 12th and 32nd weeks of pregnancy (Table 2).
At 12 weeks of pregnancy, hair mercury concentrations ranged from 0.17 to 3.66 µg/g, with a mean of 0.81 µ g/g (n=161). At 32 weeks of pregnancy, hair mercury levels ranged from 0.13 to 2.88 µg/g, with a mean of 0.81 µ g/g (n=137).
Estimated concentrations of n-3 PUFA in various fish species are shown in Table 3. The distribution of n-3 PUFA ingested by our group of subjects is described in Table 5. In terms of the commonly recommended intake of 0.5 grams, about half of the women reached this level and about 20% of them were ingesting more than 1 gram n-3 PUFA per day.
Clustering of fish consumer behavior
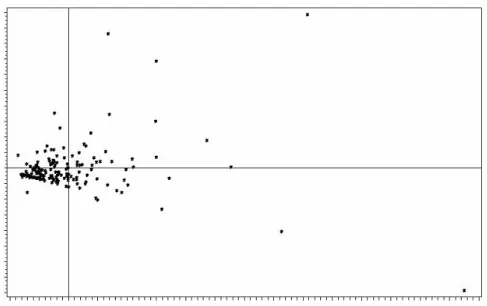
As shown in particular by the Principal Component Analysis performed initially on consumption frequencies data, our training datasets exhibited highly nonlinear features (see Figure 2). It was therefore unlikely that these data would be grouped in a few homogeneous
clusters without any preliminary transformation of the observed variables: all partitioning methods used on (non-reprocessed) data yielded unreliable numerical results. To remedy this, we chose to reduce the dimension of the data by grouping together in a single variable the consumption of both predatory fish and fatty fish. We then added the consumption variables sequentially and one-by-one, in decreasing order of the average consumption level (i.e. starting with the most widely consumed fish species), stopping when intra-class variance was seen to increase without any additional, significant decrease in global dispersion. In this way, we obtained a clustering based on four variables corresponding to the consumption of high-fat fish, cod, predatory fish and Alaska hake (sorted by order of importance with respect to discriminatory power, measured in terms of Fisher p-values in the ANOVA).
SOM macro-classes at 12 weeks
When applying the SOM method to two data sets (at 12 and 32 weeks of pregnancy) we used a grid containing 64 units. The choice of the number of P units was arbitrary (commonly P<100 units). The units of the Kohonen map obtained were merged into 5 macro-classes (represented by colored group of boxes) on the grounds of parsimony, and in accordance with the method suggested by Cottrell et al. (1999) using a hierarchical classification with Ward distance. Each of the five macro-classes corresponded to a specific fish consumption behavior.
Segmentation into five classes of the population observed according to the consumption data set at 12 weeks of pregnancy explained more than 75% of total inertia. These classes could be described as follows:
Macro-class 1 (colored pink in Figures 3 and 4): this group represented 81% of the
population observed. This group was characterized by individuals regularly consuming small quantities of the four fish species used in the clustering procedure: within this subgroup, 81% of individuals ate less than the Average Weekly Consumption (AWC) = 222 g of fish. The
vast majority (92%) of individuals in this macro-class were exposed below the threshold of 0.7 µg/kg bw for MeHg and 99% were exposed below the threshold of 1.6 µg/kg bw based on modeled dietary exposure. As for hair concentrations of MeHg, 77% of the individuals of this class exhibited levels below the distribution’s third quartile. n-3 PUFA intake in this class was below the median value (0.43 g/day) in 46% of subjects.
Macro-class 2 (colored mauve in Figures 3 and 4): This group contained 5% of the
population observed and was characterized by a high predatory fish consumption (AWC = 217.34 g; AWC of the population = 51.26g). Individuals in this group also consumed fatty fish, cod and hake, but in moderate quantities (see Table 6). 75% of individuals of this group were exposed above the threshold of 0.7 µg/kg bw/week but below the threshold of 1.6 µg/kg bw/week. Other subjects in this class (25 %) were exposed above the threshold of 1.6 µg/kg bw/week. One in two individuals in this class had mercury concentrations in their hair above the third quartile (0.93µ g / g). A large proportion (87%) of estimated intakes of n-3 PUFA in this class was above the median value of 0.43 g/day.
Macro-class 3 (colored green in Figures 3 and 4): This class represented 6% of the
population observed and was characterized by a high cod consumption (average weekly consumption of 187.40g, compared with the general average weekly consumption of 51.44g). The consumption of fatty fish, predatory fish and hake was below the general mean (see Table 6). The majority of individuals in this group (70%) were exposed below the threshold of 0.7 µg/kg bw/week of methylmercury. 80% of consumers in this macro-class had methyl mercury concentrations in their hair lower than the third quartile (0.93µg / g). The estimated n-3 PUFA intake was higher than the median value in 60% of individuals.
Macro-class 4 (colored blue in Figures 3 and 4). This group included 4% of the
population observed, and fatty fish consumption was dominant (average weekly consumption = 344.06 g; the mean consumption in the population = 77.53 g). The average consumption of
predatory fish was close to the average in the general population. Cod and hake consumption was slightly higher than the general AWC. All consumers in this macro-class were below the dietary exposure threshold of 1.6 for MeHg, and 66% of them had methyl mercury concentrations in their hair lower than the third quartile (0.93µ g / g). Concentrations of omega-3 were above the median value for all individuals in this class.
Macro-class 5 (colored orange in Figures 3 and 4). This group included about 4% of
the population observed and corresponded to the consumption of large quantities of fatty fish, predatory fish, cod and hake, the average weekly consumptions of which were 380.21 g, 300.83 g, 245.83 g and 237.50 g, respectively, when compared with the general AWC (see Table 6). All consumers within this macro-class were exposed above the PTWI of 1.6 µg/kg bw/week, and 66% of them had methyl mercury concentrations in their hair higher than the third quartile (0.93µg / g). The estimated intake of omega-3 by all individuals in this class was more than 1.5 grams/day, corresponding to three times the RDA.
SOM macro-classes at 32 weeks
After 32 weeks of pregnancy, we observed a different segmentation of the population. This segmentation explained 69% of total inertia. Only two out of five classes were similar at 12 and 32 weeks of pregnancy based on a multidimensional Hotelling test, i.e. macro-class 2 (p=0.79) characterized by a high consumption of predatory fish (13% of subjects at 32 weeks) and macro-class 3 (p=0.13) characterized by a high consumption of cod (8% of subjects at 32 weeks of pregnancy). Macro-class 4 was also characterized by a high consumption of fatty fish at both 12 and 32 weeks, but due to the limited number of subjects in these classes (respectively 6 and 8 subjects), the statistical test failed to demonstrate any similarity (p=0.018). Otherwise, we observed that the largest class (macro-class 1) included individuals consuming small quantities of the four fish species used for the clustering procedure. At 32
weeks, this class was smaller than at 12 weeks, accounting for 53% of subjects (versus 81% at 12 weeks). This was because firstly, the number of observations decreased, and secondly, the number of individuals consuming less than the Average Weekly Consumption of the four fish species and globally included in this class, also decreased (from 68% at 12 weeks of pregnancy to 56% at 32 weeks). Finally, macro class 5, characterized at 12 weeks by a high consumption of the four fish categories, had disappeared at 32 weeks. A “new” macro-class 5 appeared, where women were consuming all fish species in larger quantities than subjects in macro-class 1, but less than the previous macro-class 5 (Table 6).
Discussion
This study enabled a characterization of the risk of MeHg exposure in pregnant French women consuming fish. First of all, it confirmed that the proportion of pregnant women exposed above the PTWI for MeHg was similar (5%) to that observed amongst women of childbearing age in previous studies (Crepet, 2005; Verger, 2007). This similarity may be due to the lack in France of any systematic advice about the risks of MeHg exposure. Indeed, obstetricians frequently advise women to consume fish during pregnancy because of the potential benefits of n-3 PUFA. In view of the fact that 75% of consumers are eating fish at least once a week (CREDOC, 1998), and 800,000 babies are born in France every year (INSEE, 2007), 5% of pregnant women exposed over the PTWI would correspond to about 30,000 newborns per year in whom exposure exceeds the safe limit for MeHg. Although exceeding the PTWI or the lower limit recommended by the NRC may not result in any detectable adverse effect, emphasis on protecting optimum brain development would suggest that exposure to neurotoxicants should be minimized. In terms of the mercury levels found in the hair of pregnant women, our results were consistent with those obtained by modeling. Thus, the
percentage of women exceeding a safe level of mercury in their hair was similar to the one based on the FFQ data (4% of subjects).
The cluster analysis provides a key to understanding the consumer behavior regarding fish consumption and its relationship with MeHg exposure and n-3 PUFA intake. First of all, we found that although about 5% of our subjects exceeded the PTWI for MeHg, some 50% of the pregnant women were consuming less than the recommended amount of 500 mg/day n-3 PUFA. The non-supervised clustering identified five different behavior patterns that were largely predictable of both the risks and benefits of MeHg and n-3 PUFA. The macro-class containing the majority of the subjects (class 1 in Figure 3) was characterized by a relatively low total consumption of different fish species (mean: 440 g/week). This consumption corresponded to the most widespread recommendations (eating two portions of fish per week). Within this class, 99% of individuals were below the toxicological threshold established for MeHg and 77% were below the 75th percentile for mercury in hair. The distribution of n-3 PUFA intake in this class was close to that found in all the populations studied, i.e. one in two individuals was consuming less than nutritional guideline levels of n-3 PUFA. Subjects in class 3 could be similarly described (Figure 6): they were consuming slightly more fish than those in class 1 (mean: 474 g/week vs. 440 g/week), but a large proportion of the fish consumed was cod (mean: 187g/week vs. 30 g/week) which is a white/lean fish. Both classes may be defined as “low risk” and “medium benefit”. Subjects in class 2 were characterized by a high consumption of fish (mean: 680 g/week), including a high consumption of predatory fish (mean: 217 vs. 51 g/week in class 1). These subjects were eating about three portions of fish per week - including one portion of predatory fish – and could therefore be defined as “medium risk and high benefit”. In contrast, subjects in class 4 had an even higher overall consumption of fish (mean: 890 g/week) and a high consumption of fatty fish (mean: 344 vs. 78 g/week in class 1) could be defined as “low risk” and “high benefit”. Finally, subjects in
class 5 were the highest consumers of all fish species (mean: 1540 g/week), eating it almost every day (or more than seven times a week), and could be defined as “high risk” and “high benefit”. In this group, where all subjects were exposed above the PTWI for MeHg, the additional benefit of their n-3 PUFA intake, which corresponded to three times the nutritional guideline level, may be questionable.
The comparison between 12 and 32 weeks of pregnancy made it possible to document a decline in the numbers of both high (macro-class 5) and low consumers (macro-class 1) in regard to particular fish species. Interestingly, we observed an increase in the number of high consumers of predatory fish (13% vs. 5%). Some individuals (9% of those observed over the two periods) were grouped in class 1 at 12 weeks, but later belonged to the class characterized by a high consumption of predatory fish. This explained why the overall results were similar in terms of fish consumption and MeHg exposure between the beginning and the end of pregnancy.
The clusters identified suggest that different groups of women may not require the same information in regard to recommendable seafood consumption. Even in this coastal population wti easy access to seafood, most women consumed less fish than needed to reach PUFA intake levels considered optimal. However, the mercury exposure levels show that supplementary fish intake among these women should emphasize fatty fish that are low in MeHg. Among women who were eating much seafood, recommendations to abstain from eating predatory species would be appropriate.
Conclusion
The ultimate goal of risk analysis in food science is to guide decision-making in order to reduce risks and optimize nutritional benefits in consumers. This study provides evidence on the risks and benefits of fish consumption by pregnant women, and it demonstrates in
particular that a global increase in this consumption is leading to MeHg exposures above the toxicological limits, thereby reducing the beneficial effects. Although our knowledge of consumer behavior is incomplete, the dietary advisories should take into account that different clusters exist and that different messages may be needed. This underlines the complexity to communicated health benefits and also points to the difficulty that consumers face when detailed risk/benefit information is provided (For discussion see Roosen et al. 2007, Blanchemanche et al. 2006).
Acknowledgments
We are very grateful to Dr Stéphan Clémençon for his guidance regarding statistical analyses. We would also like to thank Ms. Brita Andersen and Ranja Bjerring for carrying out mercury analyses, and the women who participated in this prospective study. We are indebted to the members of Saint-Nazaire Hospital, Nantes University Hospital and the Polyclinique de l'Atlantique in Saint-Herblain. Special thanks go to Sylvie and Céline for their assistance with generating this cohort.
Figure 1: Description of the experimental protocol
Table 1: Distribution of consumption regarding the four most widely consumed fish species
Cod Canned tuna Alaska Hake Salmon
g/week g/week g/week g/week
Mean 50.5 27.6 41.9 46.9 Median 25.0 18.8 25.0 12.5 P90 125.0 56.3 100.0 137.5 P95 200.0 75.0 200.0 147.5
12 weeks
Max 375.0 300.0 375.0 560.0 Mean 44.2 50.7 31.0 37.4 Median 25.0 30.0 12.5 11.3 P90 125.0 144.0 92.2 134.6 P95 125.0 183.7 111.3 142.532 weeks
Max 500.0 300.0 250.0 162.5Table 2: Comparison between modeled dietary exposure and mercury concentrations
in hair.
Modeled dietary exposure Mercury in hair
Unit µg/kg bw/week µg/kg bw/week µg/g µg/g
Period 12 weeks 32 weeks 12 weeks 32 weeks
12 weeks 32 weeks Pregnancy in weeks Study information Informed consent Inclusion Hair sample n°1 FFQ n°1 Socio-demographic questionnaire (n=161)
Agreement to pursue the study
Hair sample n°2 FFQ n°2
Table 3: Distribution of dietary intake of n-3 PUFA in women at 12 and 32 weeks of pregnancy 12 weeks 32 weeks g/week g/week 25th percentile 0.20 0.24 Median 0,44 0.48 90th percentile 1.47 1.27 95th percentile 2.08 1.65 Max 4.76 5.42
•
PTWI established by JECFA
∗
Derived from the BMDL of 14 µg/g hair calculated by JECFA divided by uncertainty factors of 2 and 3.2 to account respectively for inter-individual variability in the hair/blood ratio and in the rate of elimination.
Median 0.35 0.45 0.67 0.65
95th percentile 1.79 1.66 1.89 1.95
Maximum 4.82 6.71 3.66 2.82
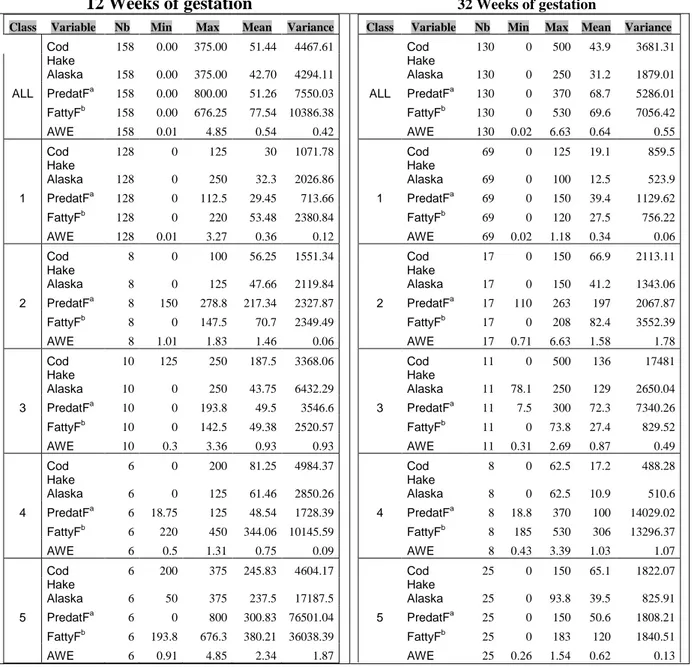
Table 4: Consumption of different fish species by macro-class 12 Weeks of gestation 32 Weeks of gestation
Class Variable Nb Min Max Mean Variance
Cod 158 0.00 375.00 51.44 4467.61 Hake Alaska 158 0.00 375.00 42.70 4294.11 ALL PredatFa 158 0.00 800.00 51.26 7550.03 FattyFb 158 0.00 676.25 77.54 10386.38 AWE 158 0.01 4.85 0.54 0.42 Cod 128 0 125 30 1071.78 Hake Alaska 128 0 250 32.3 2026.86 1 PredatFa 128 0 112.5 29.45 713.66 FattyFb 128 0 220 53.48 2380.84 AWE 128 0.01 3.27 0.36 0.12 Cod 8 0 100 56.25 1551.34 Hake Alaska 8 0 125 47.66 2119.84 2 PredatFa 8 150 278.8 217.34 2327.87 FattyFb 8 0 147.5 70.7 2349.49 AWE 8 1.01 1.83 1.46 0.06 Cod 10 125 250 187.5 3368.06 Hake Alaska 10 0 250 43.75 6432.29 3 PredatFa 10 0 193.8 49.5 3546.6 FattyFb 10 0 142.5 49.38 2520.57 AWE 10 0.3 3.36 0.93 0.93 Cod 6 0 200 81.25 4984.37 Hake Alaska 6 0 125 61.46 2850.26 4 PredatFa 6 18.75 125 48.54 1728.39 FattyFb 6 220 450 344.06 10145.59 AWE 6 0.5 1.31 0.75 0.09 Cod 6 200 375 245.83 4604.17 Hake Alaska 6 50 375 237.5 17187.5 5 PredatFa 6 0 800 300.83 76501.04 FattyFb 6 193.8 676.3 380.21 36038.39 AWE 6 0.91 4.85 2.34 1.87
Class Variable Nb Min Max Mean Variance
Cod 130 0 500 43.9 3681.31 Hake Alaska 130 0 250 31.2 1879.01 ALL PredatFa 130 0 370 68.7 5286.01 FattyFb 130 0 530 69.6 7056.42 AWE 130 0.02 6.63 0.64 0.55 Cod 69 0 125 19.1 859.5 Hake Alaska 69 0 100 12.5 523.9 1 PredatFa 69 0 150 39.4 1129.62 FattyFb 69 0 120 27.5 756.22 AWE 69 0.02 1.18 0.34 0.06 Cod 17 0 150 66.9 2113.11 Hake Alaska 17 0 150 41.2 1343.06 2 PredatFa 17 110 263 197 2067.87 FattyFb 17 0 208 82.4 3552.39 AWE 17 0.71 6.63 1.58 1.78 Cod 11 0 500 136 17481 Hake Alaska 11 78.1 250 129 2650.04 3 PredatFa 11 7.5 300 72.3 7340.26 FattyFb 11 0 73.8 27.4 829.52 AWE 11 0.31 2.69 0.87 0.49 Cod 8 0 62.5 17.2 488.28 Hake Alaska 8 0 62.5 10.9 510.6 4 PredatFa 8 18.8 370 100 14029.02 FattyFb 8 185 530 306 13296.37 AWE 8 0.43 3.39 1.03 1.07 Cod 25 0 150 65.1 1822.07 Hake Alaska 25 0 93.8 39.5 825.91 5 PredatFa 25 0 150 50.6 1808.21 FattyFb 25 0 183 120 1840.51 AWE 25 0.26 1.54 0.62 0.13
a: Predatory fish including tuna, dogfish, shark, swordfish, grenadier, ling, marlin, grouper. b: Fatty fish including herring, mackerel, sardine, salmon, trout.
Figure 2: First factorial plane: graphical display of individuals (Consumption at 12 weeks)
Figure 3: Grouping of consumers according to similarities of fish consumption patterns at 12 weeks of
pregnancy. Colors indicate macro-classes, obtained applying a hierarchical classification to the centroids of classes.
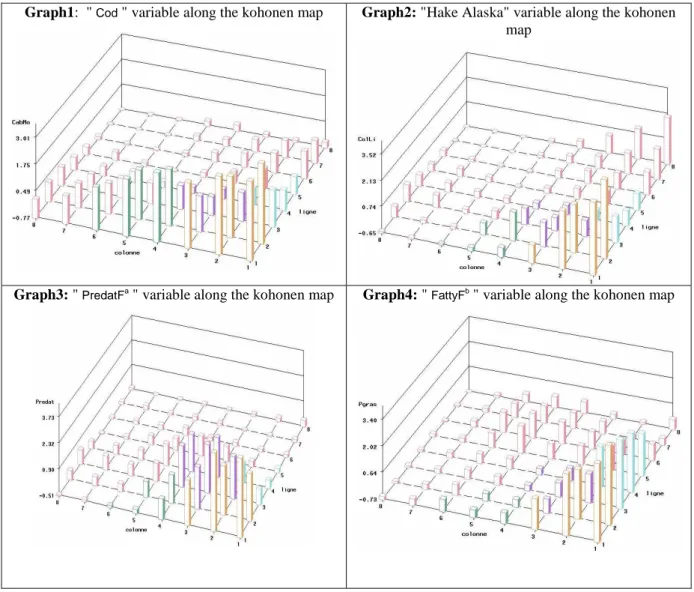
Figure 4: 3-dimensional visualization of the consumption of different fish categories in
macro-classes.
Graph1: " Cod " variable along the kohonen map Graph2: "Hake Alaska" variable along the kohonen
map
Graph3: " PredatFa " variable along the kohonen map Graph4: " FattyFb " variable along the kohonen map
a: Predatory fish including tuna, dogfish, shark, swordfish, grenadier, ling, marlin, grouper. b: Fatty fish including herring, mackerel, sardine, salmon, trout.
REFERENCES
Aberg B, Ekman L, Falk R, Greitz U, Persson G, Snihs JO. Metabolism of methyl mercury (203Hg) compounds in man. Arch Environ Health. 1969. 19(4):478-84.
AFSSA (2004). Agence Française de Sécurité Sanitaire des Aliments. Avis relatif à la réévaluation des risques sanitaires du méthylmercure lies à la consommation des produits de la pêche au regard de la nouvelle dose hebdomadaire tolerable provisoire (DHTP). Saisine n°2003-SA-0380, 16 Mars 2004, Maison-Alfort, France.
Alessandri JM, Guesnet P, Vancassel S, Astorg P, Denis I, Langelier B, Aid S,Poumes-Ballihaut C, Champeil-Potokar G, Lavialle M. Polyunsaturated fatty acids in the central nervous system: evolution of concepts and nutritional implications throughout life. Reprod.
Nutr. Dev. 2004; 44(6):509-38.
Blanchemanche S., S. Marette, J. Roosen und P. Verger, 2006. Food Risk Management and Regulatory Experiments. The Case of Methylmercury in Fish, in K. Andersson (Ed.),
VALDOR 2006 - VALues in Decisions On Risk – Proceedings, pp. 441-448, Stockholm:
Congrex.
Budtz-Jørgensen, E., N. Keiding, P. Grandjean, and P. Weihe (2002). “Estimation of Health Effects of Prenatal Methylmercury Exposure Using Structural Equations Model.”
Environmental Health 1(2): 145-168.
Budtz-Jørgensen E, Grandjean P, Weihe P. Separation of risks and benefits of seafood intake. Environ Health Perspect 2007; 115: 323-7.
CALIPSO: Fish and seafood consumption study and biomarker of exposure to trace elements, pollutants and omega 3. 2006. Leblanc, J.Ch. coordinator.
http://www.afssa.fr/ftp/afssa/38719-38720.pdf
Cordier S, Garel M, Mandereau L, Morcel H, Doineau P, Gosme-Seguret S, et al. Neurodevelopmental investigation among methylmercury-exposed children in French Guiana.
Cottrell, M. P.Gaubert, P.Letremy, P.Rousset. Analyzing and representing multidimensional quantitative and qualitative data : Demographic study of the Rhone valley. The domestic consumption of the Canadian families, in Kohonen Maps, E.Oja and S.Kaski Eds., Elsevier, Chap. 1, p.1-14, 1999.
Claisse, D., Cossa, D., Bretaudeau-Sanjuan, G., Touchard, G., Bombled, B. (2001). Methylmercury in molluscs along the French coast. Mar. Pollut. Bull. 42, 329–332.
Cossa, D., Auger, D., Averty, B., Lucon, M., Masselin, P., Noel, J.,San-Juan, J. (1989). Atlas des niveaux de concentration en métaux métalloïdes et composés organochlorés dans les produits de la pêche côtière française. Technical Report, IFREMER, Nantes.
Credoc (1996). OCA-CREDOC. “Les disparités régionales de la consommation alimentaire des ménages français.” Rapport n° CP004. Février 1996, Paris.
Credoc (1998). OCA-CREDOC. “Vérification des régimes alimentaires proposés par un organisme non gouvernemental pour estimer des expositions aux dioxines.” Note technique n° 98.33. Septembre 1998, Paris.
Crépet, A., J. Tressou, P. Verger, and J.C. Leblanc (2005). “Management Options to Reduce Exposure to Methylmercury through the Consumption of Fish and Fishery Products by the French Population.” Regulatory Toxicology and Pharmacology 42: 179-189.
E.C. (European Commission), 2004. Methylmercury in fish and fishery products, Health and Consumer Protection Directorate-General, Information note, May.
EFSA (2004). European Food Safety Authority. “Opinion of the Scientific Panel on Contaminants in the Food Chain on a Request from the Commission Related to Mercury and Methylmercury in Food.” EFSA Journal (2004), 34: 1-14. http://www.efsa.eu.int (accessed February 2006).
EFSA (2005). “Opinion of the Scientific Panel on Contaminants in the Food Chain on a Request from the European Parliament Related to the Safety Assessment of Wild and Farmed Fish.” EFSA Journal (2005), 236: 1-118. http://www.efsa.eu.int (accessed February 2006).
FAO, Committee on world food security. The role of aquaculture in improving food security and nutrition. 29th session, Rome (2003).
http://www.fao.org/DOCREP/MEETING/006/Y8871E.HTM
Feunekes I.J., Van Staveren W.A., Graveland F., De Vos J., Burema J. Reproducibility of a semiquantitative food frequency questionnaire to assess the intake of fats and cholesterol in The Netherlands. International Journal of Food Sciences and Nutrition, (1995), 46: 117-123. Gordon A.D. 1999, Classification 2nd Edition, Chapman & Hall/CRC, Monographs on Statistics and Applied Probability 82, ISBN 1-58488-013-9.
Grandjean P, Weihe P, Jørgensen PJ, Clarkson T, Cernichiari E, Viderø T. Impact of maternal seafood diet on fetal exposure to mercury, selenium, and lead. Arch. Environ. Health. (1992),
47: 185–195.
Grandjean P, Weihe P, White RF, Debes F, Araki S, Murata K, Sørensen N, Dahl D, Yokoyama K, Jørgensen PJ. Cognitive deficit in 7-year-old children with prenatal exposure to methylmercury. Neurotoxicol. Teratol. 1997; 19: 417–428.
Grandjean P, Budtz-Jørgensen E, White RF, Jørgensen PJ, Weihe P, Debes F, Keiding N. Methylmercury exposure biomarkers as indicators of neurotoxicity in children aged 7 years.
Am. J. Epidemiol. 1999. 150: 301–5.
Grandjean, P., Jørgensen, P.J., Weihe, P. Validity of mercury exposure biomarkers. In: Wilson SH, Suk WA, Eds. Biomarkers of Environmentally Associated Disease. Boca Raton, FL, CRC Press/Lewis Publishers, 2002, pp. 235-47.
INSEE, 2007. La France en faits et chiffre (mise à jour 01/07)
JECFA (Joint FAO/WHO Expert Committee on Food Additives). Sixty-first meeting, Rome, 10–19 June 2003. Summary and conclusions.
Kjellström T. Effects on early childhood development of prenatal exposure to methylmercury.
Arch. Environ. Health. 1991; 46(2): 118.
1.1.1 Kohonen, T. Self-Organizing Maps. Springer Series in Information Sciences, Vol. 30, Springer, Berlin, Heidelberg, New York, 2001.
Lebel J, Mergler D, Lucotte M, Amorim M, Dolbec J, Miranda D, Arantes G, Rheault I, Pichet P. Evidence of early nervous system dysfunction in Amazonian populations exposed to low levels of methylmercury. Neurotoxicology. 1996a; 17: 157–68.
Lebel J, Mergler D, Lucotte M, Amorim M, Dolbec J. Neurotoxic effects of low-level methylmercury contamination in the Amazonian Basin. Environ. Res. 1998b; 79: 20–31.
McKeown-Eyssen G, Ruedy J, Neims A. Methylmercury exposure in northern Quebec. II: Neurological findings in children. Am. J. Epidemiol. 1983; 118(4): 470– 479.
Mahaffey KR. (2004). Fish and shellfish as dietary sources of methylmercury and the ω-3 fatty acids, eicosahexaenoic acid and doxosahexaenoic acid: risks and benefits. Environ.
Res. 95: 414-428.
Mahaffey K, Clickner R, Bodurow C. “Blood Organic Mercury and Dietary Mercury Intake: National Health and Nutrition Examination Survey, 1999 and 2000.” Environmental Health
Perspective 2004 ; 112(5): 562-571.
Martin A. Apports nutritionnels conseillés pour la population française (2000). Tec et Doc Ed. Paris, France.
Morrissey MT. The good, the bad, and the ugly: weighing the risks and benefits of seafood consumption. Nutr. Health. 2006. 18(2): 193-7.
Murata K, Weihe P, Araki S, Budtz-Jorgensen E, Grandjean P. Evoked potentials in Faroese children prenatally exposed to methylmercury. Neurotoxicol. Teratol. 1999a. 21(4):471–472.
Murata K, Weihe P, Renzoni A, Debes F, Vasconcelos R, Zino F, et al. Delayed evoked potentials in children exposed to methylmercury from seafood. Neurotoxicol. Teratol. 1999b.
12(4): 343–348.
N.R.C. (National Research, Council), 2000. Toxicological effects of Methylmercury. Washington, DC, National Academy Press.
OFIMER (2005). Office National Interprofessionnel des Produits de la Mer et de L’Aquaculture. Bilan Annuel 2004. Consommation des produits de la pêche
et de l’aquaculture. Paris. http://www.ofimer.fr/99_up99load/2_actudoc/1187d1_01.pdf
(accessed June 2006).
Oken E, Wright RO, Kleinman KP, Bellinger D, Amarasiriwardena CJ, Hu H, Rich-Edwards JW, Gillman MW. Maternal fish consumption, hair mercury, and infant cognition in a U.S. Cohort. Environ Health Perspect 2005; 113: 1376-80.
Pineau A, Piron M, Boiteau H-L. Determination of Total Mercury in Human Hair Samples by Cold Vapor Atomic Absorption Spectrometry. J. Anal. Toxicol. 1990, 14: 235-238.
Roosen, J., S. Marette, S. Blanchemanche and P. Verger, 2006. Does Health Risk Information Matter for Modifying Consumption? A Field Measuring the Impact of Risk Information on Fish Consumption. Card Working Paper 06-WP 434, Iowa State University, Ames, Iowa.
Steuerwald U, Weihe P, Jorgensen PJ, Bjerve K, Brock J, Heinzow B, et al. Maternal seafood diet, methylmercury exposure and neonatal neurologic function. J. Pediatr. 2000;
136(5):599–605.
Stewert PW, Reihman J, Lonky EI, Darvill TJ, Pagano J. Cognitive development in preschool children prenatally exposed to PCBs and MeHg. Neurotoxicol. Teratol. 2003; 25(1):11–22.
SU.VI.MAX. (1994) Portions alimentaires Manuel photos pour l'estimation des quantités. Polytechnica éditions, Paris.
Thibaud, Y., Noel, J. (1989). Evaluation des teneurs en mercure, methylmercure et sélénium dans les poissons et coquillages des côtes françaises de la Méditerranée. Rapp. DERO 89-09, IREMER, Nantes.
Thompson F. E., Byers T. (1994).Dietary Assessment Resource Manual. J. Nut. 124:2245S-2317S.
UNEP. 2002. Global Mercury Assessment Report. New York: United Nations Environmental Programme. Avalaible: http://www.chem.unep.ch/mercury/Report/GMA-report-TOC.htm
[accessed 7 may 2004].
U.S. EPA. Water Quality Criterion for the Protection of Human Health: Methyl Mercury. EPA 0823-R-01-001. Washington, DC:U.S. Environmental Protection Agency, 2001.
Verger Ph., Blanchemanche S., Roosen J., Marette S. Impact of a risk-benefit advisory on fish consumption and dietary exposure to methylmercury in France. 2007. Regulatory Toxicology
and Pharmacology 48 (3): 259-269
Weihe P, Grandjean P, Jørgensen PJ. Application of hair-mercury analysis to determine the impact of seafood advisory. Environ. Res. 2005; 97(2):200-7.
Willett WC, Sampson LS, Stampfer MJ, et al., Reprodicibility and validity of a semiquantitative food frquency questionnaire. Am. J. Epidemiol. 1985; 42: b317-22.
WHO (World Health, Organization), 1990. Methylmercury. Environmental Health Criteria 101 Geneva, World Health Organization.
WHO (2006). “Safety Evaluation of Certain Food Additives and Contaminants.” Prepared by the sixty-first meeting of the Joint FAO/WHO Expert Committee on Food Additives, Rome, World Health Organization, June 2003.