Publisher’s version / Version de l'éditeur:
International Journal of Lighting Research and Technology, 32, 4, pp. 175-186,
2001-04-01
READ THESE TERMS AND CONDITIONS CAREFULLY BEFORE USING THIS WEBSITE. https://nrc-publications.canada.ca/eng/copyright
Vous avez des questions? Nous pouvons vous aider. Pour communiquer directement avec un auteur, consultez la
première page de la revue dans laquelle son article a été publié afin de trouver ses coordonnées. Si vous n’arrivez pas à les repérer, communiquez avec nous à PublicationsArchive-ArchivesPublications@nrc-cnrc.gc.ca.
Questions? Contact the NRC Publications Archive team at
PublicationsArchive-ArchivesPublications@nrc-cnrc.gc.ca. If you wish to email the authors directly, please see the first page of the publication for their contact information.
NRC Publications Archive
Archives des publications du CNRC
This publication could be one of several versions: author’s original, accepted manuscript or the publisher’s version. / La version de cette publication peut être l’une des suivantes : la version prépublication de l’auteur, la version acceptée du manuscrit ou la version de l’éditeur.
Access and use of this website and the material on it are subject to the Terms and Conditions set forth at
Daylight availability in top-lit atria: prediction of skylight transmittance
and daylight factor
Laouadi, A.; Atif, M. R.
https://publications-cnrc.canada.ca/fra/droits
L’accès à ce site Web et l’utilisation de son contenu sont assujettis aux conditions présentées dans le site
LISEZ CES CONDITIONS ATTENTIVEMENT AVANT D’UTILISER CE SITE WEB.
NRC Publications Record / Notice d'Archives des publications de CNRC:
https://nrc-publications.canada.ca/eng/view/object/?id=4a738684-591d-4c6d-9dde-682908299b40 https://publications-cnrc.canada.ca/fra/voir/objet/?id=4a738684-591d-4c6d-9dde-682908299b40
Daylight availability in top-lit atria: prediction
of skylight transmittance and daylight factor
Laouadi, A.; Atif, M.R.
A version of this paper is published in / Une version de ce document se trouve dans : International Journal of Lighting Research and Technology, v. 32, no. 4, 2000, pp.
175-186
www.nrc.ca/irc/ircpubs
D
AYLIGHTA
VAILABILITY INT
OP-L
ITA
TRIUMS: P
REDICTION OFS
KYLIGHTT
RANSMITTANCE ANDD
AYLIGHTF
ACTORAbdelaziz Laouadi, and Morad R. Atif
Indoor Environment Research Program, Institute for Research in Construction National Research Council Canada
Montreal Road, Ottawa, Ontario, Canada, K1A 0R6 Fax: +1 613 954 3733; Tel: +1 613 990 6868 Email: aziz.laouadi@nrc.ca; morad.atif@nrc.ca
ABSTRACT
Atrium and skylight shapes are important architectural design elements. Atrium and skylight shapes influence daylight availability within the space and, therefore, lighting energy consumption. There is a lack of prediction models for skylight transmittance and daylight availability in atriums. A new concept was developed to predict the diffuse transmittance of skylights. A skylight shape is converted into a representative shape through a shape parameter. Generic formulae for the skylight diffuse transmittance were developed under different sky conditions. A zonal model combined with the flux transfer method was developed to predict daylight availability in top-lit atriums through the prediction of the average Daylight Factor at the atrium floor and ceiling (non-glazed portion of the roof), and the local DF normal to walls. The developed DF model was compared with currently available models derived from theory and experiments under artificial skies. The results showed that the computed diffuse transmittance for translucent skylights under real pertly-cloudy or clear skies may reach up to 33% in summer and 56% in winter higher than that under CIE overcast skies. The developed zonal model yielded very close results to the models based on the finite-element method. However, models based on physical scale measurements lack general consensus among themselves, and may produce average DF values at floor level up to 45% higher than those produced by the zonal model. Physical scale models may also yield local DF values normal to walls up to 50% lower than those predicted by the zonal model.
INTRODUCTION
Atrium forms and skylight shapes are important architectural design elements. Skylights can provide useful daylight to the indoor space. In this regard, skylights may increase the amenities and marketing values of an atrium. Atrium forms influence daylight availability in the atrium and its adjacent spaces. Predicting the skylight transmittance and quantifying the effect of the atrium form on the indoor illuminance distribution and, therefore, on the lighting energy consumption are essential for a given daylighting design.
Prediction of daylight transmittance of skylights has been so far a difficult task, due to the complexity of skylight shapes. Furthermore, daylight transmittance of skylights depends on the sky conditions and the surroundings. There are limited experimental and analytical models to predict the skylight transmittance. Navvab and Selkowitz(1) measured the effective transmittance of different skylight types under simulated sky conditions. However, their results are limited to the conditions of the experiments, and can not be generalized, or applied to real physical models. Atif et al.(2) calculated the transmittance of an atrium pyramidal skylight based on on-site horizontal illuminance measurements outside and inside the skylight. There was a significant difference between predicted and measured data. Laouadi and Atif(3,4) have recently developed a rigorous analytical model to predict the transmittance of domed skylights for direct sun and diffuse sky radiation.
Daylight availability in an atrium has been treated extensively using different techniques and models. In the Daylight Factor method, simple and complex models have been developed. Complex computer models, which employ ray-tracing or ray-tracking methods, are cumbersome and expensive to use. Simple models derived from analytical techniques and experiments under artificial skies lack general consensus, and have limited applicability. Aizlewood(5) conducted an extensive literature review on the daylighting of atriums. This review concluded that there appeared no single paper bringing together the wide range of the illuminance prediction models in atriums. Wright and Letherman(6) have recently compiled and compared the numerous illuminance prediction models in top-lit atriums. The authors revealed inconsistencies and inaccuracies in some of the currently available illuminance prediction models.
The aim of this paper is to fill in the gap in predicting daylight availability in top-lit atriums, and to assess available illuminance prediction models. The paper focuses on the skylight
shape and the atrium form as two major components to predict daylight availability in atriums.
OBJECTIVES
The specific objectives of this paper are:
• To develop an analytical model to predict the diffuse transmittance of skylights under different sky conditions.
• To develop an analytical model to evaluate daylight availability in top-lit atriums through the prediction of the average Daylight Factor (DF) at the atrium floor and ceiling, and the local DF normal to walls.
• To compare the developed DF model with the currently available models. MATHEMATICAL FORMULATION
The Daylight Factor method has been used extensively almost as an approach to predict the relative indoor illuminance from daylighting in atriums. The Daylight Factor method was originally developed for a diffuse daylight from the sky, excluding direct sunlight. The diffuse light from the sky depends on the sky condition, e.g., overcast, partly overcast or clear. Different models have accordingly been proposed to describe standard and real skies. While standard sky models are independent of location, real sky models depend on the weather and climate of a given location (7)
. Sky conditions have a significant impact on the transmittance of skylights, and consequently, on the daylight availability in an atrium. In this study, three types of skies were considered to evaluate the diffuse transmittance of skylights and the average Daylight Factor at the work plane:
1. Isotropic standard overcast skies; 2. CIE standard overcast skies; and
3. Climate-based real skies, which may be overcast, partly-cloudy, or clear. This type is described by the model of Perez et al.(8)
The average Daylight Factor at the work plane is the ratio of the average indoor illuminance measured at the work plane to the outdoor horizontal illuminance(7)
. The average Daylight Factor may also be expressed in terms of the light fluxes impinging on the work plane and the outdoor horizontal plane. The average Daylight Factor at a work plane is expressed as follows:
h p p h dh p p
q
q
A
A
100
E
E
100
DF
=
=
⋅
(1)where:
Ah : area of the horizontally-projected surface of the skylight (m 2
); Ap : area of the work plane surface (m
2
);
DFp : average Daylight Factor at the work plane (%);
Edh : outdoor horizontal diffuse illuminance (lux);
Ep : average illuminance on the work plane (lux);
qh : light flux incident on the horizontally-projected surface of the skylight (lumen);
and
qp : light flux incident on the work plane (lumen).
The light flux incident on the work plane qp originates from the transmitted flux through the
skylight qt. It depends on the skylight shape, the work plane position, the atrium
geometry, and the atrium interior surface reflectances. The light flux at the work plane qp
may be expressed as follows: t p p
CU
q
q
=
⋅
(2)where:
CUp : coefficient analogous to the Coefficient of Utilization used in the lumen method (9)
(dimensionless); and
qt : transmitted flux through the skylight that reaches the skylight base surface
(lumen).
The notion of the equivalent transmittance is now introduced to predict the transmitted flux qt
(3,4)
. For calculation purposes, the skylight is “replaced” by an optically-equivalent horizontal skylight, which has a surface area equal to the horizontally-projected area of the skylight. This simplifies calculation procedures of complex skylight shapes. The equivalent transmittance for diffuse light, τeq, would be the ratio of the transmitted flux (qt)
to the incident flux on the optically-equivalent horizontal skylight (qh). The average
Daylight Factor at the work plane reads:
p eq p h p
CU
A
A
100
DF
=
⋅
τ
⋅
(3)The DF is cast into a different way from the basic formulation of the DF for top-lighting. The DF for top-lighting is evaluated in terms of three separate components: the sky component (SC), the externally-reflected component (ERC), and the internally-reflected component (IRC)(10)
. The basic formulation of the DF may lead to inaccurate results for the following reasons:
1. Calculation of the sky component SC is restricted to transparent, flat skylights. For translucent skylights, calculation of the SC is invalid since the light source (sky) is not directly seen from the point of reference on a given surface. Furthermore, for
transparent, non-flat skylights, calculation of the SC may not be accurate since it does not take into account the inter-reflected component of the sky luminance by the skylight interior surface.
2. The IRC component is calculated independently of the position of the work plane. IRC at floor level is different from that at walls, or ceiling, especially for shallow or tall atriums.
3. The skylight transmittance is assumed constant for the SC and ERC, and independent of the sky conditions and the skylight shape.
However, equation (3) combines the transmittances for the SC and ERC, and the three components (SC, ERC, IRC) in one equivalent transmittance τeq and one Coefficient of
Utilization CUp, respectively. The equivalent transmittance depends on the skylight
shape, sky conditions and surrounding reflectance. The Coefficient of Utilization depends on the atrium geometry, the work plane position, and the interior surface reflectances. It can also be demonstrated that the Coefficient of Utilization is analogous to the Well Efficiency index (WE). By definition, the WE is the ratio of the light flux reaching the base of the well to the incoming flux. The WE is expressed as follows:
well t well
CU
q
q
WE
=
=
(4) where:qwell : the light flux reaching the base of the well; and
CUwell : the Coefficient of Utilization evaluated at the base of the well.
By virtue of equations (3) and (4), the equivalent diffuse transmittance τeq of the skylight and the Coefficient of Utilization CU for the space under the skylight are essential parameters for the prediction of the Daylight Factor and the Well Efficiency index. In the following, a model is developed to compute each of them for top-lit atriums.
Prediction of the Equivalent Diffuse Transmittance of Skylights
Atrium skylights receive direct light from the sky and reflected light from the ground or surrounding buildings. The equivalent diffuse transmittance for the combined sky and ground/surrounding-reflected diffuse light is given by the following equation(3):
d d d eq
F
F
ε
ρ
τ
τ
⋅
−
=
11 121
(5) where:F11 : the view factor of the skylight surface to itself (dimensionless);
εd : the ratio of the incident flux on the skylight surface to that incident on the
optically-equivalent horizontal surface (dimensionless);
τd : the diffuse visible transmittance of a flat glazing for the combined
ground-reflected and sky light (decimals); and
ρd : the diffuse visible reflectance of a flat glazing (decimals).
Equation (5) is based on two main assumptions:
1. The incident luminous flux on any point on the skylight surface is diffusely transmitted to all directions. Equation (5), therefore, holds for translucent glazing (perfect diffusers), independently of the light source whether it is diffuse (uniform or not), or direct (from the sun).
2. The diffuse transmittance τd of an inclined flat surface does not depend on the
inclination angle. The diffuse transmittance τd may thus be equal to that of a flat
horizontal surface under a given sky condition (i.e., there corresponds a different diffuse transmittance for uniform and non-uniform sky conditions). If it is not the case, the diffuse transmittance τd can be regarded as the average over all inclination angles under a given sky condition.
The skylight view factors F12 and F11, and the incident flux ratio εd are expressed as
follows: 12 11 12
=
A
h/
A
s,
and
F
=
1
-
F
F
(6)ò
=
s A dh dt h dds
E
E
A
1
ε
(7) where:As : area of the skylight surface (m 2
);
ds : area of an elementary surface of the skylight (m2
); and Edt : outdoor diffuse illuminance on a tilted surface (lux).
The outdoor diffuse illuminance on a tilted surface Edt is the sum of the direct illuminance
from the sky and the reflected illuminance from the ground/surroundings(7)
:
2
/
)
cos
1
(
β
ρ
−
+
=
dts g gh dtE
E
E
(8) where:Edts : outdoor illuminance from the sky on a tilted surface (lux); β : surface slope (radians); and
Light reflection from adjacent buildings, or obstructions is treated in a similar way as reflection from the ground with an appropriate value of ρg
(11)
. Lee(12)
found that ρg = 0 .2
holds well for relatively small sizes of obstructions.
The illuminance from the sky on a tilted surface may be expressed in terms of the horizontal diffuse illuminance as follows:
dh
dts
c
E
E
=
⋅
(9)where c is the tilt factor, which depends on the surface slope and the sky condition. The tilt factor may be given as follows.
For an isotropic diffuse sky(7)
:
)/2
cos
1
(
+
β
=
c
(10 )For a CIE standard overcast sky(13,14)
:
{
β
π
β
β
}
π
β
sin
(
)
cos
7
4
)
cos
(1
14
3
−
+
+
+
=
c
(11)For an anisotropic diffuse sky(8)
:
sin
/
2
/
)
cos
1
)(
1
(
F
1β
F
1A
B
F
2β
c
=
−
+
+
+
(12)where F1 and F2 are coefficients for the circumsolar and horizon brightness, respectively.
The terms A and B are given as follows:
)
cos
,
087
.
0
max(
B
and
);
cos
,
0
max(
zA
=
θ
=
θ
(13)with θ the incidence angle on a tilted surface and θz the sun zenith angle.
The model of Perez et al.(8)
describes real sky conditions as a superposition of three components: circumsolar, horizon brightening and a background isotropic sky. The sky conditions may range from overcast through partly-cloudy to clear skies, depending on the weather and climate of a region. The coefficient F1 and F2 are estimated from weather
data. For isotropic overcast skies, the coefficients F1 and F2 are equal to zero. For
overcast skies, the coefficient F1 tends to zero.
The incident flux ratio εd, equation (7), may be calculated by performing a direct evaluation of the double integral over a given skylight shape. However, this direct evaluation is not straightforward for complex skylight shapes. A concept has been developed to perform the integration over a representative shape. The skylight shape is converted to the representative shape through a shape parameter. The representative shape may be
chosen arbitrarily, provided that the shape parameter is known and that the integration in equation (7) is easy to perform.
A dome shape is considered as the representative shape, and the shape parameter is the truncation angle σ0. Figure 1 illustrates the dome geometry and the truncation angle σ0.
The shape parameter for skylights other than domes is calculated as follows:
)
1
2
(
sin
1 12 0=
−
−F
σ
(14)The shape parameter σ0 has to be greater or equal to 0 (see figure 1), which corresponds
to a view factor F12 ≥ 0.5. Skylight shapes with F12 < 0.5 are not practical since they lose more daylight by inter-reflection than they transmit directly to the space.
The skylight transmittance, equation (5), is now evaluated through the flux ratio εd
(equation 7) for the representative shape under different sky conditions. For isotropic overcast skies, equation (7) reduces to:
)/2
1
/
1
(
)/2
1
/
1
(
12−
+
12+
=
gF
F
dρ
ε
(15)For CIE overcast skies, equation (7) reduces to(14):
)
28
/(
}
2
sin
3
/
1
sin
18
/
)
8
7
(
sin
3
/
9
/
2
18
/
19
{
9
)/2
1
/
1
(
11 12 0 0 2 0 0 0 12F
F
F
g dπ
σ
σ
σ
π
σ
π
σ
π
ρ
ε
⋅
−
⋅
+
−
⋅
−
⋅
−
+
−
=
(16)For anisotropic skies, equation (7) reduces to:
{
/
2
cos
sin
}
/(
4
F
F
)
F
D
/B
F
2
/
)
1
F
/
1
)(
F
1
(
)
1
F
/
1
(
E
2
E
1 11 12 0 0 0 2 12 1 12 dh gh g d⋅
+
σ
σ
−
σ
−
π
+
+
−
+
−
ρ
=
ε
(17)where D is given by the following equation:
{
1sin
2cos
} {
/
4
12 11}
cos
4
/
3
G
G
F
F
D
=
⋅
θ
z+
θ
z+
θ
zπ
(18) with: 0 0 2 01
=
(
π
/2
-
ϕ
)sin
σ
−
sin
σ
cos
ϕ
G
(19)(
2)
2 0 2 -1 11 12 2 02
=
(
ϕ
-
π
/2)cos
σ
−
2F
F
sin
1
−
2
tan
σ
/
tan
σ
G
(20 ))
-,
-min(
and
);
sin
/
(sin
sin
-1 0 2 2 0 z 0σ
σ
σ
π
σ
π
θ
ϕ
=
=
(21)The outdoor horizontal global and diffuse illuminances (Egh, Edh) in equation (17) may be
estimated from irradiance values using the model of Perez et al.(8)
The comparison between the exact values of the equivalent transmittance obtained using the direct evaluation of the incident flux ratio εd (equation 7) for different skylight shapes (dome, pyramid, vault, and pitched) and those obtained using the representative shape
showed that equation (15) for uniform overcast skies and equation (16) for CIE overcast skies apply to any kind of skylights without any restriction. For anisotropic skies, the maximum error in evaluating the equivalent transmittance using the representative shape is usually within ±3% at very low sun altitudes.
Prediction of the Coefficient of Utilization
A zonal model combined with the flux transfer method has been developed to compute the Coefficient of Utilization and therefore the average Daylight Factor at the floor and ceiling (non-glazed portion of the roof), and the local DF normal to the walls of top-lit atriums. The space under the skylight is split into a number of zones (n), separated by fictitious horizontal planes (floors). This zonal model is particularly important to account for the variability of the wall reflectance and illuminance along the height. The zonal method also allows for handling different sizes and geometries of the space below the skylight (e.g., skylight curb/well and indoor space). Figure A-1 shows a schematic description of a top-lit atrium and the position where the Daylight Factor is computed for the indoor space.
The inherent assumption in the zonal model is that the atrium interior surfaces are perfect diffusers. The skylight is also assumed a perfectly-diffusing luminous source. This limitation applies to the case where the skylight material is translucent. Sky conditions will affect the skylight transmittance, but will not influence the flux distribution within the atrium since the direct luminous source (sky) is not directly seen from the point of reference on a given surface. Different sky conditions (overcast, partly cloudy and clear) may therefore be simulated. This case renders inaccurate any calculations of the direct component of the DF based on the sky luminance that hits the surface under consideration.
Details of the model development are presented in the Appendix.
The Coefficients of Utilization at floor, walls and ceiling are expressed as follows:
∏
= ==
⋅⋅
⋅
⋅
=
i n 1 i i, f n , f 2 , f 1 , f fC
C
C
C
CU
(22)∏
= + = +⋅
⋅⋅
=
⋅
=
j n 1 i j j , f i, w n , f 1 i, f i, w i, wC
C
C
C
C
CU
(23) c cC
CU
=
(24)where the index i indicates a zone number and the coefficients Cf,i, Cw,i and Cc are given
by the equations (A-7) to (A-9), (A-15) and (A-16).
Equations (22) to (24) are valid as long as the zonal method applies. The implicit assumption in the zonal method is that the fictitious plane, which separates two real surfaces, would emit the same amount of light energy to the real surface on one side as it receives from the real surface on the other side. For two real surfaces (A and B) separated by n fictitious planes, this implicit assumption is translated into the following expression: B , A A B , n n , 1 n i, 1 i 2 , 1 1 , A A B , A
q
F
F
F
F
F
q
F
q
=
⋅⋅
−⋅⋅
−=
(25) where:Fi-1,i : view factor of plane i-1 to plane i;
qA : flux emitted by the surface A; and
qA,B : flux originating from surface A which is received by surface B.
Equation (25) reduces to the following condition for the validity of the zonal method: B , A B , n n , 1 n i, 1 i 2 , 1 1 , A
F
F
F
F
F
F
⋅⋅
−⋅⋅
−=
(26)Equation (26) stipulates that the zonal method may result in acceptable accuracy for shallow spaces where the view factors Fi-1,i and FA,B are around unity. Consequently, equations (22) to (24) are valid for low values of the well index (WI < 1). For tall spaces, the zonal method will underpredict the DF at floor level due to light loss, and overpredict the DF normal to walls due to light gain. However, the overprediction of the DF normal to walls may not be significant since the light gain received by the walls at different levels, which compensates the light loss at floor level, is apportioned by the number of zones. Based on this fact, a remedy to the zonal method is to compute the DF at ceiling and normal to walls using the zonal method, i.e., equations (23) and (24), and to compute the DF at floor level using the direct method that does not make use of fictitious planes. A flux balance at floor level may be written as follows:
å
= =ρ
+
ρ
+
+
=
i n 1 i f , wi i, w i, w cf c c f 2 r t f(
q
q
)
F
q
F
q
F
q
(27) where:F2f : view factor of skylight base surface to floor; Fcf : view factor of ceiling to floor;
Fwi,f : view factor of walls of zone i to floor; qc : flux impinging on ceiling;
qf : flux impinging on floor;
qr : flux reflected from the skylight interior surface to the indoor space;
qt : transmitted flux that reaches the skylight base surface;
ρc : reflectance of ceiling; and
ρw,i : reflectance of walls of zone i.
Using the reciprocity and summation properties of the view factor, one obtains the following simplified form of equation (27):
å
= =−
⋅
ρ
+
ρ
+
+
=
i n 1 i ci , f fi , f i, w f i, w i, w cf c c f 2 r t f(
q
q
)
F
q
F
q
A
/
A
(
F
F
)
q
(28) where:Ff,fi : view factor of floor to floor of zone i; and
Ff,ci : view factor of floor to ceiling of zone i.
Making use of equations (23), (24) and (A-10), the modified Coefficient of Utilization at floor level is expressed as follows:
å
= =−
⋅
ρ
+
ρ
+
+
=
′
i n 1 i ci , f fi , f i, w f i, w i, w cf c c f 2 r f(
1
C
)
F
CU
F
CU
A
/
A
(
F
F
)
U
C
(29)The average DF at floor, ceiling, and the local DF normal to walls reads: f eq f h f
100
A
/
A
C
U
DF
=
⋅
⋅
τ
⋅
′
(30 ) c eq c h c100
A
/
A
CU
DF
=
⋅
⋅
τ
⋅
(31) i, w eq i, w h i, w100
A
/
A
CU
DF
=
⋅
⋅
τ
⋅
(32)The average Daylight Factor at all walls may be expressed as follows:
å
= =⋅
=
i n 1 i i, w w i, w wA
/
A
DF
DF
(33) where:Ac : surface area of the ceiling (m 2
); Af : surface area of the floor (m
2
); Aw : surface area of all walls (m
2
); and Aw,i : surface area of the walls of zone i (m2
). Comparison of DF Prediction Models
The Daylight Factor model developed in this study is compared with the following prediction models.
Phillips and Littlefair(15) developed an analytical model to compute the average DF of an open atrium, given by:
)
1
/(
)
A
/
A
(
K
2
DF
2 a t h a=
−
ρ
(34) where:K : a constant that depends on the skylight geometry (dimensionless); At : total area of all atrium surfaces (m2
); and
ρa : average reflectance of all atrium surfaces (decimals).
For flat horizontal skylights, the value of K is equal to 88. Kim and Boyer(16)
used physical scale models to compute the DF at the center of floor and walls of square, rectangular and linear atriums. The reflectance of the walls was fixed at 0.3 and the floor at 0.1. The DF at the center of floor of an open atrium was correlated as follows: WI 996 . 0 cf
117
e
DF
=
− (35)The DF at the center of walls for a square open atrium was correlated as follows: WI 996 . 0 cw
44
e
DF
=
− (36)where WI is the well index, expressed by:
LW
2
/
)
W
L
(
H
WI
=
+
(37)with H the atrium height, L the atrium length and W the atrium width. Liu et al.(17)
used computer simulation to derive a polynomial regression formula for the DF at the center of floor as a function of the well index for a square, enclosed, open atrium. However, Liu et al.(17)
did not mention any detail of the method and its assumption used for the computer simulation. The reflectance of walls and floor was fixed at 0.45 and 0.2, respectively. The DF is given by:
5 4 3 2 cf
WI
1267
.
0
WI
3934
.
2
WI
61
.
17
WI
203
.
64
WI
09
.
121
56
.
103
DF
−
+
−
+
−
=
(38) Neal and Sharples(18)used physical scale models to predict the DF as a function of the atrium splay angle and well index. The floor and wall reflectance was fixed at 0.3 and 0.5, respectively. For a square atrium, their three-point data would be approximated by the following equation(5) : WI 73 . 0 cf
84
e
DF
=
− (39)Tregenza(19) developed analytical models for the average illuminance on the floor and normal to walls of top-lit atriums based on an exponential decay law. The average DF at the floor and normal to walls are expressed as follows:
{
(
2
)
e
}
/
{
2
(
1
)
}
DF
kWI cav f cav cav eq f=
τ
α
−
ρ
+
ρ
α
−
ρ
ρ
⋅ ⋅ α − (40 )4
/
)
1
(
cav f wDF
k
DF
=
⋅
+
ρ
(41) where:k : the attenuation coefficient (dimensionless);
α : the fraction of light incident on walls that is not reflected downwards (α = 1 – 0.5ρw) (decimals); and
ρcav : the cavity reflectance above the floor (decimals).
The attenuation coefficient is given by the following equation:
)
8
/
WI
1
(
)
E
/
E
(
4
k
=
v0 h0⋅
−
(42) with:Eh0 : initial horizontal illuminance at the top of the atrium (lux); and
Ev0 : initial vertical illuminance at the top of the atrium (lux).
For isotropic overcast skies, the ratio Ev0/Eh0 = 0.5, and for CIE standard overcast skies,
Ev0/Eh0 = 0.4. Equation (42) was derived assuming an enclosure with black floor and walls
(ρf = ρw = 0).
In case the atrium is glazed, the above DF relations, equations (34) to (36), (38) and (39), are multiplied by the equivalent transmittance of the skylight τeq.
RESULTS AND DISCUSSION
Equivalent Diffuse Transmittance
The developed model for the equivalent diffuse transmittance is evaluated for a number of skylight shapes under a uniform overcast sky, CIE overcast sky and real clear/partly-cloudy sky. The skylight shapes covered domes, square pyramids, and vault and pitched skylights. The ground/surrounding visible reflectance is fixed at ρg = 0.2.
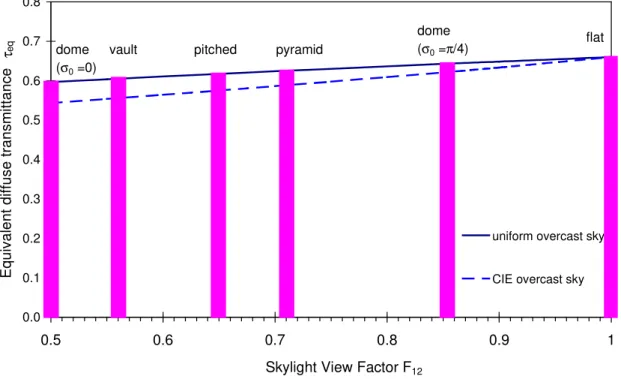
Figure 2 shows the profile of the equivalent diffuse transmittance of translucent skylights as a function of the skylight view factor F12 under uniform and CIE overcast skies. The
diffuse transmittance and reflectance of the flat sheet are fixed at τd = 0.66 and ρd = 0.23,
respectively. The equivalent diffuse transmittance increases with the skylight view factor F12. This trend is due to the fact that skylights with lower values of F12 loose more light by
non-flat skylights is lower than that of flat skylights by up to 9% under uniform overcast sky conditions, and by up to 18% under CIE overcast sky conditions. Skylights transmit about 10% less daylight under CIE overcast skies than they do under uniform overcast skies. Hemispherical domes (σ0=0) have the lowest equivalent diffuse transmittance,
followed by linear vault skylights (W/L=1/4), linear 45°-pitched skylights (W/L=1/4), square pyramids and low-profile domes (σ0=π/4). For almost-planar skylights, as expected, sky
conditions have no significant impact on the equivalent diffuse transmittance.
Figures 3 and 4 show the profile of the equivalent diffuse transmittance of translucent skylights under real sky conditions on typical days in summer (June 24th
) and winter (December 24th
) seasons, respectively. The climate data corresponds to the city of Ottawa (latitude 45o
), Canada. The ratio of the global-to-diffuse horizontal illuminance (Egh/Edh) is also plotted to indicate the variation of the sky conditions during the day. On
the 24th
of June, the sky conditions varied from clear in the morning and early afternoon through partly-cloudy to overcast in the late afternoon. On the 24th
of December, the sky conditions were clear.
Under clear or partly-cloudy skies in summer, the equivalent diffuse transmittance may reach up to 33% higher than that under CIE overcast skies and up to 9% higher than that of flat skylights. Under overcast skies (Egh/Edh ≈ 1), the equivalent diffuse transmittance approaches that under CIE overcast skies. The shape of the skylight does not produce significant difference in the equivalent diffuse transmittance, although hemispherical domes yield the lowest equivalent diffuse transmittance, followed by linear vault skylights, linear 45°-pitched skylights and pyramids. This is due to the fact that in summer the sun altitude is so high around noontime (incidence angle θz = 22°) so that the transmittance for
the circumsolar diffuse light is slightly lower than that of flat skylights. Noteworthy is that the lower the parameter σ0, the slightly lower the equivalent diffuse transmittance.
However, under clear skies in winter, the equivalent diffuse transmittance may reach up to 56% higher than that under CIE overcast skies and up to 27% higher than that of flat skylights, particularly for hemispherical domes. The shape of the skylight has a significant impact on the equivalent diffuse transmittance. Hemispherical domes yield the highest equivalent diffuse transmittance, followed by linear vault skylights, linear 45°-pitched skylights and pyramids. This is due to the fact that skylights capture more circumsolar
light at low sun altitudes in winter (incidence angle at noontime θz = 68°) and therefore the
transmittance for the circumsolar diffuse light is much higher than that of flat skylights. As a consequence of the lower sun altitudes, the equivalent diffuse transmittance in winter may reach up to 17% higher than that under clear skies in summer, particularly for domes. Noteworthy is that the lower the parameter σ0, the higher the equivalent diffuse transmittance.
Comparison of DF Prediction Models
The developed zonal model is evaluated through to the prediction of the Daylight Factor and Well Efficiency of a square atrium with 100% glazed roof and flat skylight. The DF and WE are plotted as a function of the well index (WI). The impact of the well index on the DF and WE using the developed model is similar to that found in previous studies by Liu et al.(17)
The well index is found to represent the atrium shape. In other words, varying the atrium width, length, height, or skylight-to-roof surface area ratio while keeping the well index the same will not significantly alter the DF at floor, ceiling and normal to walls.
Table 1 shows a comparison between the DF at floor level predicted using equations (22) and (29). The skylight transmittance and reflectance are fixed at τeq = 0.66 and ρs = 0.23,
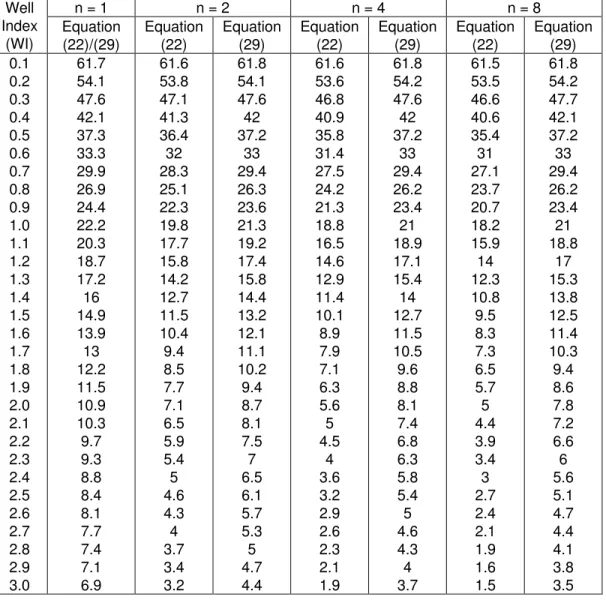
respectively. The wall reflectance is fixed at ρw = 0.50 and the floor reflectance at ρf = 0.30. As expected using a multi-zone model, equation (22) underpredicts the DF at floor level by up to 13% for shallow atriums (WI < 1) and by more than 57% for tall atriums (WI > 1) as compared with equation (29). For shallow atriums, a one-zone model is sufficient to yield accurate results within 6% uncertainty. However, for tall atriums, a multi-zone model should be used. For a uniform wall reflectance, a four-zone model is found to yield accurate results within 6% uncertainty as compared with an eight-zone model.
Table 2 shows a comparison of the Well Efficiency (WE) as predicted by the developed model (equation 29), and by Boubekri and Anninos(20)
, Serres and Murdoch(21)
and IESNA(9)
. Boubekri and Anninos(20)
used an accurate approach based on the finite element method. Serres and Murdoch(21)
used a three-surface enclosure model similar to the one-zone model. The results obtained using a four-one-zone model yields accurate result within 3% uncertainty as compared to the finite element predictions(20)
. Results by Serres and Murdoch(21)
are identical to that from the one-zone model and, therefore, are valid for shallow atriums. For tall atriums, the model of Serres and Murdoch(21)
WE by more than 28% as compared to the developed model. The model of IESNA(9) also overpredicts the WE by about 8% for shallow atriums and by more than 20% for tall atriums, as compared to the developed model.
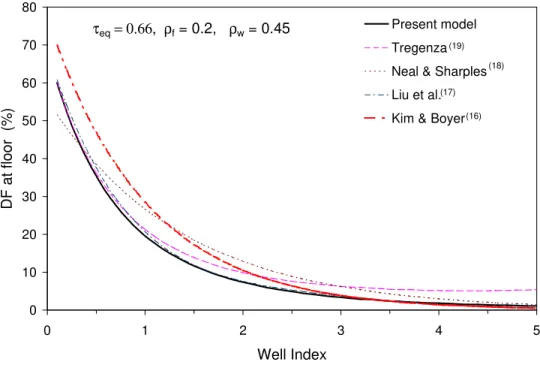
Figure 5 shows a comparison of DF models at floor level under isotropic overcast skies. The developed model uses four zones and equation (29). The floor and wall reflectances are fixed at 0.2 and 0.45, respectively. Predictions of the developed model are in excellent agreement with those obtained by computer simulation(17). The developed model yields average DF values very close to the local DF values at center of floor predicted by the model of Liu et al.(17) This indicates that the illuminance at floor level does not change significantly across the floor area for a 100% glazed roof, especially for tall atriums (WI > 1). The developed model also yields average DF values close to those predicted by the model of Tregenza(19), particularly for shallow atriums (WI < 1). For tall atriums, the model of Tregenza(19) overestimates the average DF by more than 25% as compared to the developed model. As a matter of fact, the model of Tregenza(19) produces approximately the same results as does the one-zone model (not shown in the figure). Models based on physical measurements in artificial skies overestimate the DF by up to 45% for atrium with WI < 3 compared to the developed model. For very tall atriums (WI > 3), physical scale models yield approximately the same results as does the developed model. This discrepancy between physical scale and analytical models is due to multiple reasons: 1. Inability of the experiment to accurately reproduce real sky conditions in a sky
simulator;
2. Physical scale models were developed for open atriums; therefore, they do not account for light reflection from the skylight interior surface, which can not be neglected for shallow atriums (WI < 1);
3. Physical scale models were not validated with field measurements to account for the scaling effects; Kim and Boyer(16) found a strong dependency between physical scale and field measurements; and
4. Difficulty to simulate perfectly-diffuse surfaces in physical scale models.
Figure 6 shows comparison of DF models normal to walls under isotropic overcast skies. The floor and wall reflectances are fixed at 0.1 and 0.3, respectively. The developed model uses five zones and equation (29). The figure illustrates the average DF normal to walls and the local DF at level 1 (near the floor), level 3 (center) and level 5 (near ceiling).
The DF varies significantly along the wall height. The difference between the DF at level 5 and level 1 may reach up to 23%, particularly for tall atriums. The local DF at the center of walls (level 3) is significantly lower than the average DF normal to walls, particularly for tall atriums. This indicates that the variation of the DF along the walls is not linear and, therefore, measurements conducted at the center of walls may not be regarded as average values. The average DF normal to walls as computed by the present model is very close to that computed by the model of Phillips and Littelfair(15) with a constant K=75, except for very shallow atriums (WI < 0.5). Higher values of K may result in higher DF, reaching up 49% for very shallow atriums, than those predicted by the developed model. This expected difference is due to the fact that the model of Phillips and Littelfair(15) predicts the average DF of all atrium surfaces rather than normal to walls. For tall atriums, this difference vanishes because the floor surface area becomes very small with respect to the walls surface area. The model of Tregenza(19) yields average DF values close to those computed at the lower walls (level 1). The model of Tregenza(19) underestimates the average DF by more than 100% for shallow and tall atriums as compared to the developed model. This difference is due to the fact that in the model of Tregenza(19), the vertical illuminance is deduced from the horizontal illuminance at a given height using constant parameters. Furthermore, the equations for the average vertical and horizontal illuminances do not satisfy the conservation of light flux, which stipulates that the net incoming flux is absorbed by the atrium floor and walls. The model of Kim and Boyer(16) (center of walls) also yields DF values close to those computed at the lower walls (level 1) and underestimates the local DF at center of walls by up to 50%, particularly for atriums with WI < 3 as compared to the developed model. The reasons of this discrepancy are similar to those mentioned in the prediction of the DF at the floor level.
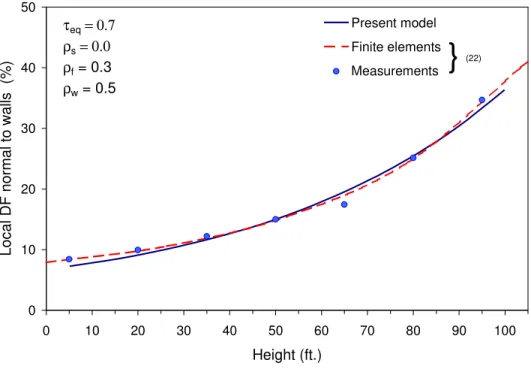
Figure 7 shows a comparison between the results for the local DF normal to walls from the present model and those from the finite element method and scale-model measurements (22) under isotropic overcast skies. The sample atrium has the dimensions: L = 131.25 ft (40 m), W = 52.5 ft (16 m), and H = 105 ft (32 m), giving a well index WI = 1.4. The skylight has a zero reflectance and a transmittance τeq = 0.7. The floor and wall
reflectances are fixed at 0.3 and 0.5, respectively. The variation of the local DF along the walls is not linear. The predictions from the present model compare very well with those from the finite element method and scale-model measurements with a maximum
CONCLUSION
A new concept was developed to predict the diffuse transmittance of skylights. The skylight shape is converted into a representative shape through a shape parameter. Generic formulae for the skylight equivalent diffuse transmittance were developed under different sky conditions. Under CIE overcast sky conditions, the equivalent diffuse transmittance of translucent skylights is about 10% lower than that under uniform overcast sky conditions. Under clear/partly-cloudy sky conditions in summer, the equivalent diffuse transmittance of translucent skylights is about 33% higher than that under CIE overcast sky conditions. Under clear sky conditions in winter, the equivalent diffuse transmittance is about 57% higher than that under CIE overcast sky conditions.
A zonal model combined with the flux transfer method was developed to predict the average DF at the atrium floor and ceiling (non-glazed portion of the roof), and the local DF normal walls. The zonal model allows for handling different sizes and geometries of the space under the skylight (e.g., skylight curb/well, and indoor space). The model was extensively compared with currently available models derived from theory and experiments under artificial skies. The developed zonal model, as compared with those based on finite element methods, produced accurate values of the WE and DF with a maximum uncertainty of 13%. However, physical scale models lack general consensus among themselves, and may produce average DF values at floor level up to 45% higher than those produced by the zonal model. Physical scale models may also yield local DF values normal to walls up to 50% lower than those predicted by the zonal model.
APPENDIX
Computation of the Coefficient of Utilization
A zonal model combined with the flux transfer method has been developed to compute the Coefficients of Utilization (CU) at floor, ceiling (non-glazed portion of the roof) and normal to walls at different levels. The space under the skylight is split into a number of zones separated by fictitious horizontal planes. The zone surfaces are assumed perfect diffusers. The zonal model is particularly important to account for the variation of illuminance and wall reflectance along the atrium height. The zonal model also allows for handling different sizes and geometries of the space under the skylight (e.g., skylight curb/well and indoor space). Figure A-1 shows a schematic description of a top-lit atrium and the positions where the Coefficients of Utilization are calculated.
The light fluxes impinging on the floor, walls and ceiling of each zone are calculated as follows: Uppermost zone- n: n , cf c c n , wf n , w n , w n , f 2 r t n , f
(
q
q
)
F
q
F
q
F
q
=
+
+
ρ
+
ρ
(A- 1) n , cw c c n , fw n , f n , f n , ww n , w n , w n , w 2 r t n , w(
q
q
)
F
q
F
q
F
q
F
q
=
+
+
ρ
+
ρ
+
ρ
(A- 2) n , fc n , f n , f n , wc n , w n , w cq
F
q
F
q
=
ρ
+
ρ
(A- 3))
F
q
F
q
(
q
r=
ρ
sρ
w,n w,n w2,n+
ρ
f,n f,n f2,n (A- 4) where:F2f,n : view factor of the skylight base surface to floor of zone n;
F2w,n : view factor of the skylight base surface to walls of zone n;
Ffc,n : view factor of floor to ceiling of zone n;
Ffw,n : view factor of floor to walls of zone n;
Fwc,n : view factor of walls to ceiling of zone n;
Fww,n : view factor of walls of zone n to themselves;
qc : flux impinging on ceiling (lumen);
qf,n : flux impinging on floor of zone n (lumen);
qr : reflected flux from the skylight interior surface that reaches its base surface
(lumen);
qt : transmitted flux through the skylight that reaches its base surface (lumen);
qw,n : flux impinging on walls of zone n (lumen); ρc : reflectance of ceiling;
ρf,n : reflectance of floor of zone n;
ρw,n : reflectance of walls of zone n.
Substituting qc and qr from equations (A-3) and (A-4) in equations (A-1) and (A-2), one
obtains:
[
]
[
wf,,n s 2f,n w2,n c cf,n wc,n]
w,n 2f,n t n , w n , f n , fc n , cf c n , f n , 2 f n , f 2 n , f sq
F
q
F
F
F
F
F
q
F
F
F
F
1
=
ρ
+
ρ
+
ρ
ρ
ρ
−
ρ
ρ
−
(A- 5)[
]
[
s w,n 2w,n w2,n w,n c cw,n wc,n w,n ww,n]
w,n 2w,n t n , f n , fc n , cw c n , 2 f n , w 2 s n , fw n , fq
F
q
F
F
F
F
F
1
q
F
F
F
F
F
=
ρ
−
ρ
ρ
−
ρ
ρ
−
+
ρ
+
ρ
+
ρ
−
( A- 6)Solving for qf,n and qw,n from equations (A-5) and (A-6), one obtains the following
coefficients: n n , f 2 n , cf n , wc c n , w n , wf n , w 2 n , ww n , f 2 n , w n , f 2 t n f, n f,
/
)
F
F
(
F
)
F
F
F
F
(
F
q
/
q
C
∆
þ
ý
ü
î
í
ì
−
ρ
ρ
+
−
ρ
−
=
=
(A- 7){
2w,n f,n 2f,n fw,n f,n c fc,n cf,n 2f,n}
n t n w, n w,q
/
q
F
F
F
F
(
F
F
)
/
C
=
=
+
ρ
−
ρ
ρ
−
∆
(A- 8) n , f n , fc n , f n , w n , wc n , w t c cq
/
q
F
C
F
C
C
=
=
ρ
+
ρ
(A- 9))
C
F
C
F
(
q
/
q
C
r=
r t=
ρ
sρ
w,n w2,n w,n+
ρ
f,n f2,n f,n (A-10) where ∆n is given by the following equation:[
]
[
]
[
wf,,n s 2f,n w2,n c cf,n wc,n] [
fw,n s 2w,n f2,n c cw,n fc,n]
n , w n , f n , wc n , cw c n , w n , 2 w n , w 2 n , w s n , ww n , w n , fc n , cf c n , f n , 2 f n , f 2 n , f s nF
F
F
F
F
F
F
F
F
F
F
F
F
F
F
1
F
F
F
F
1
ρ
+
ρ
+
⋅
ρ
+
ρ
+
ρ
ρ
−
ρ
ρ
−
ρ
ρ
−
ρ
−
⋅
ρ
ρ
−
ρ
ρ
−
=
∆
(A- 11) Intermediate zone- i:The fluxes impinging on the ceiling, floor, and walls are expressed as follows: i, w i, wf i, w 1 i, f i, cf i, f
F
q
F
q
q
=
++
ρ
(A- 12) i, f i, fw i, f i, w i, ww i, w 1 i, f i, cw i, wF
q
F
q
F
q
q
=
++
ρ
+
ρ
(A- 13) i, f i, fc i, f i, w i, wc i, w i, cF
q
F
q
q
=
ρ
+
ρ
(A- 14)Solving for qf,i and qw,i from equations (A-12) and (A-13), one obtains the following coefficients:
{
cfi, wi, cfi, wwi, cwi, wfi,}
i 1 i, f i f, i f,q
/
q
F
(
F
F
F
F
)
/
C
=
+=
−
ρ
−
∆
(A- 15){
cwi, fi, cfi, fwi,}
i 1 i, f i w, i w,q
/
q
F
F
F
/
C
=
+=
+
ρ
∆
(A- 16)where ∆i is given by the following equation:
i, wf i, fw i, w i, f i, ww i, w i
=
1
−
ρ
F
−
ρ
ρ
F
F
∆
(A- 17)The reflectance of the fictitious floor of zone i+1 may be calculated as follows:
{
wi, wfi, fwi, fi, fci, cfi, fi, wi, fci, wfi, fci,}
i 1 i, f i c, 1 i, f=
q
/
q
=
ρ
F
F
+
ρ
F
F
+
ρ
ρ
F
(
2
F
−
F
)
/
∆
ρ
+ + (A- 18)Noting that ρf,1 = ρf, the reflectance of the fictitious planes may be obtained first by
sweeping through the number zones from i = 2 to n.
The reflectance of the interior surface of the skylight is calculated as follows(3)
: 11 12
1
F
F
d d sρ
ρ
ρ
=
−
(A- 19)All the elements needed to compute the Coefficients of Utilization are now available in the forms of the previously developed expressions. By definition, the CU at floor, walls and ceiling are expressed as follows:
t n , f n , f 1 n , f 1 n , f 2 n , f 3 , f 2 , f 2 , f 1 , f t f,1 f
q
q
q
q
q
q
q
q
q
q
q
/
q
CU
=
=
⋅
⋅
⋅⋅
⋅
−⋅
− − (A- 20 ) t n , f n , f 1 n , f 2 i, f 1 i, f 1 i, f i, w t i w, i, wq
q
q
q
q
q
q
q
q
/
q
CU
=
=
⋅
⋅
⋅⋅
−⋅
+ + + (A- 21) t c cq
/
q
CU
=
(A- 22)Taking into account equations (A-7) to (A-9) and (A-15) to (A-16), the following expressions are obtained:
∏
= ==
⋅⋅
⋅
⋅
=
i n 1 i i, f n , f 2 , f 1 , f fC
C
C
C
CU
(A- 23)∏
= + = +⋅
⋅⋅
=
⋅
=
j n 1 i j j , f i, w n , f 1 i, f i, w i, wC
C
C
C
C
CU
(A- 24) c cC
CU
=
(A- 25)ACKNOWLDGEMENTS
This work has been funded by the Institute for Research in Construction of the National Research Council Canada, and CANMET/Buildings Group of Natural Resources Canada. The authors are very grateful for their contribution.
REFERENCES
1 Navvab M, and Selkowitz S, Daylighting Data for Atrium Design. Proc. 9th
National Passive Solar Conf., Columbus, OH 495-500 (1984).
2 Atif R M, Galasiu A, MacDonald R A, and Laouadi A, On-site Monitoring of an Atrium Skylight Transmittance: Performance and Validity of the IES Transmittance Calculation Procedure for Daylighting, IESNA Transactions (Seattle) (1997).
3 Laouadi A, and Atif MR, Transparent Domed Skylights: Optical Model for Predicting Transmittance, Absorptance and Reflectance. Lighting Res. Technol., 30(3) 111-118 (1988).
4 Laouadi A, and Atif MR, Predicting Optical and Thermal Characteristics of Transparent Single-Glazed Domed Skylights: ASHRAE Transactions, Vol. 105, Part 2, 325-333 (1999).
5 Aizlewood ME, The Daylighting of Atria: A Critical Review, ASHRAE Trans., 101(2) 841-857 (1995).
6 Wright JC, and Letherman KM, Illuminance in Atria: Review of Prediction Methods, Lighting Res. Technol. 30(1) 1-11 (1997).
7 Robbins CL, Daylighting Design and Analysis. (New York: Van Nostrand Reinhold Company) (1986).
8 Perez R, Ineichen P, Seals R, Michalsky J, and Stewart R, Modeling Daylight Availability and Irradiance Components from Direct and Global Irradiance, Solar Energy 44(5) 271-289 (1990).
9 IESNA, Lighting Handbook - Reference and Application Volume, (New York: Illuminating Engineering Society of North America) (1993).
10 Hopkinson R, Petherbridge P, and Longmore J, Daylighting (London: Heinmann) (1966).
11 CIBSE, Code for Interior Lighting (London: Chartered Institution of Building Services Engineers) (1994).
12 Lee F, Insights into the Daylighting Effect of the External Obstructions, Proc. CIBSE Nat. Lighting Conf. (1992).
13 Muneer T, and Angus RC, Daylight Illuminance Models for the United Kingdom. Lighting Res. Technol. 25(3) 113-123 (1993).
14 Wilkinson MA, Natural Lighting under Translucent Domes, Lighting Res. Technology 24(3) 117-126 (1992).
15 Phillips G, and Littlefair P, Average Daylight Factor under Rooflights, Proc. CIBSE Nat. Lighting Conf. (1988).
16 Kim K, and Boyer LL, Development of Daylight Prediction Methods of Atrium Design, Proc. Int. Daylighting Conf., Long Beach, CA, 345-359 (1986).
17 Liu A, Navvab M, and Jones J, Geometric Shape Index for Daylight Distribution Variations in Atrium Spaces, Proc. Biennial Congress of International Solar Energy, Denver, CA, 2781- 2785 (1991).
18 Neal T, and Sharples S, The Influence of Well Geometry on Daylight Levels in Atria, Proc. CIBSE Nat. Lighting Conf. 342-345 (1992).
19 Tregenza PR, Daylight Attenuation in Top-Lit Atria, Lighting Res. Technol. 29(3) 151-157 (1997).
20 Boubekri M. and Anninos W., Skylight Wells: A Finite-Element Approach to Analysis of Efficiency, Lighting Res. Technol. 27(3) 153-159 (1995).
21 Serres A.W. and Murdoch J.B., On the Efficiency of Skylight Wells, J. Illum. Eng. Soc., 19(1) 73-86 (1990).
22 Boubekri M. and Anninos W., Daylighting Efficiency of an Atrium: Part 1- The four-sided Type, Architectural Science Review. 39, 75-81 (1996).
NOMENCLATURE
Ac : surface area of ceiling (m 2
) Af : surface area of floor (m
2
)
Ah : area of the skylight base surface (m 2
) Ap : area of the work plane surface (m
2
) As : area of the skylight surface (m
2
) At : total area of atrium surfaces (m
2
) Aw : surface area of all walls (m
2
) Aw,i : surface area of walls of zone i (m2
)
A, B : terms given by equation (13) (dimensionless)
C : ratio of surface flux to the incoming flux through ceiling (dimensionless) CU : Coefficient of Utilization (dimensionless)
c : surface tilt factor (dimensionless)
D : function given by equation (18) (dimensionless) DF : Daylight Factor (%)
ds : area of an elementary surface of the skylight (m2
) Edh : diffuse illuminance on a horizontal surface (lux)
Edt : diffuse illuminance on a tilted surface (lux)
Edts : diffuse illuminance from the sky on a tilted surface (lux)
Egh : global illuminance on a horizontal surface (lux)
Eh0 : initial horizontal illuminance at the top of the atrium (lux)
Ep : illuminance on the work plane (lux)
Ev0 : initial vertical illuminance at the top of the atrium (lux)
F1, F2 : circumsolar and horizon brightness coefficients (dimensionless)
F11 : view factor of the skylight surface to itself (dimensionless)
F12 : view factor of the skylight surface to its base surface (dimensionless) F2f : view factor of the skylight base surface to floor (dimensionless) F2w : view factor of the skylight base surface to the walls (dimensionless) Ffc : view factor of floor to ceiling (dimensionless)
Ffw : view factor of floor to walls (dimensionless)
Ff,fi : view factor of atrium floor to floor of zone i
Ff,ci : view factor of atrium floor to ceiling of zone i
Fwc : view factor of walls to ceiling (dimensionless)
Fwi,f : view factor of walls of zone i to the atrium floor
Fww : view factor of walls to themselves (dimensionless)
G1,G2 : functions given by equations (19) and (20) (dimensionless)
H : atrium height (m)
K : skylight constant (dimensionless)
k : attenuation coefficient given by equation (42) (dimensionless) L : atrium/skylight length (m)
n : number of zones
qh : flux incident on the horizontally-projected surface of the skylight (lumen)
qr : flux reflected from the skylight interior surface to the indoor space (lumen)
qt : transmitted flux through the skylight that reaches the skylight base surface
(lumen)
qwell : flux reaching the base of the skylight well (lumen)
W : atrium/skylight width (m) WE : well efficiency (dimensionless) WI : well index (dimensionless) Geek symbols
α : fraction of light incident on walls that is not reflected downwards (decimals) β : slope of a planar surface with respect to the horizontal (radians)
∆i : determinant given by equation (A-17) (dimensionless)
∆n : determinant given by equation (A-11) (dimensionless)
εd : incident diffuse flux ratio given by equation (7) (dimensionless)
ϕ0 : angle given by equation (21) (radians)
θ : incidence angle on a tilted surface (radians)
θz : sun zenith angle, or incidence angle on a horizontal surface (radians)
ρa : average reflectance of all atrium surfaces (decimals)
ρc : reflectance of ceiling (decimals)
ρcav : cavity reflectance above the floor (decimals)
ρd : diffuse reflectance of a flat glazing (decimals)
ρf : reflectance of floor (decimals)
ρg : ground/surroundings reflectance (decimals)
ρs : reflectance of the interior surface of the skylight given by equation (A-19)
(decimals)
ρw,i : reflectance of walls of zone i (decimals)
σ0 : dome truncation angle, or shape parameter given by equation (14) (radians)
σ2 : angle given by equation (21) (radians)
τd : diffuse visible transmittance of a flat glazing (decimals)
τeq : equivalent diffuse visible transmittance of a skylight (decimals)
Subscripts : skylight surface : skylight base surface i : zone index f : floor c : ceiling p : work plane w : walls
Table 1 Comparison of average DF at floor predicted using equations (22) and (29) - square atrium with τeq = 0.66, ρs = 0.23, ρf = 0.3 and ρw = 0.50.
n = 1 n = 2 n = 4 n = 8 Well Index (WI) Equation (22)/(29) Equation (22) Equation (29) Equation (22) Equation (29) Equation (22) Equation (29) 0.1 0.2 0.3 0.4 0.5 0.6 0.7 0.8 0.9 1.0 1.1 1.2 1.3 1.4 1.5 1.6 1.7 1.8 1.9 2.0 2.1 2.2 2.3 2.4 2.5 2.6 2.7 2.8 2.9 3.0 61.7 54.1 47.6 42.1 37.3 33.3 29.9 26.9 24.4 22.2 20.3 18.7 17.2 16 14.9 13.9 13 12.2 11.5 10.9 10.3 9.7 9.3 8.8 8.4 8.1 7.7 7.4 7.1 6.9 61.6 53.8 47.1 41.3 36.4 32 28.3 25.1 22.3 19.8 17.7 15.8 14.2 12.7 11.5 10.4 9.4 8.5 7.7 7.1 6.5 5.9 5.4 5 4.6 4.3 4 3.7 3.4 3.2 61.8 54.1 47.6 42 37.2 33 29.4 26.3 23.6 21.3 19.2 17.4 15.8 14.4 13.2 12.1 11.1 10.2 9.4 8.7 8.1 7.5 7 6.5 6.1 5.7 5.3 5 4.7 4.4 61.6 53.6 46.8 40.9 35.8 31.4 27.5 24.2 21.3 18.8 16.5 14.6 12.9 11.4 10.1 8.9 7.9 7.1 6.3 5.6 5 4.5 4 3.6 3.2 2.9 2.6 2.3 2.1 1.9 61.8 54.2 47.6 42 37.2 33 29.4 26.2 23.4 21 18.9 17.1 15.4 14 12.7 11.5 10.5 9.6 8.8 8.1 7.4 6.8 6.3 5.8 5.4 5 4.6 4.3 4 3.7 61.5 53.5 46.6 40.6 35.4 31 27.1 23.7 20.7 18.2 15.9 14 12.3 10.8 9.5 8.3 7.3 6.5 5.7 5 4.4 3.9 3.4 3 2.7 2.4 2.1 1.9 1.6 1.5 61.8 54.2 47.7 42.1 37.2 33 29.4 26.2 23.4 21 18.8 17 15.3 13.8 12.5 11.4 10.3 9.4 8.6 7.8 7.2 6.6 6 5.6 5.1 4.7 4.4 4.1 3.8 3.5
Table 2 Comparison of Well Efficiencies predicted by the present model, Boubekri and Anninos (BA)(20)
, Serres and Murdoch (SM)(21)
and IESNA(9)
-vertical skylight well with ρs =
0.75, ρw = 0.80 and ρf = 0. WI BA(20) SM(21) IESNA(9) Equation (29) n = 4 0.1 0.2 0.3 0.4 0.5 0.6 0.7 0.8 0.9 1.0 1.1 1.2 1.3 1.4 1.5 1.6 1.7 1.8 1.9 2.0 0.964 0.905 0.850 0.797 0.746 0.698 0.652 0.608 0.567 0.530 0.494 0.462 0.430 0.402 0.375 0.350 0.327 0.306 0.286 0.268 0.941 0.885 0.831 0.780 0.733 0.689 0.648 0.611 0.578 0.547 0.519 0.494 0.470 0.449 0.430 0.412 0.395 0.380 0.366 0.353 0.946 0.895 0.847 0.801 0.758 0.717 0.678 0.642 0.607 0.575 0.544 0.514 0.487 0.460 0.435 0.412 0.390 0.369 0.349 0.330 0.944 0.889 0.837 0.786 0.737 0.69 0.646 0.605 0.566 0.53 0.496 0.464 0.435 0.407 0.381 0.357 0.335 0.314 0.295 0.276
σ
0R
Figure 1 A hemispherical truncated dome
0.0 0.1 0.2 0.3 0.4 0.5 0.6 0.7 0.8 0.5 0.6 0.7 0.8 0.9 1
Skylight View Factor F12
Equi v a lent di ffus e tr ans m ittanc e τ eq
uniform overcast sky
CIE overcast sky
flat dome (σ0 =π/4) pyramid pitched vault dome (σ0 =0)
Figure 2 Profile of the equivalent diffuse transmittance as a function of the skylight view factor F12
0.4 0.5 0.6 0.7 0.8 0.9 1.0 8 9 1011 12 13 14 15 16 17 Time (hrs.) Equiv a lent diffus e tr ans mittanc e τ eq 0 1 2 3 4 5
E
gh/E
dh dome square pyramid vault (w/L = 1/4) pitched (w/L = 1/4) flat horizontal Egh/Edh June 24 (σ0 = 0o)Figure 3 Profile of the equivalent diffuse transmittance during a summer day
0.4 0.5 0.6 0.7 0.8 0.9 1.0 9 1011 12 13 14 15 Time (hrs.) Equiv a lent diffus e tr ans mittanc e τ eq 0 1 2 3 4 5