Publisher’s version / Version de l'éditeur:
ASHRAE Transactions, 85, 1, pp. 58-71, 1979
READ THESE TERMS AND CONDITIONS CAREFULLY BEFORE USING THIS WEBSITE. https://nrc-publications.canada.ca/eng/copyright
Vous avez des questions? Nous pouvons vous aider. Pour communiquer directement avec un auteur, consultez la première page de la revue dans laquelle son article a été publié afin de trouver ses coordonnées. Si vous n’arrivez pas à les repérer, communiquez avec nous à [email protected].
Questions? Contact the NRC Publications Archive team at
[email protected]. If you wish to email the authors directly, please see the first page of the publication for their contact information.
NRC Publications Archive
Archives des publications du CNRC
This publication could be one of several versions: author’s original, accepted manuscript or the publisher’s version. / La version de cette publication peut être l’une des suivantes : la version prépublication de l’auteur, la version acceptée du manuscrit ou la version de l’éditeur.
Access and use of this website and the material on it are subject to the Terms and Conditions set forth at
The Calculation of house infiltration rates
Tamura, G. T.
https://publications-cnrc.canada.ca/fra/droits
L’accès à ce site Web et l’utilisation de son contenu sont assujettis aux conditions présentées dans le site LISEZ CES CONDITIONS ATTENTIVEMENT AVANT D’UTILISER CE SITE WEB.
NRC Publications Record / Notice d'Archives des publications de CNRC:
https://nrc-publications.canada.ca/eng/view/object/?id=101628bc-4ab3-4aff-b283-987e6e2a46da https://publications-cnrc.canada.ca/fra/voir/objet/?id=101628bc-4ab3-4aff-b283-987e6e2a46daSer
TH1
N21d
National Research Council of Canada
no. 889
co& Conseil national de recherches du Canada
PL
ANALYZED
THE CALCULATION OF HOUSE INFILTRATION RATES
by G. T. Tamura Reprinted from ASHRAE Transactions Vol. 85, Part 1,1979 p. 58-71 DBR Paper No. 889Division of Building Research
SO MMAIRE
Les methodes d e s f e n t e s e t du changement d ' a i r de 1 'ASHRAE pour l e
c a l c u l de l a charge de c h a u f f a g e due aux i n f i l t r a t i o n s s o n t p r o b a b l e -
ment adequates pour d e t e r m i n e r l e s dimensions d ' u n systeme de chauffage,
mais e l l e s ne l e s o n t pas pour une a n a l y s e e n e r g e t i q u e h o r a i r e d ' u n
e d i f i c e . Comme l a charge due aux i n f i l t r a t i o n s e s t un element i m p o r t a n t
de l a charge g l o b a l e de chauffage,
il f a u t une methode s i m p l e q u i
t i e n n e compte de t o u s l e s f a c t e u r s i m p o r t a n t s du t a u x d ' i n f i l t r a t i o n
de l ' a i r .
E n t r e 1960 e t 1962, l a DRB du CNRC a mesure, l e s f u i t e s d ' a i r au moyen
de l a t e c h n i q u e des t r a c e s de gaz, de deux maisons
a
un e t a g e c o n s t r u i t e s
dans l e s annees
50.
Quelgues annees p l u s t a r d , en 1967-1968, l e s
c a r a c t e r i s t i q u e s de f u i t e d ' a i r des e n c e i n t e s o n t 6 t e mesurees au moven
de l a t e c h n i q u e de p r e s s u r i s a t i o n . Les r 6 s u l t a t s de ces e s s a i s s u r l e s
deux h a b i t a t i o n s o n t s e r v i
a
m e t t r e au p o i n t u n procede de c a l c u l des
t a u x d ' i n f i l t r a t i o n de l ' a i r s i m i l a i r e
a
c e l u i recemment m i s au p o i n t
p o u r l e s e d i f i c e s en h a u t e u r . L ' a u t e u r a a u s s i i d e n t i f i e l e s besoins
de r e c h e r c h e a f i n que l a methode de c a l c u l p u i s s e e t r e a p p l i q u e e
a
des
h a b i t a t i o n s de conception, de c o n s t r u c t i o n e t d ' e x p o s i t i o n au v e n t
d i f f e r e n t e s .
\
i n f o r m a t i q u e d ' h a b i t a t i o n c a u f f g e 2 1 ' h u i l e ( q u i ne f a i t pas
\\
1 'o b j e t ' & i p r e s e n t
expose) a a u s s i
e t e
m'is. au p o i n t p a r l a DRB du CNRC
comme compl erne;-
-'.\
c e t t e e t u d e .
No.
2513
THE CALCULATION OF HOUSE
INFILTRATION RATES
G.T. TAMURA
Member ASHRAE INTRODUCTION
The ASHRAE crack and air change methods (1) for estimating infiltration heating load are probably adequate for sizing of heating systems, but are not suitable for carrying out hourly energy analysis of buildings. As the infiltration load is a significant component of the overall heating load, there is a need for a method that is easy to use, but takes into account all of the significant factors that determine the rates of air infiltration.
During 1960-1962, DBR/NRC conducted air leakage measurements on two single-story houses (2) built during the nineteen fifties using the tracer gas technique. It was followed several years
later in 1967-1968 by the measurement of the air leakage characteristics of their enclosures using the house pressurization technique (3). The results of these tests on the two houses were used to develop a procedure for calculating infiltration rates similar to the one recently developed for high-rise buildings (4). Also, research needs were identified so that the calculation procedure can be applied to houses of different design, construction and wind exposure
.//
A computer model (not the subject of this paper) for houses with oil furnaces was also developed by DBR/NRC which complement this study (5).
TEST DATA ON THE TWO HOUSES
The description of the two houses, both 5-room bungalows located in the residential area of Ottawa, are given in Table 1 and Fig. 1 and 2 (the house numbers are the same as those in Ref 2 and 3 except for House No. 2 which is designated as House No. 3 in Ref 3). There are single-story houses adjacent to the two test houses except for the one side wall of House No. 1 which faces a wooded region.
Tracer Gas Test
The infiltration rates were measured using the tracer gas technique with helium as the tracer gas. It was injected into the supply air duct of the warm air system and the decay in its concentration was measured in the return air duct with an NBS type of katharometer (6). The results of the tests are reproduced in Tables 2 and 3.
In addition to the tracer gas test, pressure differences across the outside walls were measured with pressure taps located in each wall of the test houses. They indicated that the pressure differences across the windward wall facing the backyard for both houses were about 50% of the velocity head of the on-site wind measured 7.6 m (25 ft) above ground. Also, the pressure differences across the exterior walls measured during calm periods in winter indicated that the neutral pressure levels were located 0.25 m (10 in.) above the ceiling of House No. 1 and 0.41 m
(1 ft 4 in.) below the ceiling of House No. 2.
Measurements of C02 concentration in the flue gas with the furnace operating indicated that the flow rates up the chimney, including that of the diluent air through the barometric damper, G.T. Tamura, Research Officer, Energy and Services Section, Division of Building Research, National Research Council of Canada, Ottawa, Canada. KIA OR6
were about 0.40 air changes per hour for House No. 1 and about 0.38 air changes per hour for House No. 2.
House Pressurization Test
The overall and the component air leakage characteristic of the enclosures of the two houses were measured using a 1.42 m3/s (3000 cfm) fan. The roof including the soffit, windows, doors, exhaust vents and chimney openings, were covered with plastic sheets and sealed with tape. A suction pressure of 75 Pa (0.30 inch of water) was maintained throughout the test by adjusting the flow control damper of the fan system. The increase in the flow rate after removal of each seal represented the leakage rate through that particular component. The results of the tests are given in part in Table 4.
STACK ACTION
The equation for calculating infiltration rate is as follows (4):
where
Q = total infiltration rate caused by stack action, ms/s (cfm) s
3 3 2
C = exterior wall flow coefficient, m /s.m2-pan (ft /min
.
ft.
(in. of ~ater)~)W
S = perimeter of the building, m (ft)
y = ratio of actual to theoretical pressure difference (thermal draft coefficient) 2
p = atmospheric pressure, Pa (lb/in. )
To = absolute temperature outside K (R) T. = absolute temperature inside K (R)
1
AT = inside-outside temperature difference, Ti - To, K (R) n = flow exponent
B = ratio of height of neutral pressure level above ground to building height
Note: When British units are used, constant 0.0342 in Eq 1 is replaced by 0.52. This equation was rearranged and the following assumptions were made:
y = 1 (assumption that the interior of the house is essentially open) p = 100 KPa (14.7 psia at sea level)
n = 0.65
Ti = 294 K (530 R)
where
A = total exterior wall area, m2 (ft2)
W
and in air changes/hr.
1
Qs = infiltration caused by stack action, air change/hr V = house volume, m3 (ft3)
Note: When British units are used, constant 10,800 in Eq 3 is replaced by 2.31.
The values of Cw for both houses were calculated by using the air leakage data given in Table 4 and the following flow equation:
where
3
Q = leakage flow through the exterior walls including windows and doors, m /s (cfm) AP = pressure difference across the exterior walls, Pa (in. of water)
-4 3 3
The calculated value of Cw for House No. 1 was 1.1 x 10 m /s.m2-~a0'65 (0.77 ft /min- ft2
-
(in. of ~ater)~'~') and for House No. 2 was 4.6 x (3.2). The leakage flow through the windows and doors was 58% of the total wall leakage for House No. 1 and 23% for House No. 2.The value of H, the height from grade to the first floor ceiling level, was 3.0 m (10 ft) for both houses. The value2 of 6 , the ratio of height of the neutral pressure level above ground to the building height, H, determined from measurements of pressure differences across the outside walls during calm periods was 1.08 for House No. 1 and 0.87 for House No. 2. The relatively high location of the neutral pressure levels are probably due to the chimney which is high level opening and the leakage openings in the ceiling construction.
The infiltration rates for House No. 1 calculated for various outside temperatures using Eq 4 are plotted on Fig. 3 together with the measured values for calm periods from Table 2. It shows that the calculated values agree reasonably well with the measured values. The
calculated values for House No. 2 given in Fig. 4 indicate that the infiltration rates were much greater for this house than for House No. 1 due mainly to the greater value of Cw. The few available measured values from Table 3 are also plotted on Fig. 4 which tend to validate Eq 3. WIND ACTION
The equation for wind infiltration rate was developed from Eq 4 which was modified to fit the measured leakage values for both houses obtained during the summer with little or no stack action. The examination of the measured values plotted on Fig. 5 and 6 indicated that the wind infiltration rates varied as a function of wind velocity and appeared to be insensitive to wind direction. Trial fitting of measured values to Eq 4 indicated that the infiltration rate is influenced by the area of the exposed wall facing the street (front wall) or the back wall. The side walls were shielded from wind by adjacent houses. The effective windward wall area
(A, of Eq 4) was taken as one-third of the total wall area weighted to the dimension of the exposed wall as follows:
where
a = length of wall facing front or back b = length of side wall
The pressure difference across the windward wall, AP, was taken as some fraction of the
velocity pressure of the on-site wind which was related to that at the weather station as follows: AP = F Pv
Pv = 0.60 (E Vs) 2
AP = 0.60 F(E Vs) 2
where
F = constant, pressure difference coefficient
P = velocity head of on-site wind, Pa (in. of water) v
V = wind velocity at weather station, m/s (mph)
S
E = constant, ratio of on-site to weather station wind speed (the values of E were 0.65 for House No. 1 and 0.56 for House No. 2 based on measurements over a wide range of wind condition2).
Note: When British units are used, constant 0.60 is replaced by 0.00048.
Then substituting the above in Eq 4 gives
Note: When British units are used, constant 0.24 in Eq 5 is replaced by 0.0023.
also Eq 5 expressed in air changes/hr is
Note: When British units are used, constant 850 in Eq 6 is replaced by 0.14.
The infiltration rates caused by wind were calculated for both houses and plotted together with measured values on Fig. 5 and 6 against the on-site wind velocity. The value of F assumed
was 0.50 based on the exterior wall pressure measurements on both houses. The calculated values
were lower than the measured values by 0.05 air changes per hour at low wind speed. The difference between the two values decreased with higher wind speeds.
COMBINED WIND AND STACK ACTION
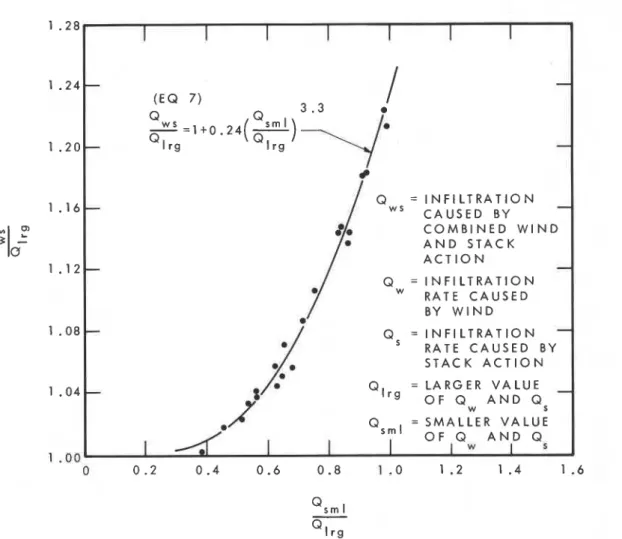
The equation for calculating infiltration rate caused by the combined forces taken from Ref 4 is:
where
Qws
= infiltration rate caused by the combined wind and stack actionQsml = smaller value of
\
and QsThis equation was derived empirically using air leakage data obtained from the computer model building subjected to various combinations of wind and stack action. It shows that Qws is about equal to the infiltration rate caused by the larger of the two motive forces. When Qw equals Qs, Q,, is 24% greater than either Qw or Qs. The two ratios in Eq 7 are plotted on Fig. 7. The infiltration rate caused by the furnace operation also can be included by first determining Qws and comparing it with Qf (furnace operation) in Eq 7.
The above calculation procedure was applied to the test conditions given in Tables 2 and 3. In calculating the infiltration rates during the second winter test of House No. 2, a reduced value of Cw was used to account for the increase in air tightness obtained by sealing all window cracks with tape. The calculated and the measured infiltration rates are compared in Tables 5 and 6. The average difference between the two values was 0.04 and 0.07 air changes per hour for House No. 1 and No. 2 respectively.
DISCUSSION
The proposed procedure for calculating infiltration rate gave values which agreed reasonably well with the measured values. The accuracy of the measured values, which depends on the uniform mixing of tracer gas and room air, and instrument error in measuring the tracer gas concentration, however, was not determined. Also, the net inside volume which accounted for interior
construction and furnishings was roughly estimated to convert calculated infiltration rate in air flow rate (m3/s) into air changes per hour. Hunt and Burch (7) reported that the air change rates measured by SF6 dilution and forced ventilation rates obtained with a fan were in essential agreement for three measurements of air change rates. More tests of this type are required to validate and to improve the tracer gas technique.
The infiltration rates calculated using Eq 3 for stack action were in good agreement with the measured values for both houses. One of the house characteristics required is the height of the neutral pressure level which depends on the vertical distribution of leakage openings in the house enclosure. If the houses tested had no chimney (electrically heated) which represents a high level opening, the height of the neutral pressure level would have been closer to mid-height and, hence, the infiltration rates probably would have been less. The height of the neutral pressure level for various types of houses is required. It can be determined by obtaining the vertical profile of the exterior wall pressure difference during calm periods in winter with the furnace not operating.
The other house characteristic required in Eq 3 and also in Eq 6 is the exterior wall leakage values. These can be obtained for different construction and type of houses from fan
pressurization tests such as the one described in Ref 3. Tests on six houses, including 1- and 2-story houses, indicated that the outside walls contributed 35 to 90% of the overall leakage with the remainder through the ceiling construction; hence, the component as well as the overall
leakage should be measured.
Eq 6 for calculating wind infiltration rate underestimated the measured values, particularly at low wind speeds (Fig. 5 and 6). There appears to be a residual measured infiltration rate of about 0.05 air changes/hr at zero wind speed. This is also evident in Fig. 3 and 4 for the stack infiltration rates at zero temperature difference. Hunt and Burch and other investigators have also noted this phenomenon, which may be attributed to the tracer gas technique but is not as yet satisfactorily explained.
Because the wind data issued by the meteorological station are the only ones readily
available for hourly energy analysis of buildings, more information on the relationship between the wind speed measured at weather stations and residential areas is required (factor E of Eq 6). Also, more information on the exterior wall pressure differences caused by wind are required
(factor F for windward wall of Eq 6). The wind infiltration equation devised to fit the. measured infiltration values of the two houses does not take into account the wind direction. This shortcoming may be important for a completely exposed house or for a townhouse. Because of the dynamic nature of wind superimposed by the turbulence caused by nearby structures and trees, the mechanism of wind infiltration in houses is complex and is the most difficult to account for in the overall infiltration rate (8).
The flow rates through the chimney, Qf, given in Tables 5 and 6 are those measured with the furnace in constant operation. As the furnace operation was not controlled, it often changed cycles during the tracer gas tests as indicated in Tables 2 and 3 and, hence, the actual flow rates were robably less than t h o ~ e indicated in Tables 5 and 6. More infoymation-on the measured vafues of gas flow in chimneys serving various heating appliances is required.
Eq 7 for calculating infiltration rates due to combined forces gave values which were in good agreement with the measured values. If the infiltration rates due to individual forces were added, the calculated values would have been far i.n excess of the measured values. If the average wind speed measured at a weather station is taken as 4.5 m/s (10 mph) and the value of E is 0.6, then the inside-to-outside temperature difference of 13'~ (23'~) for House No. 1 and 5'~ (9'~) for House No. 2 would give the same infiltration rate as that caused by wind; stack action would govern the infiltration rate for greater temperature differences.
The tracer gas tests were conducted with all exterior doors and windows closed. The occupant use of the house likely will affect the infiltration load over a heating season. Some
information in this area is reported by Harrje et a1 (9)
.
CONCLUSIONThe proposed procedure involves determining separately the infiltration rates caused by stack action (Eq 3), wind action (Eq 6), and furnace operation, and then determining the resultant infiltration rate under the combined condition (Eq 7). It gave good agreement with the measured values for two single-story detached houses located in a residential district. The average differences between the calculated and the measured values were 0.04 and 0.07 air changes per hour for House No. 1 and No. 2 respectively. Further checks against measured values of more houses are required.
For general application of the proposed method, test data for various types of house design and construction, wind exposure and heating system required are:
1. neutral pressure level under calm condition and furnace off; 2. exterior wall leakage characteristic;
3. ratio of local to meteorological wind speed;
4. pressure differences across the exterior walls for different wind exposure; and 5. gas flow rate through chimneys serving various heating appliances.
The proposed method does not take into account the infiltration rate caused by occupant use of windows, doors and various household appliances. More information is required in this area to assess its contribution to the infiltration load over a heating season.
This paper is a contribution from the Division of Building Research, National Research Council of Canada, and is published with the approval of the Director of the Division. REFERENCES
1. ASHRAE HANDBOOK & Product Directory, 1977 Fundamentals Volume, Chap. 24, "Heating Load," ASHRAE, Inc., N.Y.C.
2. G.T. Tamura and A.G. Wilson, "Air Leakage and Pressure Measurements on Two Occupied Houses," ASHRAE TRANSACTIONS, 1964, Vol. 70, pp. 110-119.
3. G.T. Tamura, "Measurement of Air Leakage Characteristics of House Enclosures," ASHRAE TRANSACTIONS, Vol. 81, Part 1, 1975, pp. 202-211.
4. C.Y. Shaw and G.T. Tamura, "The Calculation of Air Infiltration Rates Caused by Wind and Stack Action for Tall Buildings," ASHRAE TRANSACTIONS, Vol. 83, Part 2, 1977, pp. 145-158. 5. A. Konrad, B.T. Larsen and C.Y. Shaw, Proceedings of the Third International Symposium on the
Use of Computers for Environmental Engineering Related to Buildings, Banff, Alberta, 10-12 May 1978.
6. C.W. Coblentz and P.R. Achenback, "Design and Performance of Portable Infiltration Meter,'' ASHRAE TRANSACTIONS, Vol. 63, 1957, pp. 477.
7. C.M. Hunt and D.M. Burch, "Air Infiltration Measurements in a Four-Bedroom Townhouse Using Sulfur Hexaflouride as a Tracer Gas,I7 ASHRAE TRANSACTIONS, Vol. 81, Part 1, 1975, pp. 186-201. 8. J.E. Hill and T. Kusuda, I'Dynamic Characteristics of Air Infiltration,'' ASHRAE TRANSACTIONS,
Vol. 81, Part 1, 1975, pp. 168-185.
9. D.T. Harrje, R.H. Socolow and R.C. Sonderegger, "Residential Energy Conservation
-
The Twin Rivers Pr~ject,~' ASHRAE TRANSACTIONS, Vol. 83, Part 1, 1977, pp. 458-477.TABLE 1
DESCRIPTION OF TEST HOUSES
House No. 1 House No. 2
floor area 1
bungalow, 5-room with full basement
bungalow, 5-room with full basement
volume 2 337 m (11,900 ft3) 3 433 m3 (15,300 ft3)
outside wall area 3 108 m (1,170 ft 2 2 ) 126 m2 (1,360 ft2)
construction insulated wood-frame insulated wood-frame
outside walls brick veneer on four
walls
brick veneer and wood siding on front wall, stucco finish on remaining walls
inside finish plaster plaster
windows
heating system
double horizontal wood double-hung sliding sashless-wood vertical sliding with
frame storm sash
forced warm air with gun type oil burner
forced warm air with gun type oil burner
Note:
1. Floor area based on inside dimension. (Basement not included).
/ 2. Net volume, including basement and allowing 10% for furnishing and partitions.
TABLE 2
RESULTS OF INFILTRATION TESTS FOR HOUSE NO. 1
Average
Temperature Wind I n f i l t r a t i o n T e s t D i f f e r e n c e V e l o c i t y Wind Furnace Rate, A i r
No. C m/ s D i r e c t i o n Cycle Change/hr
Winter T e s t Swnmer T e s t Winter-Spring T e s t o f f -on o f f -on o f f on o f f on-of f o f f on-off o f f o f f o f f o f f o f f o f f o f f o f f o f f o f f o f f o f f o f f o f f o f f o f f o f f o f f o f f o f f o f f o f f o f f o f f l b a r o m e t r i c damper s e a l e d
TABLE 3
RESULTS OF INFILTRATION TESTS FOR HOUSE NO. 2
T e s t No.
Average
Temperature Wind I n f i l t r a t i o n
D i f f e r e n c e V e l o c i t y Wind Furnace Rate, A i r
C m/ s D i r e c t i o n Cycle Change/hr
Winter-Spring T e s t
Summer T e s t
Winter T e s t
-
Windows Sealed-
on-off o f f on-off on-off -on o f f o f f o f f -on-off o f f o f f o f f o f f o f f o f f o f f o f f o f f o f f o f f o f f on-of f -on o f f - o n - o f f on-of f -on o f f -on-off on-off -on o f f - o n - o f f o f f -on-off o f f -on-of f o f f - o n - o f f o f f -on-off - - - - -- * f i r e p l a c e damper openTABLE 4
TOTAL AND COMPONENT WALL LEAKAGE RATES 5
v a l u e s i n m / s a t 75 Pa (cfm a t 0.30 i n c h of water)
House No. 1 House No. 2
- --
Wall c o n s t r u c t i o n Windows and d o o r s Cei 1 in g
Note:
1. Leakage v a l u e s exclude t h o s e o f f i r e p l a c e , smoke p i p e and exhaust v e n t s .
TABLE 5
COMPARISON BETWEEN CALCULATED AND MEASURED AIR INFILTRATION RATES FOR HOUSE NO. 1
Test No.
Qc
Qs Qw Q f Calculated Measured Difference
Winter Test Summer Test Winter-Spring Test 0.27 0.00 0.24 0.15 0.21 0.04 0.17 0.05 0.15 0.16 0.19 0.14 0.16 0.17 barometric damper
-
0.40-
sealed1. Values in air changes/hr
2. Qs = calculated values caused by stack action alone
3 . Qw = calculated values caused by wind action alone 4. Qf = measured values caused by furnace operation 5. Qc = values caused by combined forces
TABLE 6
COMPARISON BETWEEN CALCULATED AND MEASURED AIR INFILTRATION RATES FOR HOUSE NO. 2 Test
No.
Qs
R
Q f Calculated Measured Difference Winter-Spring TestSummer Test
Winter Test
-
Windows Sealed0.51 0.06
-
0.50 0.31 0.38 0.34 0.05-
0.52 0.19 0.38 0.61 0.31 0.38 0.47 0.05-
0.37 0.15-
0.39 0.10 0.38 barometric damper sealed 0.40 0.15-
0.45 0.16-
fireplace damper open 0.12 0.06-
0 0.23 - 0.23 0.23 0.00 0.06 0.22 - 0.22 0.20 0.02 0.02 0.10-
0.10 0.12 -0.02 0.02 0.13 - 0.13 0.14 -0.01 0.02 0.03-
0.03 0.11 -0.08 0 0.01-
0.01 0.06 -0.05barometric damper sealed
Note
1. Values in air changes/hr
2. Qs = calculated values caused by stack action alone 3. Qw = calculated values caused by wind action alone 4. Qf = measured values caused by furnace operation 5. Qc = values caused by combined forces
L I V I N G qOOM 3.7m X 6.3m I I+ I 3.6m X 2.4m .Q 3.7m X 3.9m
-
3.6m X 2 . 9 m 4 A JI
,I
F I R S T FLOOR 4 S T A T I C P S E S S U q e TAP x THLRMOCOUPLE- Fig. 1 H o u s e N o . 1FIRST
F L O O R4 STATIC PSLSSUqE- TAP
X T H E R M O C O U P L E /
1 I I I I W l N D SPEED LESS T H A N 1 . 4 m/s F U R N A C E O F F E s T N o .
-
2 l 3/
e29'CALCULATED A C C O R D I N G T O EQ ( 3 ) 1 I 1 1 W l N D SPEED LESS T H A N 1 . 9 m/s-
F U R N A C E O F F-
-
T O E Q ( 3 ) TEMPERATURE D I F F E R E N C E , C d e g TEMPERATURE D I F F E R E N C E , C d e g F i g . 3 I n f i l t r a t i o n r a t e s c a u s e d by s t a c k F i g . 4 I n f i l t r a t i o n r a t e s caused by s t a c k a c t i o h f o r House N o . 1 a c t i o n f o r House No. 20 0 1 . 0 2 . 0 3 . 0 4 . 0 5 . 0 6 . 0 O N - S I T E W l N D V E L O C I T Y , m/s I I I 1 1 TEMPERATURE D I F F E R E N C E BETWEEN I N S I D E A N D
-
O U T S I D E A I R - 2 . 5 T O 3.3'C-
F i g . 5 I n f i l t r a t i o n r a t e s c a u s e d by wind f o r House N o . 1 TEMPERATURE D I F F E R E N C E BETWEEN I N S I D E A N D 3 0-
O U T S I D E A I R - 1 . 7 T O 1 . l 0 C 20-
T O E Q ( 6 ) V 0 1 . 0 2 . 0 3 . 0 4 . 0 5 . 0 6 . 0 O N - S I T E W l N D V E L O C I T Y , m/s F i g . 6 I n f i l t r a t i o n r a t e s c a u s e d by wind f o r House No. 2Fig. 7 F a c t o r s f o r d e t e r m i n i n g i n f i l t r a t i o n r a t e s caused b y combined wind and s t a c k a c t i o n . 6 1 . 2 8 - 1 . 2 4 1 . 2 0 1 . 1 6 1 . 1 2 1 . 0 8 1 . 0 4 1 .oo
I
I
-
-
(EQ 7 ) Q w s-
T g-
= I N F I L T R A T I O N-
-
C A U S E D BY C O M B I N E D W l N D A N D S T A C K A C T I 0 N-
= I N F I L T R A T I O N Q w RATE C A U S E D BY W l N D-
Q S = I N F I L T R A T I O N-
RATE C A U S E D BY S T A C K A C T I O N-
Q l r g = L A R G E R V A L U E-
O F Q w A N D Q S Q S m l = S M A L L E R V A L U EI
1
I
I
O F Q w A N D Q S 0 0 . 2 0 . 4 0 . 6 0 . 8 1 . O 1 . 2 1 . 4 1I
1
This publication i s being distributed by the Division of Bv.ilding R e s e a r c h of the National R e s e a r c h Council of - Canada. I t should not be reproduced in whole o r in p a r t without p e r m i s s i o n of the original publisher. The Di- vision would be glad to be of a s s i s t a n c e in obtaining such p e r m i s s i o n .
Publications of the Division m a y be obtained by m a i l - ing the a p p r o p r i a t e r e m i t t a n c e ( a Bank, E x p r e s s , o r P o s t Office Money O r d e r , o r a cheque, m a d e payable to the Receiver General of Canada, c r e d i t NRC) to the National R e s e a r c h Council of Canada, Ottawa. K1A 0R6. Stamps a r e not acceptable.
A l i s t of a l l publications of the Division i s available and m a y be obtained f r o m the Publications Section, Division of Building Research, National R e s e a r c h Council of Canada, Ottawa. KIA OR6.