Publisher’s version / Version de l'éditeur:
Vous avez des questions? Nous pouvons vous aider. Pour communiquer directement avec un auteur, consultez la première page de la revue dans laquelle son article a été publié afin de trouver ses coordonnées. Si vous n’arrivez pas à les repérer, communiquez avec nous à [email protected].
Questions? Contact the NRC Publications Archive team at
[email protected]. If you wish to email the authors directly, please see the first page of the publication for their contact information.
https://publications-cnrc.canada.ca/fra/droits
L’accès à ce site Web et l’utilisation de son contenu sont assujettis aux conditions présentées dans le site
LISEZ CES CONDITIONS ATTENTIVEMENT AVANT D’UTILISER CE SITE WEB.
Proceedings of the ESIM 2004 Conference: 10 June 2004, Vancouver, B.C., pp.
175-182, 2004-06-01
READ THESE TERMS AND CONDITIONS CAREFULLY BEFORE USING THIS WEBSITE. https://nrc-publications.canada.ca/eng/copyright
NRC Publications Archive Record / Notice des Archives des publications du CNRC :
https://nrc-publications.canada.ca/eng/view/object/?id=5a5cbee5-3d31-4702-b17c-623c4ee6f6d1
https://publications-cnrc.canada.ca/fra/voir/objet/?id=5a5cbee5-3d31-4702-b17c-623c4ee6f6d1
Archives des publications du CNRC
This publication could be one of several versions: author’s original, accepted manuscript or the publisher’s version. / La version de cette publication peut être l’une des suivantes : la version prépublication de l’auteur, la version acceptée du manuscrit ou la version de l’éditeur.
Access and use of this website and the material on it are subject to the Terms and Conditions set forth at
Key findings from a online survey on the use of daylight simulation
programs
Key findings from a online survey on the use of daylight
simulation programs
Reinhart, C.F.; Fitz, A.
NRCC-46897
A version of this document is published in / Une version de ce document se trouve dans :
Proceedings of the ESIM 2004 Conference, Vancouver, June 10-11, 2004, pp. 1-8
KEY FINDINGS FROM A ONLINE SURVEY ON THE USE OF
DAYLIGHT SIMULATION PROGRAMS
Christoph F. Reinhart Annegret Fitz
Institute for Research in Construction
National Research Council Canada, Ottawa K1A 0R6, Canada
[email protected] [email protected]
Keywords: daylight simulations, RADIANCE, online survey
1. INTRODUCTION
In a rapidly changing world, design professionals rely more than ever on solid performance measures to support their design decisions. The role of computerized building design tools is to provide such information efficiently. Given the breadth of choices and concerns that a design team is confronted with, various design aspects constantly compete for the team’s attention. To remain competitive, design professionals must weigh the value of information gained through any one simulation tool against the invested time and financial resources, as well as against the value of comparable information that might be gained through the use of other or no tools. Because daylighting is a declared design feature of virtually all “sustainable/green” buildings, and because it is difficult to evaluate its quality and quantity in a space through simple rules of thumb, daylighting software should have a high rate of acceptance and adoption within the market. This is the underlying notion for the development of daylight simulation tools. The research described in this paper was motivated by the authors’ observation that despite the availability of simplified and detailed daylight simulation methods, none of these tools has yet penetrated the building design market to any great degree. The objective of this study therefore was to identify weaknesses of existing daylighting design software packages, better understand design practitioners’ needs, and accordingly provide guidance to software developers. The paper briefly summarizes results from previous surveys on the use of building simulation software and presents some key findings of an online survey that particularly concentrated on daylight simulation software. This work was carried out within the context of the International Energy Agency’s (IEA) research project ‘Task 31: Daylighting Buildings in the 21st Century’. The project’s overall objective is to foster the use of daylight in commercial buildings through a better understanding of occupant needs’, more integrated lighting and shading controls, and improved daylighting design software. This study contributed to the latter work package.
2. PREVIOUS WORK
A number of surveys have been carried out in the past that were concerned with the use of building simulation tools during building design. A detailed literature review of these surveys has been described in an extended version of this paper (Reinhart C F and Fitz A, 2004).
Previous surveys were capable of identifying general trends and needs in the design community. Some requirements such as better software documentation and training opportunities have been high priorities for users since day one (Mason M D, 1985; Matsuo Y, 1985). This is not surprising as self-learning remains the most single common training method for the users of tools today (Pilgrim M et al., 2003). Initial concerns regarding software costs and accuracy seem to be fading (Robinson D, 1996), probably as a result of government agencies providing free programs and researchers publishing real-world validation studies of building simulation engines. Improved interfaces featuring better quality control of simulation input and more flexibility concerning the graphical presentation of simulation output are still in need (Pilgrim M et al., 2003). The call for less complex models has led to the development of simplified tools. These tools are finally being used at least by some architects in addition to guidelines and handbooks (Robinson D, 1996; de Wilde P et al., 2001). On the other hand, the observed trend that simplified, “early design” tools commonly end up being used at all design stages(Lam K P et al., 1999) should prompt developers to clearly state the tools’ capabilities and limitations. Detailed simulation tools remain the domain of engineers. Quality assurance and consistency analysis of simulation input and output is becoming a growing concern for software users (Pilgrim M et al., 2003).
Lighting simulation software is less frequently used by architects or engineers than other building simulation software (Lam K P et al., 1999). Physically-based daylight simulations still have the reputation of being somewhat exotic endeavors of the odd specialist. The latter finding confirms the subjective observation on which this research was originally based. It further reveals a surprising mismatch between an active daylight simulation research community (simulation engines such as RADIANCE (Ward G and Rubinstein F, 1988) have been available for over 15 years) and the professional building design community which largely ignores these efforts.
3. METHODOLOGY
Based on the low response rate of a previous survey on the use of daylight simulation tools (Maamari F, 2004), the authors decided to collect information through an online survey. The advantages of administering the survey online were:
• It could be effectively distributed to a large number of design professionals worldwide, allowing the authors to build upon a network of national contacts from IEA Task 31 members.
mail surveys(Pilgrim M et al., 2003).
• One apparent difficulty of previous surveys on lighting simulation tools was that participants were sometimes daunted by the questionnaires (Maamari F, 2004). An online survey could engage respondents, provide follow-up questions depending on answers (branching) and check for completeness of answers. Another benefit of branching was that it substantially reduced the length of the survey and therefore increased the number of valid responses.
The questionnaire focused on design practitioners who integrate daylighting in their building design. It aimed at understanding the barriers that prevent design professionals from using daylighting simulation software and understanding the process for those who do. To ensure the clarity and relevance of the questionnaire, the authors set up an online test version and requested comments and suggestions from peer IEA and NRC researchers. Based on the feedback, the questionnaire was revised and a final version was approved by the Ottawa Research Ethics Board of the National Research Council Canada as Protocol 2003-31. Data collected during the development phase was discarded before the main data collection phase.
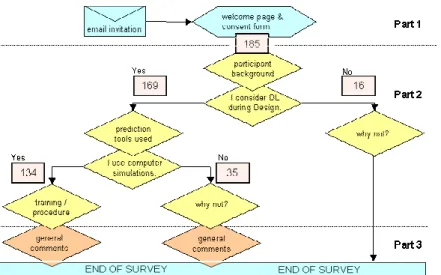
The final questionnaire was created and administered using the Halogen eSurveyor software (halogensoftware.com) in combination with an Oracle database. It included four question types: multiple selections of specific categories, a single selection of a specific category, pull-down menus, and free text. Multiple selection questions usually included a textbox in which participants could provide information beyond pre-defined answers. The whole questionnaire was divided into three parts (Figure 1):
• A welcome web page explained the objective of the survey, informed potential participants of their rights to end their participation at any time and for any reason, and requested them to consent to the survey conditions. Incentive for individuals to participate in the survey was their “opportunity to influence future developments of daylight simulation tools”.
• Once individuals had consented to participate in the survey, the questionnaire began with some general inquiries concerning participants’ profession, types of projects they work on, and the country in which these projects are located. The first main branching separated those participants who consider daylighting during their design from those who do not. For the latter, questions were geared towards understanding the reasons for not considering daylighting. Those considering daylighting were asked which tools they routinely used to implement daylighting, ranging from experience from previous projects to guidelines, spreadsheets, computer simulations, and scale model measurements. Follow up questions were provided that inquired which exact documents/methods were used by participants. The second branching separated those who do use daylighting simulation tools from those who do not. For the latter, a series of questions followed that aimed at understanding the barriers against using these tools. The former group was asked which tools they use, how they were
trained, what quantities they usually calculated, which design criteria they applied and which building design aspects were directly affected by their daylighting analysis. Depending on the answers given, the questionnaire varied in length from 6 to 22 questions.
• At the end of the survey participants who consider daylighting during design were invited to provide their thoughts on what should be done to enhance the use of daylighting in buildings.
Participants were recruited through email invitations to selected mailing lists as well as to contact architects and consultants known to IEA Task 31 members. Noteworthy mailing lists that generated a high response rate were the BLDG-SIM ([email protected]); RADIANCE Online (radiance-online.org), and e-bulletins to the Ontario Association of Architects and the Royal Architectural Institute of Canada. Email invitations were further sent to registered users of a number of software packages including ADELINE, DAYSIM, ECOTECT, and SKYVISION. IEA Task 31 researchers were discouraged to participate in the survey to avoid any further bias in the responses.
4. SURVEY RESULTS
Data collection lasted from Dec 2nd 2003 to Jan 19th 2004. A total of 193 individuals participated in the survey. 185 individuals completed the survey whereas 8 individuals chose to end their participation (close their web browser) somewhere along the way. The 185 valid responses were considered during the following analysis. What information can be extracted from the collected data? As in Pilgrim’s earlier study, “the questionnaire is based on an open sample, and as such the results cannot be proven to be representative of any given population”. But with nearly 200 responses collected, “patterns can be identified and cross-discipline analysis is possible”(Pilgrim M et al., 2003).
4.1 Participants’ Background
Table 1 shows the professions participants chose from eight available categories. For the Figure 1: Overview of the survey.
Depending on their responses, participants followed one of three main branches: Consider daylighting (DL) during design and use computer simulations (CS); Consider DL but do not use CS; do not consider DL. The numbers in the rectangular boxes correspond to the number of participants that went through a particular survey branch.
following analysis, these eight categories were reorganized into three professional groups, designers,
engineers and researchers. This simplified division was introduced to detect any occupational
differences in the use of daylighting design tools. Architects, interior designers, and lighting designers were binned into the designer group. Engineers corresponded to participants who chose “engineers” or “energy consultants” as their profession. Finally, researchers consisted of scientists and academics. Responses provided by the latter group could be interpreted as indicators where future design practice might go. Selected individuals of the original “other” category could be binned under the three professional groups so that the regrouping resulted in 31% designers, 38% engineers, and 23% researchers (Table 1). Participants, that did not fall into any of the three professional groups, were excluded whenever cross-discipline aspects were investigated. Respondent’s projects were mostly located in 27 countries across the globe. The majority of respondents worked in Canada (20%) the United Stated (20%) and Germany (12%). Other countries with a relatively high number of participants were the UK (6%), Sweden (6%), Brazil (4%), Switzerland (4%), and Japan (3%).
Table 1: Professions of participants.
Profession Professional Group
architect 33
lighting designer 19 designer 58 (31%) interior designer 1
energy consultant 22 engineer 71 (38%)
engineer 39
researcher 39 researcher 43 (23%)
manufacturer 5 other 13 (8%)
other 27
V
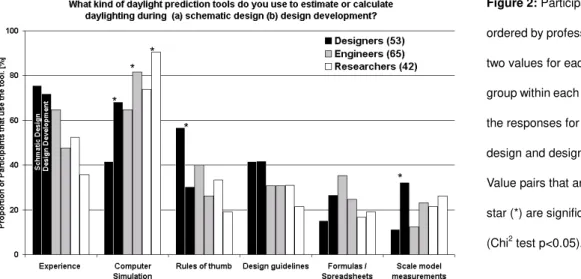
Figure 2: Participants’ responses
ordered by professional group. The two values for each professional group within each category indicate the responses for schematic design and design development. Value pairs that are marked with a star (*) are significantly different (Chi2 test p<0.05).
Participants mostly worked on small (17%) and large (15%) offices as well as schools (15%). 11% worked on multi-unit residential buildings.
Do you consider daylighting aspects during building design?
At the first main branching 169 participants (91%) responded that they do include daylighting aspects in their design (Figure 1). This response is not surprising given that the survey specifically invited participants to comment on the use daylight simulations during building design.
4.2 Participants that did not include daylight aspects in their building designs.
Those few participants (16) who did not include daylighting into their design were asked to explain why not. Six respondents were simply not involved in lighting or daylighting design. Three respondents carried out electric lighting computer simulations but stated that clients would not pay for any daylighting analysis. Three others did not know where to get the required information.
4.3 What kind of daylight prediction tools do you use?
Those 91% of respondents that did consider daylighting during design were asked what prediction tools they routinely used during schematic design and design development. Options ranged from experience from previous work, design guidelines, rules of thumb, and formulas/spreadsheets, to computer simulations and scale model measurements. Participants could choose more than one prediction tool. Figure 2 shows participants’ choices ordered by professional group. For each professional group and prediction tool two values are shown reflecting percentages of usage during schematic design and design development. The figure reveals that experience from previous design and daylight simulation tools were the overall prediction methods of choice. 135 individuals responded that they used computer simulation tools corresponding to 79% of all respondents who consider daylighting during building design. This strong sample bias towards the use of simulation tools reflects the participant recruitment process. Occupational differences followed the trends one would expect. The strongest cross-discipline differences existed for computer simulations. As in previous studies, engineers were more likely to use these tools than designers. On the flipside, designers more heavily relied on experience from previous work and rules of thumb than the other two groups (de Wilde P et al., 2001; Donn M, 1999). The overall use of scale model measurements and spreadsheets was low, which again might be a consequence of the sample’s bias towards computer simulations.
Some differences between schematic design and design development are noteworthy. A star (*) in Figure 2 above a pair of columns for schematic design and design development indicates that the Chi2 test yielded that the two responses were significantly different (p<0.05). All three professional groups were significantly more likely to use computer simulations during later design stages. Trust in
rules of thumb significantly fell for designers during design development, indicating that this was the time when they required additional input through computer simulations. Scale models –if used at all– were significantly more likely to be used by designers during design development than during schematic design.
4.4 Participants that considered daylighting but did not use computer simulations tools.
Only 35 individuals indicated that they considered daylight but did not use computer simulation tools. Primary reasons given by 17 designers and 12 engineers for not using computer simulations were that they did not know which tools to use. This might be an indication that tool developers do still not sufficiently promote their tools within the design community. Other reasons were lacking staff skills, unwillingness of clients to pay for the service, and long training times. Only one individual expressed doubts as to whether current tools are reliable and meet practitioners’ needs. This is a very encouraging result for the developers of daylight simulation tools. It shows that model validation has matured to a point at which overall trust in the capability of tools to yield correct results is high.
4.5 Participants that do use computer Simulations tools.
The 134 participants that used computer simulation tools for daylighting design were asked to specify which exact tools they were using. A total of 42 different daylight simulation programs were listed. This reveals how divided the daylight simulation developers community still is. On the other hand, out of the 342 selections that were given for 42 daylight simulation tools, 138 selections were made for programs that exclusively use the RADIANCE backward raytracing simulation engine and 38 selections were made for tools that offer the usage of the RADIANCE engine together with other engines. In other words, over 50% of selections made were for RADIANCE-based tools. This reveals that despite the widely lamented complexity of RADIANCE, it is the design tool of choice for the majority of design professionals that use computer simulations.
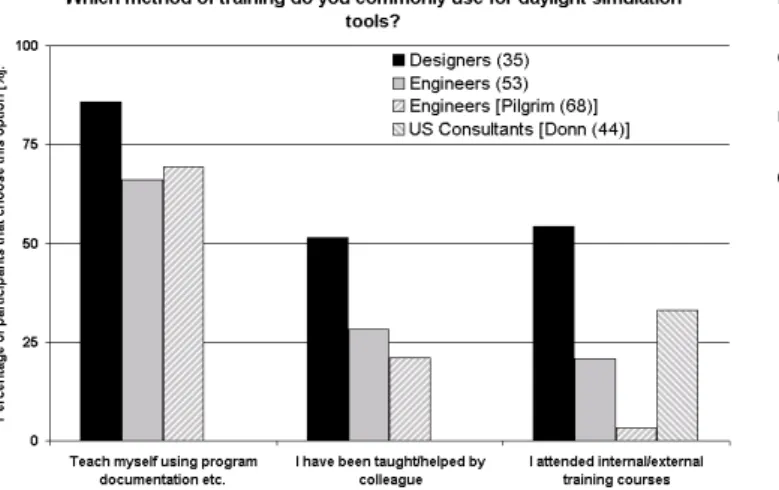
Figure 3: Responses given by 35 designers and 53
engineers as to which method of training they primarily used. The data from this survey is complemented with data from Donn’s and Pilgrim’s studies.
4.6 Methods of training
Users of computer simulation software were asked which method of training they commonly use. Figure 3 shows the results for this survey together with findings from Pilgrim’s and Donn’s studies. Direct comparison of study results is difficult as questions might have been phrased differently in Donn’s study, and Pilgrim’s survey participants chose one training method only. Despite of these caveats, Self-learning using program documentation was consistently rated as the most common training methods for designers and engineers alike. This finding underlines the significance of program documentation.
There was no clear pattern in the attendance rate of formal training courses: While over 50% of designers had enjoyed some kind of formal training, the percentages for engineers were 3%, 22%, and 30% in Pilgrim’s, this, and Donn’s studies respectively. Donn found that less than 10% of New Zealand design professionals had attended a course compared to 30% of US consultants. These numbers hint that the rate of users receiving formal training depends on the existence of a local educational infrastructure.
4.7 Simulation Output
Figure 4 shows what output the three professional groups produced using daylight simulation programs. Interior illuminances under selected sky conditions and daylight factors were the frontrunners. This finding is not surprising as (a) these quantities can be directly calculated by most contemporary daylighting analysis tools, and (b) codes and guidelines tend to provide minimum thresholds for these quantities. Therefore, performance evaluation becomes straightforward and design decisions can be based on these performance indices. Photo realistic images, interior luminances under selected sky conditions, and electric lighting use were also calculated by at least 49% of participants in all groups. Over a third of participants calculated glare indices.
The largest professional discrepancy existed in the frequency of daylight autonomy calculations (41% researcher compared to 17% engineers and 27% designers). The daylight autonomy is defined as the percentage of the occupied times during the year when a minimum illuminance level is maintained at a work place by daylight alone (Reinhart C F and Walkenhorst O, 2001).
In a follow-up question participants were asked how they were using the simulation outputs from Figure 4. While 94% of participants carried out comparative studies between different building design options only 33% used absolute values provided by the programs (Table 2). 74% included simulation results into client reports but only 39% used them to convince their clients of a specific design solution.
Table 2: How do you use those simulation outputs?
I use simulation results for comparative studies between different building design variants. 94% I use absolute values provided by the programs (e.g. to demonstrate code compliance). 33%
I present them to clients in reports/presentations. 74%
I use them to convince investors of a specific design solution. 39%
I use them to apply for incentive programs. 14%
The 92 participants that presented their simulation results to their clients were asked what they think their clients did with the results. 83% indicated that their clients “try to understand the underlying implications for the building”. This shows that instead of trying to convince clients of a particular design solution, the majority of participants surveyed tended to present their finding to their clients and let them choose a design option. This finding is in line with Donn’s study in which over 50% of US consultants regularly carried out parameter studies to demonstrate the energy consequences of a design measure to clients.
4.8 Design aspects that are influenced by daylighting analysis?
All 169 participants (Figure 1) that considered daylighting during building design were asked what design aspects are influenced by their daylighting analysis (Figure 5). Shading type and control were the number one design aspects that were influenced by the daylighting analysis for all three professional groups followed by window size, glazing type and the choice of lighting controls. Building Figure 4: Responses given by 35 designers and
53 engineers which outputs they produced using computer simulation programs.
orientation, interior surface properties, and room dimensions followed. It might seem odd that fundamental design aspects such as building orientation and room dimensions were less frequently influenced by a daylighting analysis than shading and glazing type. The reason for this response pattern might be that decisions regarding orientation and building massing tend to be largely predefined by existing site conditions and client expectations. Thus they tend to be decided during schematic design when the designer still follows rules of thumb and experience from previous work (Figure 2). It is only later in the design process, when it comes to choosing shading controls, window size and glazing types, that there is time for a dedicated daylighting analysis.
The 119 people who chose shading type and control as a design aspect for their daylight analysis were offered a text box to enter specific shading design criteria they used. Responses ranged from just “blinds” as the do-it-all solution, to detailed considerations of the interplay of thermal loads, admitting daylight, avoiding glare, and the need of a view. “Appearance” was also regularly quoted as an important shading design criteria.
5. DISCUSSION AND CONCLUSION
With 185 valid responses, this survey gathered a reasonably accurate snapshot of the current use of simulation tools within the daylighting community. The high number of responses confirms that (a) online surveys are an effective way to gather responses from a large number of design professionals, and (b) that there exists a small but solid base of individuals that are using daylight simulation tools in actual design practice. These individuals are the “practitioners” whose needs and opinions are discussed in the following.
weaknesses of daylighting software: The good news from this survey are that –as for building energy software– some designers have started using computerized daylight simulation tools. Initial concerns regarding software accuracy seem to be fading which might be a result of recent software validation studies(Mardaljevic J, 2000). On the other hand, survey participants still found existing simulation tools Figure 5: Responses given by 53 designers,
65 engineers, and 42 researchers which buildings design aspects were usually affected by their daylighting analysis.
difficult to use, requesting better software documentation, examples and definitions of input and output quantities.
The main barriers for not using daylight simulation tools were that participants did not know which tools to use, and that training opportunities were missing.
practitioners’ needs: As for other building simulation software packages, self-learning is the most common training method for daylight simulation users. This explains their need for better software documentation. The rate of users that received any formal training depended on the existence of a local educational infrastructure. The usage of simulation tools was significantly higher during design development than during schematic design for all three professional groups. This finding confirms results from earlier surveys on the use of design decision software. Most survey participants used daylighting software for parameter studies and presented the results to their clients as a basis for design decisions. To facilitate this process, daylight simulation packages should help users to automatically carry out parameter studies and present the resulting relationships. Daylight factor and interior illuminances under selected sky conditions were the two most widely used simulation outputs. The advantage of these outputs for practitioners is that existing guidelines provide minimum thresholds for these quantities, so that they can be easily used as daylight performance indicators. In contrast, there are currently no comparable performance evaluation schemes for choosing a suitable shading type and control even though they were consistently voted to be the most common design aspect influenced by a daylighting analysis. The strong interest in shading devices is not surprising, given that glare prevention is a recognized requirement for “good” daylighting. What is surprising is that existing tools do generally not feature automated routines to help users pick a suitable shading device. This suggests that the majority of surveyed users (who had a bias towards simulation programs) picked the shading device (the daylighting design aspect with the highest relevance to them) without any direct input from simulation programs. Over 40% of surveyed researchers were using daylight autonomy as a simulation output. This high adoption rate might be both the consequence of the recent implementation of algorithms to efficiently calculate the daylight autonomy into a number of daylight simulation programs as well as an indication that the daylight autonomy will become more widely used in the future.
guidance for software developers: This survey shows that daylight simulations have come a long way. While in Aizlewood’s and Littlefair’s 1994 survey trust in the reliability of tools was still an issue, this concern has more or less vanished since. Most users now seem to believe that tools can yield accurate results and that simulation errors stem from incorrect data input. This understanding might prompt users to put more emphasis on quality assurance procedures than in the past. Another change since Aizlewood’s survey is that the use of scale models among daylight specialists seems to have fallen substantially. While in the former study 17 our of 22 specialists (77%) still used them, this number has
fallen to 27% in this survey. The reasons for this decline might be that the advantages of scale models over simulation that were quoted in Aizlewood’s study (visualize the quality of lighting, easy changing of parameters) are less convincing today. 342 votes for 42 daylight simulation tools were given, revealing that the daylight simulation developer community is still very fragmented. On the other hand, 50% of the votes were based on RADIANCE compatible tools, revealing the program’s predominance within the daylight simulation community.
Summing up, the use of daylight simulation programs largely resembles that of other building simulation programs. Simulations seem to have gained a competitive advantage over scale model approaches. A large number of different program interfaces is currently used, but the underlying simulation algorithms are concentrating on just a few approaches. There is a need for more holistic performance indicators and design selection procedures to judge the quality and quantity of daylight in a building. Daylight autonomy is a first step towards characterizing the annual quantity of daylight. A “daylighting quality index” will still require more conclusive research into phenomena such as glare and health related impacts of (day)light on the human body (Veitch J, 2002). Future surveys should concentrate on sampling a more random group of design professionals. Due to the sample bias that was introduced through the recruitment process, the results from this survey cannot necessarily be extrapolated to the whole design community.
ACKNOWLEDGEMENT
This work has been funded by the National Research Council Canada and Natural Resources Canada under the contract number B-3213, as well as the German Academic Exchange Office (DAAD) as scholarship PKZ: D/03/34481.
REFERENCES
AIZLEWOOD M E AND LITTLEFAIR P J. (1994), Daylight prediction methods: A survey of their use. Garston Watford, UK, British Research Establishment.
DE WILDE P, VAN DER VOORDEN M, BROUWER G, AUGENBROE G, AND KAAN H (2001). The Need for Computational Support in Energy-Efficient Design Projects in the Netherlands. Conf. Proc.
IBPSA ’01 Buildings Simulation, Rio d Janeiro, Brazil,513-520 pp.
DONN M (1997) A Survey of Users of Thermal Simulation Programs. Conf. Proc. IBPSA ’97 Buildings
Simulation, Prague, Czech Republic, paper 37.
DONN M (1999) Quality assurance simulation and the real world. Conf. Proc. IBPSA ’99 Buildings
Simulation, Kyoto, Japan, III:1139-146 pp.
LAM K P, WONG N H, AND HENRY F(1999) A Study on the Use of Performance-Based Simulation Tools for Building Design and Evaluation in Singapore. Conf Proceed Building Simulation '99 in Kyoto,
Japan, September 13-15, II:675-682 pp.
MAAMARI F. International survey on lighting simulation tools. 2004. International Energy Agency, Report for IEA Task 31, Daylighting Buildings in the 21st Century.
MARDALJEVIC J. (2000) Validation of a Lighting Simulation Program under Real Sky Conditions.
Lighting Research & Technology 27[4], 181-188.
MASON M D (1985) Survey of Simulation Technology in Astralia and NewZealand. Conf. Proc.
IBPSA ’85 Buildings Simulation, Seattle, USA, I:31-40 pp.
MATSUO Y (1985) Survey of Simulation Technology in Japan and Asia. Conf. Proc. IBPSA ’85
Buildings Simulation, Seattle, USA, I:22-30 pp.
PILGRIM M, BOUCHLAGHEM N, LOVEDAY D, AND HOLMES M (2003) Towards the efficient use of simulation in building performance analysis: a user survey. Building Serv. Emg. Res. Technol., 24:149-162 pp.
REINHART C F AND WALKENHORST O. (2001) Dynamic RADIANCE-based Daylight Simulations for a full-scale Test Office with outer Venetian Blinds. Energy & Buildings 33[7], 683-697.
REINHART C F AND FITZ A (2004) Findings from a Survey on the current use of daylight simulations during building design, submitted to Energy & Buildings.
ROBINSON D (1996) Energy model usage in building design: A qualitative assessment. Building
Services Engineering Research and Technology, 17:89-95 pp.
VEITCH J (2003) Principles of Healthy Lighting: Highlights of the CIE TC 6-11’s Forthcoming Report. Proceedings of the 5th EPRI Lighting Research Symposium: Light and Human Health.
WARD G AND RUBINSTEIN F. (1988) A New Technique for Computer Simulation of Illuminated Spaces. Jour. of the Illuminating Engineering Society 1, 80-91.