UNIVERSITE DE SHERBROOKE
Faculte de genie
Departement de genie chimique et de biotechnologique
ETUDES THEORIQUES ET EXPtRIMENTALES DE L'OXYDATION
feLECTROLYTIQUE COMPLETE INVERSE DANS LE SYST^ME Na-B-H-O
THEORETICAL AND EXPERIMENTAL INVESTIGATIONS RELATED TO
ELECTROLYTIC REVERSE COMPLETE OXIDATION WITHIN THE Na-B-H-O
SYSTEM
These de doctorat es sciences appliquees
Speciality: Genie Chimique
Daniel Louis CALABRETTA
Rapporteur:
Jury:
Jerzy, JUREWICZ
Francis, GITZHOFER
(directeur)
Gessie, BRISARD
Patrice, CHARTRAND
Boyd, DAVIS
Professeur
University de Sherbrooke, Faculte de Genie
Professeur
Universite de Sherbrooke, Faculte de Genie
Professeur University de Sherbrooke, Faculte de Sciences
Professeur
Polytechnique Montreal, Faculte de Genie
Principal
Kingston Process Metallurgy Inc.
Library and Archives Canada Published Heritage Branch Bibliotheque et Archives Canada Direction du Patrimoine de I'edition 395 Wellington Street Ottawa ON K1A0N4 Canada 395, rue Wellington Ottawa ON K1A 0N4 Canada
Your file Votre reference ISBN: 978-0-494-89680-8 Our file Notre reference ISBN: 978-0-494-89680-8
NOTICE:
The author has granted a non
exclusive license allowing Library and Archives Canada to reproduce, publish, archive, preserve, conserve, communicate to the public by
telecommunication or on the Internet, loan, distrbute and sell theses
worldwide, for commercial or non commercial purposes, in microform, paper, electronic and/or any other formats.
AVIS:
L'auteur a accorde une licence non exclusive permettant a la Bibliotheque et Archives Canada de reproduire, publier, archiver, sauvegarder, conserver, transmettre au public par telecommunication ou par I'lnternet, preter, distribuer et vendre des theses partout dans le monde, a des fins commerciales ou autres, sur support microforme, papier, electronique et/ou autres formats.
The author retains copyright ownership and moral rights in this thesis. Neither the thesis nor substantial extracts from it may be printed or otherwise reproduced without the author's permission.
L'auteur conserve la propriete du droit d'auteur et des droits moraux qui protege cette these. Ni la these ni des extraits substantiels de celle-ci ne doivent etre imprimes ou autrement
reproduits sans son autorisation.
In compliance with the Canadian Privacy Act some supporting forms may have been removed from this thesis.
While these forms may be included in the document page count, their removal does not represent any loss of content from the thesis.
Conformement a la loi canadienne sur la protection de la vie privee, quelques
formulaires secondaires ont ete enleves de cette these.
Bien que ces formulaires aient inclus dans la pagination, il n'y aura aucun contenu manquant.
"Tu Ne Cede Malis"
-Ludwig von Mises
RESUME
Ce travail presente des resultats theoriques et expErimentaux qui explorent la
possibility de remplacer les carburants traditionnels par un combustible a base d'hydrure de
bore, un mEtal alcalin leger. Sur la base d'une oxydation compl&e, sous certaines modalites,
1'hydrure de bore a une densite volumetrique d'Energie depassant les exigences les plus
reconnus de l'industrie automobile tout en produisant des fluides incompressibles pouvant etre
regeneres par des moyens efficaces. L'oxydation inverse Electrochimique complete au centre
de notre intEret peut etre conceptualise comme la combustion electrochimique inverse ou
encore comme l'hydrolyse Electrochimique inverse, combinee en serie avec une cellule
d'Electrolyse de l'eau.
Pour exprimer plus clairement les cycles Electrochimiques concernes, un module
thermodynamique des reactions en jeu a ete developpe sur la base d'un formalisme amphotere,
qui utilise une nouvelle echelle de concentration definie par les fractions ioniques elementaire
equivalentes. Par une Equation de Nernst modifiee, les compositions de l'anolyte et du
catholyte d'une cellule electrochimique sont definies par le ratio des fractions ioniques
elEmentaire Equivalentes des elements electro-actifs du compartiment.
Experimentalement, l'analyse par plasma inductif, la diffraction par rayon-X sous
atmosphere inerte, et la microscopie electronique a balayage ont ete utilisees pour l'Etude de la
compatibility entre le compartiment anodique et les compositions catholytiques (823 ± 10 °K,
1,00 ± 0,01 MPa). Les compositions catholytiques Etaient fondees sur le systEme
quasi-ternaire H2-Na4B2Qs-Na2BHs (50mol% NaH
-NaBH4)et un design du compartiment anodique
d'hydrolyse Electrochimique inverse a support metallique a Ete choisi. L'anode d'oxyde de fer
et nickel, et les poudres de l'electrolyte solide a anion oxygene d'oxyde de cerium et de
LaGaC
>3& structure perovskite utilisees pour la projection par plasma inductif de suspensions
du compartiment anodique d'hydrolyse Electrochimique inverse a support mEtallique ont EtE
prepares en utilisant le procEdE au nitrate de glycine. Le solvant, le substrat, le traitement
thermique aprEs dEpot, et le type de support du substrat Etaient les parametres variables clEs
lors de l'optimisation de la projection par plasma inductif de suspensions.
En raison des phEnomEnes intrinseques de micro et macro fissuration, les procEdEs de
dEpot par projection thermique tels que la projection par plasma inductif de suspensions
demandent encore une optimisation pour etre adaptEs a la fabrication de compartiments
anodiques pour la combustion Electrochimique inverse et l'hydrolyse Electrochimique inverse,
requis pour une Etude Electrochimique fondamentale.
ConsidErant la remarquable conductivitE spEciftque du LSGFM a ~ 673 °K, un design
de compartiment anodique a base d'electrolyte solide a anion oxygene pour la combustion
Electrochimique inverse ou l'hydrolyse Electrochimique inverse devrait etre utilisE pour une
Etude fondamentale de leur comportement dans les systEmes anhydres de Na
+,B
3+,H
+/H",0
2"
liquide sous pression ambiante de H2. II a EtE dEterminE que le LSGFM Etait rEactif face a ces
compositions catholytiques et l'Electrolyte solide k anion oxygEne de LaGaOj ne devrait pas
etre en contact direct avec ces mElanges non plus. Ainsi, une fine couche de protection
supplEmentaire, possiblement un Electrolyte solide a anion oxygEne de zircone stabilisEe au
scandium, serait nEcessaire, mais les Etudes de compatibi 1 itE/solubi 1 itE font defaut. Ce
domaine gEnEral d'Etude est encore peu explore.
Mots-clEs:
ABSTRACT
This work presents theoretical and experimental findings pertaining to the possible
replacement of conventional, automotive fuels by solid, light alkaline-metal borohydrides
(IM
+,B
3+/H"). On a complete oxidation basis, and under certain arrangements, the latter fuels
have volumetric energy capacities that exceed the most recognized, automotive constraints;
furthermore, the solid metal oxide products (EM
+,B
3+/0
2) have the potential to be regenerated
off-board to their respective hydrides via electrolytic reverse complete oxidation processes.
Electrolytic reverse complete oxidation processes are conceptualized as water
electrolysis and electrolytic reverse combustion or electrolytic reverse hydrolysis unit
operations in series. To more clearly express these mostly electrochemical fuel-cycles, a
thermodynamic reaction model was contrived.
To investigate the electrolytic reverse hydrolysis hypothesis, attempts were made to
prepare metal-supported, electrolytic reverse hydrolysis anode compartments. The glycine
nitrate process facilitated the synthesis of nickel iron oxide (anode) and select doped ceria
fluorite and double-doped LaGaC
>3perovskite (solid oxygen anion electrolytes) powders.
Hydridic electrolyte compositions belonging to the Na2BHs-Na4B205 quasi-binary system
were synthesized from NaH, NaBH4 and NaBC^. Analyses for the materials' compatibilities
and solubilities studies (823 ± 10 °K, 1.00 ± 0.01 MPa) included induction coupled plasma,
inert x-ray diffraction, and scanning electron microscopy.
NaH reduces magnetite to austenite; hence, the most promising solid oxygen anion
electrolyte, Lao.7Sro3Gao.7Feo3Mgo.iC>3.5 (LSGFM), cannot be in direct contact with these
hydridic electrolytes. The other oxides of La0.sSr0.2Ga0.8Mgo.203_s are significantly soluble in
these melts, but either a quenching or an electrochemical technique will be required to more
accurately assess their values.
For the preparation of small, metal-supported, electrolytic reverse hydrolysis anode
compartments, suspension plasma spraying was used for the depositions of the anode and solid
oxygen anion electrolyte layers. Energy dispersive x-ray spectroscopy, scanning electron
microscopy, and x-ray diffraction were used for the analyses of the resultant coatings'
characteristics.
In consequence of LSGFM's remarkable specific conductivity at ~ 673 °K, a solid
oxygen anion electrolyte-supported, electrolytic reverse combustion or electrolytic reverse
hydrolysis anode compartment design may be considered, but this will require the addition of
a protective, solid oxygen anion electrolyte layer. The thermodynamic analyses has identified
scandia stabilized zirconia as the most auspicious solid oxygen anion electrolyte; hence,
understanding the nature of the anhydrous Sc
+,Zr
4+,B
3+,Na
+,H
+/H",0
2" system at 723 ± 50 °K
and < 1.0 MPa is paramount to further efforts regarding electrolytic reverse hydrolysis or
electrolytic reverse combustion proof-of-concept studies.
Keywords:
hydrogen storage; molten salts; radio-frequency induction-coupled
suspension-plasma-spraying; solid oxide electrolytes
ACKNOWLEDGEMENTS
I owe a special debt of gratitude to B. Davis and A. Roy of Kingston Process
Metallurgy Inc. for all of their financial support, forbearance, and mentorship since 2003. The
ERCO concepts would not have been developed without their help. I am also indebted to
Professor F. Gitzhofer for affording me the opportunity to work on the ERCO concepts at the
Centre de recherche en energie, plasma et electrochimie and to Professors G. Brisard and A.
Lasia for their efforts throughout the duration of this project. As well, technicians F. Barrette,
S. Gutierrez, B. Couture, J. Gagne, K. Bere, P. Poulin, A. Grant, K. Gholshani, I.
Kelsey-Leveque and N. Simard, along with administrators F. Auclaire, S. Lebrun, L. Chapdelaine, and
L. Carbonneau, were also instrumental in the manifestation of this work, and their efforts are
warmly recognized. Not least of all, I am infinitely thankful for all the love, support,
understanding, and five-star meals that my parents, John and Paula, bombarded me with
during the write-up portion of this project.
The majority of the financial support for this project came through the AUT021 power
trains sub-program (D304-DHD) and NSERC's Industrial Postgraduate Scholarship award.
TABLE OF CONTENTS
RESUME
i
ABSTRACT
ii
ACKNOWLEDGEMENTS
iii
TABLE OF CONTENTS
iv
FIGURE CAPTIONS
vii
LIST OF TABLES
xiv
NOMENCLATURE
xv
ABBREVIATIONS
xvii
1
INTRODUCTION
1
2
BIBLIOGRAPHIC REVIEWS
15
2.1
Regeneration of NaBHU from NaB02
15
2.2
Technologies and investigation relative to ERH and ERC
15
2.2.1
Molten salt -
solid oxygen anion electrolyte, electrolytic
processes
15
2.2.2
Electrochemistry implicating the hydrogen anion
19
2.2.3
Solid oxygen anion electrolytes
21
2.3
Thermodynamic assessment of an ERCO process
25
2.4
Mass transfer analyses of hypothetical ERH and ERC cells
30
2.4.1
Hydrogen mass transfer to the cathode
31
2.4.2
O
2" mass transfer
34
2.4.3
Overpotential assessment of hypothetical ERH and ERC
cells
36
2.5
Thermodynamic assessment of materials' compatibilities
38
2.6
Thermal spray deposition processes
44
2.6.1
Plasmas
44
2.6.2
TSDP technologies and characteristics
44
2.6.3
Plasma torch technologies
46
2.6.4
Radio-frequency induction-coupled suspension plasma
2.6.5
Preparation of integrated, metal-supported IT-SOFC by
TSDP
50
2.7
Conclusions from the bibliographic reviews
52
3
EXPERIMENTAL PROCEDURES AND APPARATUSES
54
3.1
Powder synthesis
54
3.1.1
The glycine nitrate process
54
3.2
Materials' compatibilities and solubilities testing
55
3.3
SPS for the preparation of ERH anode compartments
57
3.3.1
Design and preparation of ERH anode compartments
5 8
3.4
ERH experimental apparatus and protocols
59
3.4.1
ERH experimentation
61
3.5
Analyses
62
4
RESULTS AND DISCUSSION
65
4.1
Characterization of GNP powders
65
4.2
Hydridic electrolyte synthesis
70
4.3
On materials' compatibilities and solubilities
74
4.3.1
Electronically insulating materials' compatibilities and
solubilities
75
4.3.2
Ionic conducting materials' compatibilities and solubilities.
78
4.4
Preparation of ERH anode compartments by SPS
87
4.4.1
Initial investigations of SPS
87
4.4.2
SPS on GKN™ porous metal filter substrates
105
4.4.3
SPS on ERH anode compartments having the pipe design..
116
4.4.4
SPS on ERH anode compartments having the NPT design..
119
4.5
Experimental attempts at ERH
132
5
CONCLUSIONS AND RECOMMENDATIONS
136
5.1
Conclusions en Fran§ais
136
5.2
Conclusions
139
5.3
Recommendations
141
BIBLIOGRAPHY
144
APPENDIX B: Na4B
20
5synthesis
183
APPENDIX C: GNP materials and protocols
187
APPENDIX D: Designs and construction of apparatuses for molten salt
experimentation
189
APPENDIX E: Synthesis of hydridic electrolytes
203
APPENDIX F: Preparations for the investigations of materials'
compatibilities and solubilities
206
APPENDIX G: Materials and protocols for SPS
207
APPENDIX H: Protocols for the preparation of ERH anode
compartments
218
FIGURE CAPTIONS
Figure 1.1
USDoE's 2009 hydrogen storage system energy capacity
diagram
22
Figure 1.2
Fh's type-1 phase diagram
62
Figure 1.3
Observed gravimetric energy capacities of metal hydrides with
their respective H2 release and sorption temperatures
24
Figure 1.4
Schematic for the crude flow diagram of the ideal, vehicular,
chemical hydride, complete oxidation process - hydrolysis
reactor (HR); vehicular hydrogen fuel cell (VHFC)
6
Figure 1.5
Schematic of the crude flow diagram of a hybrid, vehicular,
chemical hydride, complete oxidation process - hydrolysis
reactor (HR); vehicular hydrogen fuel cell (VHFC);
compressed hydrogen storage vessel (CH2), water condenser
(C) and storage
(H2O)7
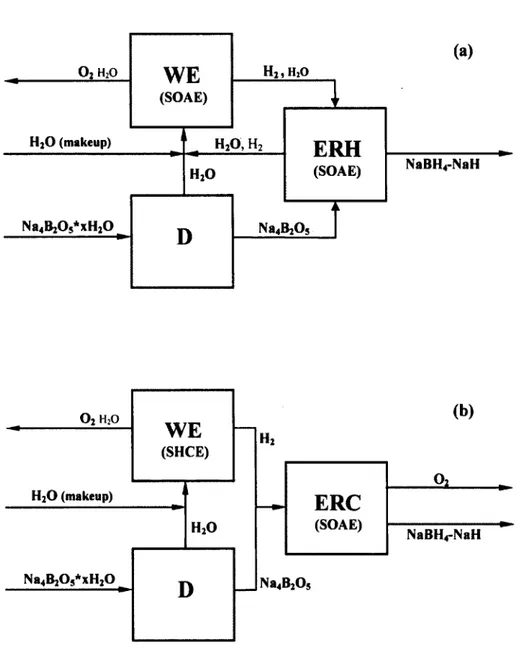
Figure 1.6
(a) Schematic of an ERH cell illustrating the production of
H2O and Na2BH5 from H
2and Na4B20
5; (b) Schematic of an
ERC cell illustrating the production of O2 and Na2BHs from H2
and N846205
9
Figure 1.7
Block diagrams for steady state, ERCO processes (~1.0 MPa;
~823 °K) -
(a) ERH based process; (b) ERC based process
10
Figure 1.8
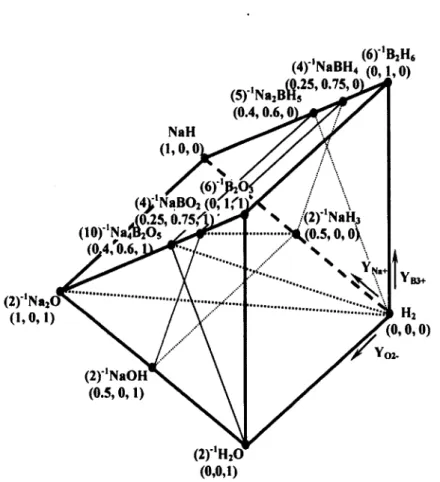
Isothermal, isobaric, elemental, equivalent, quaternary,
composition triangular-prism for the Na
+,B
3+,H
+/H',0
2' system
defined by the
(YNa+,YB3+,Yo2-)EEIF coordinate system
12Figure 1.9
General design
for a metal-supported,
ERH anode
compartment
13
Figure 2.1
General schematic of the molten salt - solid oxygen anion
electrolyte, electrolytic
processes investigated
by the
University of Boston
17
Figure 2.2
Experimental set-up for the molten salt - solid oxygen anion
electrolyte, electrolytic process for the production of calcium
metal
6518
Figure 2.3
Arrhenius plots for relevant SOAEs
11725
Figure 2.4
Calculated potentials (V) that are relevant to the Na
2BH
5-Na4B20
5ERH and ERC processes (0.1 MPa)) plotted as a
function of temperature
28
Figure 2.5
Relevant liquidus topology
29of the anhydrous Na
+,B
3+/H",0
2"
(EEIF) system at 1.55 ± 0.01 MPa
(H2)with isotherms given
in ± 5 °C
29
Figure 2.6
General circuit model for ERH or ERC cells
31
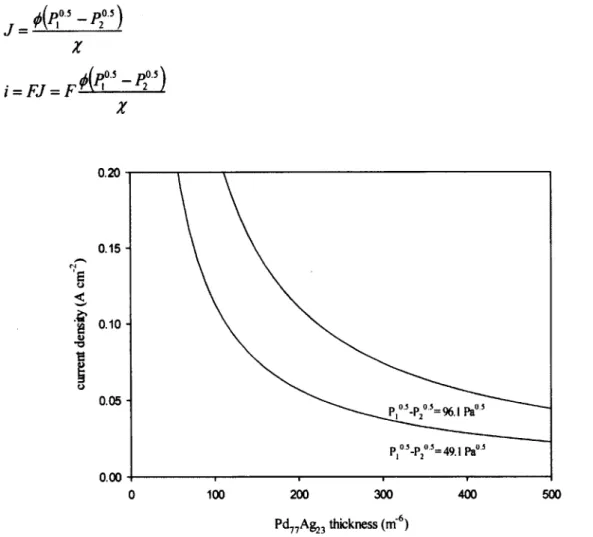
Figure 2.7
ERH and ERC cells' current density dependence on Pd77Ag23
layer thicknesses for two pressure differential values (2-25)
33
Figure 2.8
Overpotentials plotted as a function of SOAE support
thickness for the examples whereby LSGFM-supported, ERH
and ERC cells (823 °K, 0.1 MPa) having molten salt layer
thicknesses of 1 and 2 mm are operated at 0.1 A cm"
237
Figure 2.9
Isothermal, isobaric, quaternary, composition triangular-prism
for the anhydrous Na
+,B
3+,M
q+/0
2\H" system
40
Figure 2.10
Maximum power of complete oxidation to power of heat
dissipation ratios' dependencies on MeOH and C15H32 flow
rates - 45% overall plasma circuit efficiency operating at 50
kW plate power
50
Figure 3.1
Schematic of the arrangement used for the synthesis of GNP
powders
55
Figure 3.2
Schematics for materials' compatibilities and solubilities
testing arrangements A, B, and C
57
Figure 3.3
Cross-sectional schematic of the apparatus used for SPS - (1)
electrically-grounded water-cooled mask; (2) copper plaque;
(3) SS304 water-cooled substrate holder; (4) double-walled,
aluminum, water-cooled jacket; (5) flexible SS316 hose; (6)
dielectric fitting; (7) Teflon nipple; (8) metallic adapter
58
Figure 3.4
Cross sectional schematics of the metal-supported, ERH anode
compartments substrates -
(a) pipe design; (b) NPT design
59
Figure 3.5
Schematic of the experimental set-up used for ERH
experimentation - OT - over-flow trap; PV - precision needle
valve; I - electronically insulating Swagelok™ high-pressure
thermoplastic hose; PT - pressure transducer; FA - flash
arrestor; PC - personal computer
Experimental arrangement used for OCV measurements
XRD patterns for GNP synthesized NFO powder before
(bottom) and after air sintering at 1773 ± 10 °K for 8 hrs
Analyses for GNP synthesized LaosSro^GaosMgo^Cta powder
- (a) XRD patterns before (bottom) and after air sintering for 6
hrs at 1523, 1623, and 1748 ± 10 °K; (b) EDS spectrum for
Lao.8Sro.2Gao 8Mgo,203^ after air sintering at 1748 ± 10 °K
Analyses for GNP synthesized Lao.
7Sro.3Gao.7Feo.2Mgo.i03.s
powder - (a) XRD patterns after GNP synthesis (bottom) and
after air sintering for 8 hrs at 1748 ± 10 °K; (b) EDS spectrum
after air sintering at 1748 ± 10 °K for 8 hrs; (c) SEM
micrograph after GNP; (d) SEM micrograph after air sintering
at 1623 ± 10 °K for 8 hrs; (e) SEM micrograph after air
sintering at 1748 ± 10 °K for 8 hrs, pulverizing, and sieving to
dp <32nm
68
Figure 4.4
(a) XRD pattern for GNP synthesized Lao^Sro iGao.sMgo 203.8
powder and after air sintering at 1773 ± 10 °K for 8 hrs (b)
XRD patterns for GNP synthesized Smo^Ceo.sCh-g powder
before and after air sintering at 1773 ± 10 °K for 8 hrs
69
Figure 4.5
XRD pattern for GNP synthesized Smo sSro sCoC^ powder
before (bottom) and after air sintering at 1323±10 °K for 12
hrs
70
Figure 4.6
XRD pattern of NaBCh following the dehydration of reagent
grade NaB02*4H20
71
Figure 4.7
Photos of MSii (Table DE.l) after stability test f (Table 4.2)
-(a)-(b) condensations in the pressure vessel's headspace;
(c)-Figure 3.6
Figure 4.1
Figure 4.2
Figure 4.3
60
64
6667
(d)
mixture
following
the
manipulation
from
its
crucible
72
Figure 4.8
Photos of MSiv (Table E.l) following its synthesis and before
further use in material's compatibilities and solubilities
experiments (Table 4.2)
73
Figure 4.9
Photos of MSiv (Table E.l) after test g (Table 4.2)
80
Figure 4.10
ICP atomic solubility measurements (ppm) of SOAE materials
corresponding to the test conditions given in Table 4.2 - (a)
circles - a, diamonds - b, squares -
c, open hexagons - d, half
circles - e; (b) tests i -1 are noted in the figure
81
Figure 4.11
ICP atomic solubility measurements (ppm) of LSGFM's
components (Table 4.2) as a function of the large copper
crucibles' depths indicated by diamonds (tops), squares
(middles), circles (bottoms) -
(a) test f; (b) test g
81
Figure 4.12
SEM micrographs (cross sections) of LSGFM sintered disc
after exposure to the hydridic electrolytes (Table 4.2) - (a) test
a; (b) test b; their corresponding EDS, elemental line-scans are
given in the respective bottom panels
82
Figure 4.13
(a) Top section XRD pattern of the LSGFM sintered disc after
test a (Table 4.2); (b) XRD pattern of LSGM powder from its
ground disc after test d (Table 4.2)
83
Figure 4.14
(a) Inert-XRD patterns of the samples collected above (top), at
(middle), and below (bottom) the catholyte-LSGFM interface
after test g (Table 4.2); (b) Inert-XRD patterns of the samples
collected above (top), at (middle), and below (bottom) the
catholyte-LSGFM interface after test f (Table 4.2)
84
Figure 4.15
Analyses of U'VAhOj before (left panels) and after (right
panels) test p (Table 4.2) - (a)-(b) SEM micrographs (top
section); (c)-(d) EDS spectra (top sections); (e)-(f) XRD
patterns (top sections)
86
Figure 4.16
Analyses for deposition i (Table 4.4) - (a)-(c) SEM
micrographs (top section); (d) EDS elemental spectrum (top
section)
89
Figure 4.17
Analyses for deposition ii (Table 4.4) - (a)-(b) SEM
micrographs (cross section); (c) SEM micrograph (top section)
(d) EDS elemental spectrum (top section)
90
Figure 4.18
Analyses for deposition iii (Table 4.4) - (a, b) SEM
micrographs (top section); (c) SEM micrograph (cross
section)
91
Figure 4.19
Analyses for deposition iv (Table 4.4) - (a)-(b) SEM
micrographs (top section); (d) SEM micrograph (cross
section); (e) EDS elemental spectrum (top section)
92
Figure 4.20
Analyses for deposition v (Table 4.4) - (a)-(b) SEM
micrographs (top section); (c)-(d) SEM micrograph (cross
section); (e) EDS spectrum (top section)
94
Figure 4.21
Analyses for deposition vi (Table 4.4) - (a)-(c) SEM
Figure 4.22
Analyses for deposition vii (Table 4.4) - (a)-(b) SEM
micrographs (top section); (c)-(d) SEM micrographs (cross
section)
96
Figure 4.23
Analyses for deposition viii (Table 4.4) - (a)-(b) SEM
micrographs (cross section); (c)-(d) SEM micrographs (cross
section); (e) EDS spectrum (top section)
97
Figure 4.24
Analyses for deposition ix (Table 4.4) - (a)-(b) SEM
micrographs (top section); (c)-(d) SEM micrographs (cross
section)
98
Figure 4.25
Analyses for deposition x (Table 4.4) - (a)-(b) SEM
micrographs (top section); (c)-(d) SEM micrographs (cross
section); (e) EDS elemental spectrum (top section)
99
Figure 4.26
Analyses for deposition xi (Table 4.4) - (a)-(f) SEM
micrographs (top sections)
100
Figure 4.27
Analyses for deposition xii (Table 4.4) - (a)-(d) SEM
micrographs (top section)
101
Figure 4.28
Analyses for deposition xiii (Table 4.4) - (a)-(c) SEM
micrographs (cross section)
102
Figure 4.29
Analyses for deposition xiv (Table 4.4) - (a)-(c) SEM
micrographs (cross section)
103
Figure 4.30
Analyses for deposition xv (Table 4.4) - (a)-(c) SEM
micrographs (cross section)
104
Figure 4.31
Analyses for deposition i (Table 4.5) - (a) SEM micrographs
(cross section); (b) EDS spectrum of the LSGFM layer (cross
section)
107
Figure 4.32
Analyses for deposition ii (Table 4.5) - (a)-(c) SEM
micrographs (top section)
108
Figure 4.33
Analyses for deposition iii (Table 4.5) - (a) EDS, elemental
spectrum of the LSGFM layer (cross section); (b) SEM
micrograph (cross section); EDS,elemental mapping of the
elements Fe (Kal), Ga(Lal,2), Ni (Kal), O (Lai), and Sr(Lal)
109
Figure 4.34
Analyses for deposition iv (Table 4.5) - (a)-(f) SEM
micrographs (top section)
110
Figure 4.35
Analyses for deposition v (Table 4.5) - (a)-(d) SEM
micrographs (top section)
111
Figure 4.36
Analyses for deposition vi (Table 4.5) - (a)-(d) SEM
micrographs (top section)
112
Figure 4.37
Analyses for deposition vi (Table 4.5) - (a)-(d) SEM
micrographs (top section); (e)-(f) SEM micrographs (cross
section)
113
Figure 4.38
Analyses for deposition vii (Table 4.5) - (a) SEM micrographs
(cross section); (b) XRD pattern (top section); EDS elemental
line-scans for the composition line shown in (a) are given in
the bottom panels
114
Figure 4.39
Analyses for deposition viii (Table 4.5) - (a)-(d) SEM
micrograph (cross section)
115
design after multi-layer depositions by SPS (Table
4.6)
117
Figure 4.41
Analyses for deposition i (Table 4.7) -
(a-d) SEM micrographs
(top section)
121
Figure 4.42
Analyses for deposition ii (Table 4.7) following the OCV
testing -
(a)-(d) SEM micrographs (top section)
122
Figure 4.43
Analyses for deposition iii (Table 4.7) - (a)-(f) SEM
micrographs (cross section)
123
Figure 4.44
Analyses for deposition iv (Table 4.7) - (a)-(d) SEM
micrographs (top section); (e)-(h) SEM micrographs (cross
section)
124
Figure 4.45
Analyses for deposition v (Table 4.7) - (a)-(d) SEM
micrographs (top section); (e-h) SEM micrographs (cross
section)
126
Figure 4.46
Analyses for deposition vi (Table 4.7) - (a)-(f) SEM
micrographs (cross section)
127
Figure 4.47
Analyses for deposition vii (Table 4.7) - (a-g) SEM
micrographs (cross section); (h) XRD pattern (top section)
129
Figure 4.48
Analyses for deposition viii (Table 4.7) - (a)-(d) SEM
micrographs (top section)
130
Figure 4.49
Current responses to an applied voltage of 0.175-0.46 V as a
function of time during ERH experiment operated at 748 ±10
133
°K and 1.00 ±0.01 MPa(H
2)
Figure 4.50
Photographs of the ERH anode compartment before (a) and
after (b)-(d) ERH experimentation
134
Figure A. 1
Isothermal, isobaric, reciprocal ternary composition square
depicting the definite elemental formal charge lost and gained
during water formation
164
Figure A.2
Isothermal, isobaric, elemental, ternary composition triangle
for the Na-O-H shown on atomic percent concentration scale...
172
Figure A.3
Isothermal,
isobaric,
elemental,
equivalent,
ternary
composition triangle for the Na-O-H system shown on the
EEIF concentration scale
173
Figure A.4
Isothermal, isobaric, elemental, equivalent, reciprocal ternary
composition square for the Na
+,H
+/H",0
2" system shown on the
EEIF concentration scale
174
Figure A.5
Sketch showing the equivalence between the galvanic
hydrolysis and compound formation (Table A.l) cells at
isothermal, isobaric conditions
176
Figure A.6
Isothermal,
isobaric,
two-element,
equivalent,
ternary
reciprocal composition square for the Na
+-0-H system
178
Figure A.7
Sketch showing the equivalence between
(nml"'
s"""AE° and the
standard potentials of compound formation (Table 1 .A) cells at
179
at isothermal, isobaric conditions
Figure A.8
Isothermal, isobaric elemental, equivalent, ternary composition
triangle for the (Na2B=X)-0-H system using the EEIF
184
185
190
191
192
193
194
195
197
198
199
200
201202
206207
208209
210211
212213
214
215
216(a) XRD patterns obtained following the attempted synthesis
of pure Na20 (B-la) as a function of soaking temperature
(600, 643, and 873 ± 10°K-bottom to top); (b)
NaaBCh-Na4B2C>5 mixture obtained via (B-lc)
(a) XRD patterns for the samples taken from the top (top) and
bottom (middle) portions of the copper crucible after
hydrolyzing (n^o/ n
Na2BH5 ~ 4) and heating Na2BHs to 648 ±
10 °K and after subsequently heating it to 733°K ± 10 °K
(bottom) under vacuum; (b) inert-XRD patterns of the reheated
(1023 ± 10 °K) and non-reheated (bottom) samples following
their vacuum filtration with ethylenediamine
Glove-box as found (left); set-up for ERH experimentation
(right)
Solidworks™ drawing of the assembled glove-box's custom
pot
Solidworks™ drawing of the custom pot's cooling coil's top
piece
Solidworks™ drawing of the custom pot's body
Solidworks™ drawing of the custom pot's end cap
Solidworks™ drawing of the custom pot's cooling coil's
bottom piece
Solidworks™ drawing of the assembled pressure-vessel
Solidworks™ drawing of pressure-vessel s body
Solidworks™ drawing of pressure-vessel end-cap
Solidworks™ drawing of pressure-vessel's lid
Solidworks™ drawing of pressure-vessel's flange...
Solidworks™ drawing of pressure-vessel's cooling coil
Photo of the deposition chamber's interior
Cross view schematic of the PL-50 Tekna™ plasma torch
Solidworks™ drawings of the assembled custom insulated
sample holder
Solidworks™ drawings of the insulated sample holder's SS
body
Solidworks™ drawings of the insulated sample holder's
Teflon interior
Solidworks™ drawings of the insulated sample holder's
copper plaque
Solidworks™ drawings of insulated sample holder's SS
adapter
Solidworks™ drawing of the electrically insulated sample
holder's double-walled, aluminum, cooling-jacket
Solidworks™ drawing of the double-walled, aluminum
cooling-jacket's back-end cap
Solidworks™ drawing of the double-walled, aluminum
cooling-jacket's front-end cap
SPS atomization probes A (left) and B (right)
was used as the ERH anode compartments' substrates
219
Figure 1.1
Schematic of an experimental set-up for ERC -
OT - over-flow
trap; PV - precision needle valve; I - electronically insulating
Swagelok high-pressure thermoplastic hose; PT - pressure
LIST OF TABLES
Table 1.1
Calculated net energy capacities of pure and variably hydrolyzed
Na
2BH
58
Table 2.1
Decomposition
temperatures
of
relevant
hydrides
and
borohydrides (0.1 MPa)
40
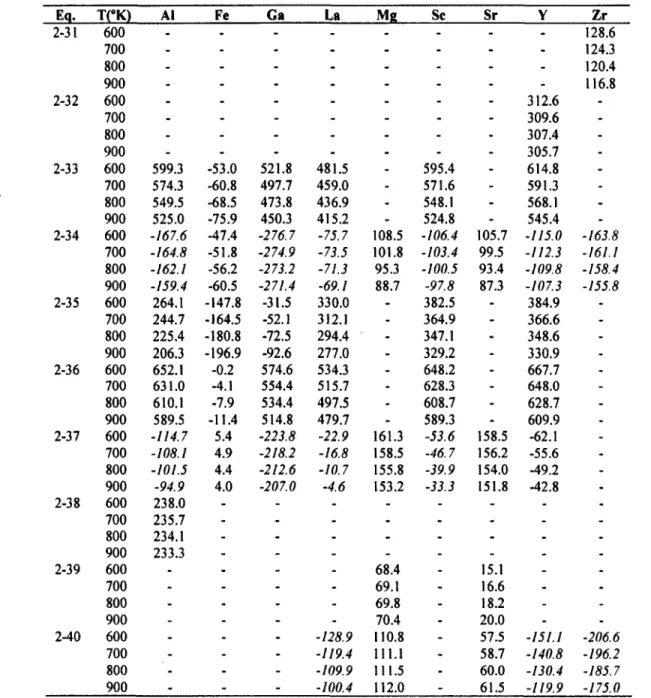
Table 2.2
Temperature dependent Gibbs energy of reaction (kJ) for (231)
-(2-40) for the metals Al, Fe, Ga, La, Mg, Sc, Sr, Y, and
Zr
41
Table 2.3
Temperature dependence of standard formation and metal
combustion potentials of relevant oxides (0.1 MPa)
42
Table 3.1
Constant values of SPS parameters
57
Table 4.1
Electronically insulating materials' compatibilities and solubilities
testing summary (823 ± 10 °K, 1.00 ± 0.01 MPa (H2))
75
Table 4.2
Ionic conducting materials' compatibilities and solubilities testing
summary (823 ± 10 °K, 1.00 ± 0.01 MPa (H
2))
78
Table 4.3
XRD data for the compound Na^Osth (Cu Ka)
84
Table 4.4
Summary of the varied parameters' values during the initial SPS
and
RF,
induction
coupled,
vacuum,
solution,
plasma
optimization
88
Table 4.5
Summary of the varied parameters' values for the SPS of dense,
ceramic layers on GKN™ porous metal filters
106
Table 4.6
Summary of the varied parameters' values during the SPS of ERH
anode compartments having the pipe design
116
Table 4.7
Summary of the varied parameters' values during the SPS of ERH
anode compartments having the NPT design
119
Table A.l
Sketches of the possible galvanic cell configurations for the binary
compounds of the Na-H-0 system depending on the type of solid
electrolyte with the general amphoteric notation shown in the
bottom panels
171
Table C.l
TECs for the ERC and ERH anode compartment materials
188
Table C.2
Commercial materials used for the GNP
188
Table E.l
Synthesized hydridic electrolytes belonging to the
NOMENCLATURE
A
Area
m
2
<*,
Activity of species i
a..
Oxygen anion vacancy's jump distance
m
B
pre-exponential factor
cm s
-1
C
logarithm of activities term in the MNE
CPi
Heat capacity of species i
J mof
1°K''
D,
Diffusion coefficient of species i
cm
2s"
1d
wPressure vessel's wall thickness
m
E
nNernst potential
JC"
1E
AppliedApplied potential
J C
1iJ
AE
Potential difference for compound formation
cell
J C
1iJ
AE°
f,
standard potential difference for compound
formation cell
fugacity of species i
J C
1F
Faraday's constant
96485C mol"
1AG
m
mGibbs energy of oxygen anion vacancy
migration
J mol"
1&
Grxn
Gibbs energy of reaction
J mol"
1standard Gibbs energy of reaction
J mol"
1A G*»
rxn
Equivalent Gibbs energy of reaction
J mol"
1ag;;:
rXnEquivalent standard Gibbs energy of reaction
J mol"
1AH***
molar enthalpy of fusion
J mol"
1I Cell
Current
A
'ionic
current density
A cm'
2J
molar flux
mol cm"
2s"
1k
Boltzmann's constant
1.3807* 10"
16erg K"
equilibrium constant
I,
thickness of SOAE layer
cm
n
number of electrons
N
number of normal sites
"v
fraction of normal sites that are vacant
moles of charged species i
mol
»i
mole of species i
mol
of
)Afilled oxygen anion vacancy
Pk
metal hydride dissociation pressure
Pa
Pe
p0lR
natural gas constant
8.314 J moP
1°K"
R-
MTmass transfer resistance
Ohm
R
CTcharge transfer resistance
Ohm
D
e"•SOAK
SOAE electronic resistance
Ohm
R
MS°molten salt electronic resistance
Ohm
Rj
molten salt ionic resistance
Ohm
p
'
"SOAK
resistance of SOAE layer i
Ohm
*,
transference number of species i
T
absolute temperature
°K
T dec
hydride's absolute decomposition temperature
°K
VZ
oxygen anion vacancy
mol
X,
elemental ionic fraction of species i
mole fraction of molecular species i
elemental equivalent ionic fraction of charged'
species i
Greek symbols
e
tensile strength
Pa
Pi
density of species i
kg m"
3®ionic
specific conductivity of V"
AS cm'
1Mi
chemical potential of species i
J mol"
1Mi
electrochemical potential of ionic charged
J mol"
1Mi
species i
M
OAVmobility of oxygen anion vacancy
mV V'
1V
debye frequency
s"
1VOAV
oxygen anion vacancy's drift velocity
m s"
1X
Membrane thickness
m
8
diffusion layer thickness
cm
ABBREVIATIONS
CH2
compressed H2
EEIF
elemental equivalent ionic fractions
ERC
electrolytic reverse combustion
ERH
electrolytic reverse hydrolysis
ERCO
electrolytic reverse complete oxidation
GNP
glycine nitrate process
ICE
internal combustion engine
ICP
inductively coupled plasma
IT-SOFC
intermediate temperature, solid oxide, fuel cell
LH2
liquid H2
LHV
hh's lower heating value
MNE
modified Nernst equation
SPS
radio-frequency, induction-coupled, oxygen-fuel, vacuum,
suspension plasma spraying
SEM
scanning electron microscopy
SHCE
solid hydrogen cation electrolyte
SOAE
solid oxygen anion electrolyte
SSCE
solid sodium cation electrolyte
TEC
thermal expansion coefficient
TSDP
thermal spray deposition process
USDoE
United States Department of Energy
WE
water electrolysis
1 INTRODUCTION
In 2003, the United States Department of Energy's (USDoE) Office of Energy
Efficiency and Renewable Energy launched the FreedomCAR and Fuel Partnership Program.
The program's focus is on identifying and solving the preeminent problems impeding the
widespread acceptance of electric or alternatively-powered vehicles so that, by 2015, the
original automotive equipment manufacturers will find it technically and economically
feasible for 90% of the current, North American, light-duty vehicles to be substituted by
alternative analogues. Thus far, if compared to the general target of > 500 km charge"
1, the
most obvious deficiency of all alternative vehicles has been their comparatively shorter
driving ranges. The general program's first report
1identified vehicular hydrogen storage as
being the most technically challenging, hydrogen-related sub-program. The sub-program has
been useful in defining key parameters and assigning target values thereon
2. In contrast,
considerable progress has been made in the hydrogen sub-program designated for vehicular
hydrogen fuel cells
3(VHFC).
While considering a hydrogen storage material for automotive applications, its
hazardous and toxic nature along with its cost are of paramount concern; this is closely
followed by its energy capacities, both volumetric (kWh dm"
3) and gravimetric (kWh kg"
1),
with the former capacity being the more crucial. Energy capacities are calculated by dividing
the volume/mass of the maximum available, onboard, molecular hydrogen (H2) energy, which
is based on H2's lower heating value (LHV=33.3 kWh kg
H2"1),by the volume/mass of the
hydrogen storage material, its vessel, and auxiliary components (i.e. balance of plant). Energy
capacities for the state-of-the-art, hydrogen storage systems are shown in Figure 1.1 .
The ratios of the 2015 target volumetric and gravimetric energy capacities assigned in
2004
3to those given in 2009
4are 2.08 and 1.67, respectively. This seemingly drastic change
is supposedly due to: (i) the recent developments in vehicular hybridization; (ii) the test results
on actual as opposed to projected VHFC and hydrogen-powered internal combustion engine
(ICE) vehicle performance; and (iii) the original automotive equipment manufacturers' claims
that vehicular architecture is now more accommodating towards hydrogen storage systems.
Along with the updated 2015 energy capacity targets (1.3 kWh dm'
3and 1.8 kWh kg'
1), a new
(Ultimate) category, having ratios as just defined of 1.17 and 1.20, respectively, was assigned
in the most recent report
3.
Revised Alan* slurry system targets
€
|40<3
u 30 MOF-177 (250 bar) Ikjuid hydrogen * chemical hydride complex hydrld cryocompressed/no b.ir
350 Bar compressedhydioijen •
'Uartif D*MMu)mtiait*aenMi40wMclM
riauiim^ «<*>«•. fV09
C-sorcent* 3 4 5 6 Gravimetric Capacity (wt%)Figure 1.1 USDoE's 2009 hydrogen storage system energy capacity diagram
H2's type-1 phase diagram
5, given in Figure 1.2, demonstrates the material's narrow,
low temperature, liquid phase limits along with its low critical-point temperature (33 °K).
H Metal Liquid metai
g»» Critical po int f liquid Triplepoint solid .5 ,0 ,6 10"
10
10-10'
Temperature [K]The energy that is required to isothermally compress a gas from its initial pressure
( p
0) t o i t s f i n a l p r e s s u r e ( p ) c a n b e e s t i m a t e d f r o m t h e r e l a t i o n s h i p : A G = R T I n p j p
o,
where R and T denote the universal gas constant and the absolute temperature. For onboard,
compressed H2 (CH2) storage systems rated to 35 - 70 MPa, an additional ~ 6 % should be
included to account for irreversibilities and non-isothermal conditions; hence, if compared to
hh's LHV, the useful work required to compress H2 to the current vehicular, upper value of 70
MPa (2.21 kWh kg"
1) is low.
As the H2 pressure within a vessel increases, the system's gravimetric energy capacity
decreases; thus, it is impossible for this mode of hydrogen storage to achieve the USDoE's
energy capacity targets. Regardless, most of the Fh-powered, vehicle testing
2has been done
with CH2 contained in cylindrical, semi-spherical-capped vessels constructed of materials
having high tensile strengths (e). According to the relationship, d
w/d
a= Ap/(2e - Ap),
whered
a, d
w, and Apare the vessel's o.d., wall thickness, and pressure difference,
respectively, a CH2 vessel's volumetric energy capacity increases to a point, and then
decreases. Currently, vessel construction materials consist of carbon fiber and expensive
polymers (e.g. Kevlar™). For vessels rated to 35 MPa, materials' costs
7are in the order of
350 USD kg"
1and increase quasi-exponentially with further pressurization
8.
The theoretical and actual energies
9that are required to liquefy H2 are 3.23 and 15.2
kWh kg
H2"1.At 0.1 MPa, liquid fy's (LH2) density (Plh2 - 0.078 kg dm"
3) is approximately
one order of magnitude lower than those of conventional, liquid, transportation fuels, and on a
complete oxidation basis, one kilogram of H2 is approximately equivalent to one gallon of
gasoline
2. Therefore, the gasoline to LH2 volumetric energy capacity ratio is 3.8. Despite
these dreadful statistics, compared to CH2 storage sytems, the state-of-the-art,
cryo-compressed LH2 (plh2 < 0.088 kg dm"
3) systems have significantly lower capital costs and
meet the USDoE's revised, 2010 energy capacity targets (Figure 1.1). However, H2 boil-off,
which stems from the ingress of heat into the cryogenic vessel, is always significant.
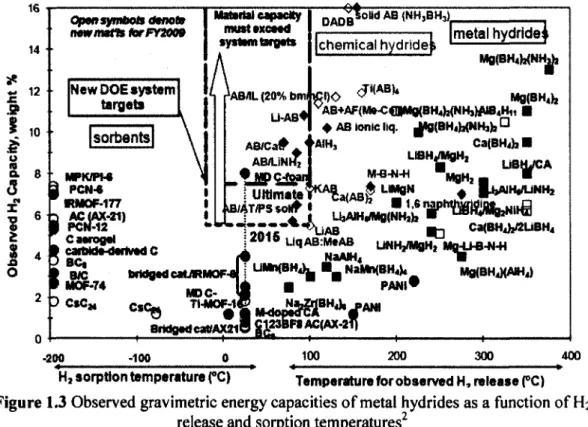
As certain light metal hydrides (e.g. LiH or LiBFU) theoretically have higher energy
capacities than either LH2 or CH2 (Figure 1.3), in recent decades, reversible metal hydrides
have been widely considered for transport applications. Metal hydride formations (i.e.
2
M
+ XH
2-> 2MH
X) are usually exothermic processes that are often represented by type-2,
pressure-composition, phase diagrams
5whereby composition, expressed in atomic percent,
and the logarithm of pressure are the abscissa and ordinate, respectively. A metal hydride's
dissociation pressure (p°
Hi) is defined as the pressure associated with obtaining a zero AGj
mat constant temperature. AH°
I(XNand
can be calculated by plotting In p°
Hiagainst T~
l(i.e. van't Hoff diagram) after measuring p°
Hjat several temperatures. An authoritative work
11was recently published on reversible metal hydride classifications, conventions, and
methodologies used in the measurement of their thermodynamic properties. Problems such as
low energy capacities, pyrophoric or toxic nature, high decomposition temperatures, and
hysteresis have prevented these materials from becoming automotive fuels. This mode to
vehicular hydrogen storage also requires an auxiliary heat exchange system for the removal
and addition of heat to the metal hydride's bed during the exothermic H2 release and
endothermic H2 uptake processes. Figure 1.3 indicates that reversible metal hydrides are
restricted to the light metals (i.e. Li, B, Na, Mg, K, Al, and Ca). Contemporary reviews on
some of the more promising materials are available
12'
13.
16 14
*
~ 12%
I o 10 a 10 • 8-3
M
|
"
X£
I
OOpen
symbols
denote new metistorFY2009
Material capacity must exceed system targets
New DOE system targets sorbents MPK/PK PCN-6 RMOF-177 AC (AX-21) PCN-12 C aerogel cafbMe-dertved C BC, B/C MOF-74 W/IL (20% bm ^qo U-AB«
chemical hydride^ metal hydride^
M8(8H
4),
AB^AF{Me«ipig(BH4)t(NH,MUB4Hii !
• AB ionic liq. JHKBHtMNHbfe 0
AB/Ca^^fAIH, Ca(BH4)j • LmH1F* LiBHVCA J«*H MJ,H2 - • alAflf "P* • *bA,H«/LjNHl AB/LiNHi Ultima kB/AT/PSSO# • !---•* A UjAIHt/MgfNH})} oftic UAB Bf] ;201S LiqAB:M«AB uNH^MgHT NaAJH4 2 3 CSC*
Ca(BHih/2i-iBH
4 M^U-B-N-Hbridged catARMOF-J I ulto(BH^| • NaM^BH^ Mg(BH4)(AM4)
NBC « • PANt#
CsC
©
™IOM|
™ C123BF8AC(AX-21)
t I t
-200
-100
100 200 300 400H» sorption temperature (°C) Temperature for observed H, release PC)
Figure 1.3 Observed gravimetric energy capacities of metal hydrides as a function of H2
release and sorption temperatures
2Ammonia borane
(H3NBH3)and alane
(AIH3)were recently defined by the USDoE as
off-board, regenerable metal hydrides
14.
Like reversible metal hydrides, this mode of
vehicular H2 production occurs via the metal hydride's thermal decomposition; however,
because of complex chemistry and extreme pressurization requirements, the regeneration
process must be done off-board. The USDoE's report
15on the regeneration of
H3NBH3and
AIH3indicates that straightforward processes do not exist. These materials are pyrophoric and
slowly decompose at ambient pressure.
Chemical or irreversible hydrides
4were terms used by the USDoE between 2004 and
2007. They referred to vehicular H2 production via the hydrolysis of metal hydrides. Steam
(name of hydrocarbon) reformation and metal hydride hydrolysis are similar processes. They
are ones whereby, on an equivalent basis, M-H and 0 pairs rearrange themselves to form
H-H and M-0 pairs, where M, H-H, and O represents atomic metal, hydrogen and oxygen,
respectively. Most of the automotive studies regarding metal hydride hydrolysis implicate the
catalysis of caustic, aqueous solutions of sodium borohydride (NaBH4) to a hydrated sodium
metaborate (xH20*NaBC>2) species. A catalyst is required in order to overcome kinetic
barriers. An immense number of investigations of this topic are available
190.
In essence, metathesis reactions, which are also known as double decomposition or
reciprocal or exchange reactions, involve two "ionic compounds", wherefore, upon their
mixing, without there being any net change in any of the elements' oxidation states, there is a
tendency towards stable pair formation; hence, (1-1) holds, where A and B are cations, C and
D are anions, andq
A, q
B, etc. are their respective absolute charges. If H2 is substituted by
H
+H\ and if the H that are nearest neighbours to O (i.e. H
20) and M are taken as H
+and H",
respectively, then this general relationship applies itself to hydrolysis processes. In regards
to NaBH4 hydrolysis (1-2)), by substitutingH
+- A , N a
++ Z?3+
= X
4+= B, H~=C, and
O
2' = D, from (1-2) into (1-1) we obtain (1-3).
(<7C
<1
BY
% + fotfo)"'M
DD(1
A(<?»?«)"' Bq
DDq
H+ {q
cq
AY Aq
cCq
A(4)"
1 NaBH4+ (2)"
1 H20 ->(4)"1 NaB0
2+ H
2{AY X
A+H;+(iy H+O
2-
—> (8)"'X\
+0]~
+H* H~
(1-2)
( 1 - 1 )In 2007, the USDoE suspended its funding of aqueous NaBfy - transportation fuel
projects
17.
None of the proposed vehicular H2 generation
18'
19or off-board hydride
regeneration
20"
25processes could meet the specified targets (energy capacities, recycling
efficiency, costs, etc.). There are two fundamental problems with this approach to vehicular,
H2 storage/generation: (i) NaBH4 is diluted by a solvent
(H2O);and (ii) at least three onboard
compartments (hydrolysis reactor, fuel, and waste) are required. Direct NaBHL( fuel cell
technologies
26'
27suffer from the same shortcomings.
On a chemical energy basis, the complete oxidation of certain solid, light
alkaline-metal borohydrides (£M
+,B
3+/H") resembles the status quo.
Several investigations of
hydrolysis reactors having solid NaBH4 as the fuel have recently been reported
31"
35. To
surpass the present-day, vehicular fuel system's volumetric/gravimetric energy capacities,
these unconventional fuels' vehicular, complete oxidation processes are strictly limited to
certain configurations. Figure 1.4 shows the schematic of the crude flow diagram of the ideal,
onboard, chemical hydride, complete oxidation process. The solid fuel's container is also its
hydrolysis reactor and the H2O required for its hydrolysis is supplied directly from the VHFC.
air
(02 rich)H
2O
iVHFC
HR
h
2air
(02 lean)Figure 1.4 Schematic of the crude flow diagram of the ideal, vehicular, chemical hydride,
complete oxidation process -
hydrolysis reactor (HR); vehicular hydrogen fuel cell (VHFC)
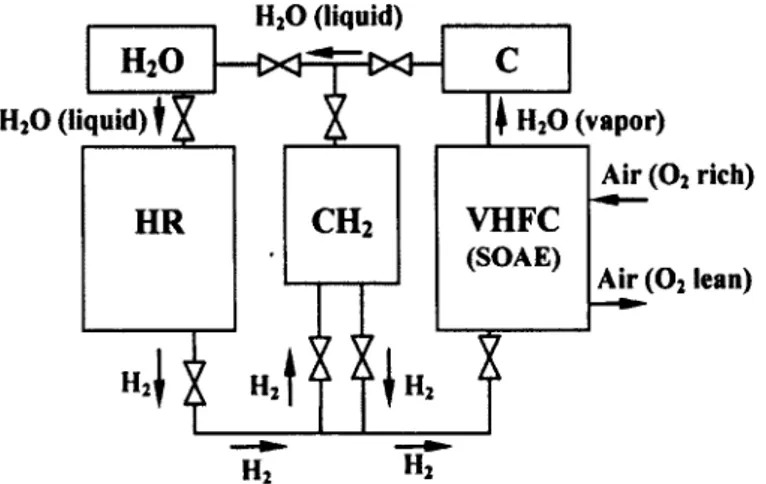
The schematic of the crude flow diagram of a hybrid, vehicular, chemical hydride,
complete oxidation process is given in Figure 1.5. A small vessel of CH2, a condenser, and a
storage vessel for H2O are incorporated into the ideal flow diagram; the most former's utility
is three-fold: (i) it ensures the initiation of H2O formation; (ii) it serves as a means to forcibly
pump H2O into the hydrolysis reactor/hydride bed; and (iii) it acts as a storage vessel for the
Hi produced in the hydrolysis reactor. Evidently, a VHFC based on solid oxygen anion
electrolytes (SOAEs), as opposed to solid hydrogen cation electrolytes (SHCEs), is preferable
for this mode of vehicular hydrogen storage.
H20 (liquid)
H
20 —X^FtXH
H,Q (liquid) fX | H20 (vapor)
Air (Oj rich)
Air (02 lean)
1
1 1
1
H;
VHFC
(SOAE)Hj
H
2Figure 1.5 Schematic of the crude flow diagram of a hybrid, vehicular, chemical hydride,
complete oxidation process - hydrolysis reactor (HR); vehicular hydrogen fuel cell (VHFC);
compressed hydrogen storage vessel (CH2); H2O condenser (C) and storage
(H2O)Consider the 50mol%NaH-NaBH4 (Na2BH
5) mixture that was previously remarked
upon
29. The ambient, facile hydrolysis of sodium hydride (NaH) (1-5), followed by the
exothermic process
37that occurs at elevated temperature (1-4), indicates that disodium oxide
(Na20) is a sort of catalyst for the hydrolysis of solid NaBUt (1-2).
(4)"' NaBH
4+ (4)"1 Na
20+(4)"1 H
20 -• (4)_l NaBO, + (2)"1 NaH+(2)"1 H
2(1 -4)
(2)"
1 NaH+(4)"1 H20 -> (4)_1 Na
20+(2)_l H
2(1-5)
Table 1.1 lists ^BHs's net energy capacities so that they can be compared with the
USDoE's targets (Figure 1.1). By assuming 100% conversion of the fuel's hydrolysis (1-6)
and complete oxidation (1-7) processes, the minimum and maximum amount of product mass
can be calculated. The USDoE's gravimetric energy capacity calculations for hydrogen
storage systems that gain weight during discharge includes the maximum possible weight of
the system; however, this constraint should not be considered as being crucial for transport
applications; rather, within reason, the fuel's initial volume and its respective oxide's density
should be of paramount concern. For this fuel mixture, in order to maintain the highest
volumetric energy capacity possible, while capturing the maximum amount of water for a
subsequent electrolytic reverse complete oxidation (ERCO) process, the ratio, n
Hi()/n
NaiBi()},
should not exceed a value of ~ 1.3. Beyond the USDoE's Ultimate target, the volumetric
energy capacity of pure Na2BH
5leaves 1.35 times the volume required for the fuel available
for the volume of the hydrolysis reactor and its auxiliary components. The efficient, onboard
hydrolysis of Na2BHs has not been explicitly reported on in the open literature; it poses as a
significant technical challenge that could only be superficially investigated here (Appendix B).
(5)"' Na
2BH
5+ (2)"' H
20 -> (l O)"
1Na
4B
2O
f+ H
2(1 -6)
(5)"
1Na
2BH
5+ (2)
_l0
2-> (l O)"
1Na
AB
2O
s+ (2)'
1H
20
(1 -7)
Table 1.1 Calculated net energy capacities of pure and variably hydrolyzed Na2BHs
Energy capacity
Na
2BH
5Na4B205
Na
4B
20
5*2H
20
Na
4B
20
5*5H
20
kg H
2kg"
116.3%
10.4%
8.8%
7.1%
kWh kg'
5.4
3.5
2.9
2.4
kg H2 dm"
30.16
0.26
0.13
0.09
kWh dm
35.4
8.5
4.3
T,39 / A A-. j .Jv
2.9
1 * net energy capacities have been calculated using the literature value densities of NaH (0.92 kg dm), NaBH4^107 kgdm"3), Na.BjO,4® (2.46 kg dm'3), and H20 (1.00 kg dm 3)
Reversible metal hydrides can also be considered as chemical hydrides. Their net
gravimetric energy capacities double if they are contemplated in this way. The same
procedure as the one used to obtain the energy capacity values in Table 2.1 applies.
An efficient process for regenerating metal hydrides from their respective oxides is not
readily available. Elucidation of such a method and attempts to perform proof-of-concept
thereon has been the author's principal preoccupation for several years. Amongst other
matters, this has included the clarification of the requirements pertaining to the electrolytic
reverse hydrolysis (ERH) and electrolytic reverse combustion (ERC) processes. The simplest
embodiments of the electrolytic regeneration of NaaBHs from Na4B20s are represented by the
schematics shown in Figure 1.6(a) (ERH) and Figure 1.6(b) (ERC), which are the reverse of
the processes given by (1-6) and (2-1*8), respectively. Recently, a general patent
191was
awarded for the former process. In theory, the concepts are exceedingly simple, and can be
described by the following: (i) the cathode is in contact with a solution of metal oxides with
their respective hydrides and dissolved H2; the most latter species is electro-reduced to hydride
ions (H ) and this invokes the reduction of the metal oxide species to oxygen anions (O ") and
its metal hydride species; (ii) a dense SOAE facilitates the transport of O
2" in the internal
circuit and negates molecular cross-over between a cell's two distinct compartments; hence,
the back-reaction is avoided; and (iii) either H2O vapour (ERH) or O2 gas (ERC) formation
occurs at the anode. These hypothetical processes are based on the assumption that the SOAE
and electrodes are non-reactive with and only very sparingly soluble in the electrolytic cell's
anolyte and catholyte. As variations on this theme are conceivable, other ERH and ERC
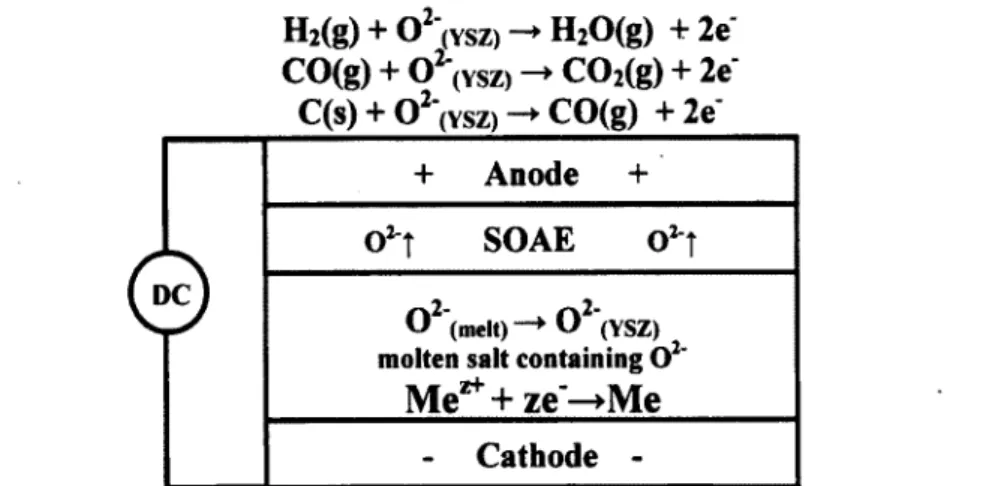
arrangements are given in (2-4).
j 5H, I f 5H20 f (a) le' + anode (porous) le' O2 f O2 f SOAE f O2 to2" le" - cathode (porous) 15H2 + Na4B20, t 4 2NaH+2NaBH4 ^ t (5/2) 02 f le' + anode (porous) le' O2 f O2" f SOAE f O2 f O2