HAL Id: hal-01519532
https://hal-amu.archives-ouvertes.fr/hal-01519532
Submitted on 13 Apr 2018
HAL is a multi-disciplinary open access
archive for the deposit and dissemination of
sci-entific research documents, whether they are
pub-lished or not. The documents may come from
teaching and research institutions in France or
abroad, or from public or private research centers.
L’archive ouverte pluridisciplinaire HAL, est
destinée au dépôt et à la diffusion de documents
scientifiques de niveau recherche, publiés ou non,
émanant des établissements d’enseignement et de
recherche français ou étrangers, des laboratoires
publics ou privés.
A network perspective reveals decreasing material
diversity in studies on nanoparticle interactions with
dissolved organic matter
Nicole Sani-Kast, Jérôme Labille, Patrick Ollivier, Danielle Slomberg, Konrad
Hungerbühler, Martin Scheringer
To cite this version:
Nicole Sani-Kast, Jérôme Labille, Patrick Ollivier, Danielle Slomberg, Konrad Hungerbühler, et al.. A
network perspective reveals decreasing material diversity in studies on nanoparticle interactions with
dissolved organic matter. Proceedings of the National Academy of Sciences of the United States of
America , National Academy of Sciences, 2017, 114 (10), pp.E1756-E1765. �10.1073/pnas.1608106114�.
�hal-01519532�
A network perspective reveals decreasing material
diversity in studies on nanoparticle interactions
with dissolved organic matter
Nicole Sani-Kasta, J ´er ˆome Labilleb,c, Patrick Ollivierd, Danielle Slombergb,c, Konrad Hungerb ¨uhlera,
and Martin Scheringera,e,1
aInstitute for Chemical and Bioengineering, Eidgen ¨ossische Technische Hochschule Z ¨urich, CH-8093 Zurich, Switzerland;bAix-Marseille Universit ´e, CNRS, Institut de Recherche pour le D ´eveloppement, Coll `ege de France, Centre Europ ´een de Recherche et d’Enseignement de G ´eosciences de l’Environnement, 13545 Aix-en-Provence, France;cInternational Consortium for the Environmental Implications of Nanotechnology, 13545 Aix-en-Provence, France;dBureau de Recherches G ´eologiques et Mini `eres, Water Environment and Ecotechnologies Division, 45060 Orleans, France; andeResearch Centre for Toxic Compounds in the Environment, Masaryk University, 625 00 Brno, Czech Republic
Edited by Marguerite A. Xenopoulos, Trent University, Peterborough, Canada, and accepted by Editorial Board Member David W. Schindler January 24, 2017 (received for review May 21, 2016)
Dissolved organic matter (DOM) strongly influences the prop-erties and fate of engineered nanoparticles (ENPs) in aquatic environments. There is an extensive body of experiments on interactions between DOM and ENPs and also larger particles. [We denote particles on the nano- and micrometer scale as particulate matter (PM).] However, the experimental results are very hetero-geneous, and a general mechanistic understanding of DOM–PM interactions is still missing. In this situation, recent reviews have called to expand the range of DOM and ENPs studied. Therefore, our work focuses on the diversity of the DOM and PM types inves-tigated. Because the experimental results reported in the litera-ture are highly disparate and difficult to struclitera-ture, a new format of organizing, visualizing, and interpreting the results is needed. To this end, we perform a network analysis of 951 experimental results on DOM–PM interactions, which enabled us to analyze and quantify the diversity of the materials investigated. The diversity of the DOM–PM combinations studied has mostly been decreas-ing over the last 25 y, which is driven by an increasdecreas-ing focus on several frequently investigated materials, such as DOM isolated from fresh water, DOM in whole-water samples, and TiO2 and silver PM. Furthermore, there is an underrepresentation of stud-ies into the effect of particle coating on PM–DOM interactions. Finally, it is of great importance that the properties of DOM used in experiments with PM, in particular the molecular weight and the content of aromatic and aliphatic carbon, are reported more comprehensively and systematically.
nanoparticles | dissolved organic matter | environmental fate | network analysis | experimental design
T
he development and use of nanotechnology results in therelease of engineered nanoparticles (ENPs) to the envi-ronment (1, 2). Much effort in current research is put into assessing the environmental risks of ENPs, which requires the understanding of the fate and distribution of ENPs in differ-ent environmdiffer-ental media, as well as their potdiffer-ential toxicity (3– 6). Dissolved organic matter (DOM) (e.g., humic substances, polysaccharides, and proteins) is ubiquitous in aquatic systems and is known to interact with ENPs and modify their surface properties (7). DOM has been shown to either stabilize or desta-bilize aqueous ENP suspensions, depending on DOM properties and medium composition (8, 9). The effects of DOM on the sta-bility of ENP suspensions are expected to strongly influence the mobility and distribution of ENPs in the environment (10).
The extraordinary variability in DOM effects on ENPs orig-inates from the fact that the interactions between DOM and ENPs depend on numerous interrelated factors, such as pH and ionic strength of the media, the particles’ surface properties and size, and the chemical composition and concentration of the
DOM (11). Some types of DOM, such as fulvic and humic acids, electrostatically stabilize ENPs via the adsorption of the elec-trically charged DOM on the ENP surface (12–16), where the strength of the stabilization is correlated (although not linearly) with the amount of DOM adsorbed (17) and varies with its chem-ical structure (11, 12, 18, 19). In other settings, particularly in the presence of divalent cations, DOM such as polysaccharides and polypeptides enhances the aggregation of ENPs by forming bridges between the particles (20–24).
The complexity and high diversity of the interactions between DOM and ENPs makes it very difficult to predict the effect of DOM on ENPs in aqueous dispersions (25, 26). Louie et al. (25) proposed to use empirical correlations between the differ-ent experimdiffer-ents as an alternative to a first-principles mechanis-tic approach. To achieve this goal, the authors called for, among others, a broader variety of the DOM and ENP types used in the experiments (25). The need for higher diversity of materials has also been expressed by others (26, 27): Philippe and Schaumann (26) reviewed a large body of experimental work regarding the effect of DOM on ENP and colloids and pointed out that a rather small number of DOM types (mainly humic substances) dominates the experimental settings, which indicates a need to study new DOM types (26). However, the diversity of materials
Significance
Understanding the environmental fate of engineered nanoparticles (ENPs) is essential to the risk assessment of nanotechnology. Dissolved organic matter (DOM) strongly influences the behavior of ENPs in aqueous systems. This influence depends on many factors and, in particular, the types of ENPs and DOM. Accordingly, recent reviews have called repeatedly to expand the range of DOM and ENPs stud-ied. Here, we use a network perspective to assess, in terms of the material types studied, the current state of research into DOM–ENP interactions. We identify global tendencies in the choice of materials and experimental approaches that have contributed to an undesirable discrepancy between the ever-increasing number of published experiments and the persisting call for investigation of more material types.
Author contributions: N.S.-K., K.H., and M.S. designed research; N.S.-K. performed research; N.S.-K., J.L., P.O., D.S., K.H., and M.S. analyzed data; and N.S.-K., J.L., P.O., D.S., K.H., and M.S. wrote the paper.
The authors declare no conflict of interest.
This article is a PNAS Direct Submission. M.A.X. is a Guest Editor invited by the Editorial Board.
1To whom correspondence should be addressed. Email: [email protected].
This article contains supporting information online atwww.pnas.org/lookup/suppl/doi:10. 1073/pnas.1608106114/-/DCSupplemental.
PNAS
ENVIRONMENTAL
SCIENCES
(i.e., the number and range of different DOM–ENP combina-tions studied) was not explicitly addressed and reasons for the current low diversity were not discussed.
In response to this call for higher diversity of the materi-als studied, we set out to explicitly determine the diversity of ENPs and DOM investigated. Like Philippe and Schaumann (26), we consider DOM effects on both ENPs and larger par-ticulate matter (PM) and use the term PM to denote particles in the nano- and micrometer range. We define diversity as the ratio of the different DOM–ENP combinations studied vs. the num-ber of experiments conducted. We maintain that higher diversity of PM–DOM combinations is a necessary condition for a bet-ter mechanistic understanding of the inbet-teractions between PM and DOM.
However, it is important to keep in mind that high diversity of materials alone is not sufficient. Other aspects of diversity such as investigations of the same PM–DOM combination under dif-ferent conditions are not covered by our definition of diversity, which focuses on the diversity of the materials.
High diversity of the PM and DOM types offers an additional benefit. Because of the high complexity of DOM–PM interac-tions, it will be useful to use nonmechanistic approaches to eluci-date relationships between experimental conditions and the fate of ENPs, as suggested by Louie et al. (25). For example, machine learning methods can be used to infer such relationships and develop so-called “empirical models” (28). Two requirements for the development of empirical models are consistency (i.e., all data points have the same set of descriptors that were measured by comparable methods) and diversity (i.e., the dataset contains a broad range of values for each descriptor). Consistency enables the inclusion of all information in a coherent manner, and diver-sity provides that the inferred correlation accounts for a wide range of experimental settings. Therefore, sufficient diversity of the DOM and ENP types studied is needed as a basis for empir-ical models of the interaction of ENPs with DOM.
One striking feature of the experimental field of PM–DOM interactions is the huge number of potential DOM and PM com-binations that can be studied, which makes it difficult to obtain, through a literature search, an overall description of the untested DOM–PM combinations and of the frequency of already stud-ied ones in the published experiments. In response to this combinatorial challenge, we present here a perspective that quantifies the diversity of the DOM–PM combinations in a large set of experiments studying the effect of DOM on PM in aquatic media. We organize the different types of PM and DOM in a network, which makes it possible to visualize and quantify the overall diversity of materials by analyzing the topological features of the network. With this approach, we identify (i) a long-term decrease in the materials’ diversity over the last 25 y; (ii) significantly more experiments that do not explicitly sider the PM’s initial coating vs. ones that do, which is con-trary to recent recommendations that call for the assessment of PM fate in the context of the particles’ life cycle, which often includes stages where the materials are coated; and (iii) dom-inant employment of DOM from fresh water origin and infre-quent use of DOM from other environments (e.g., soils and sediments).
Our analysis provides explanations of the discrepancy between the repeated call for an increase in materials’ diversity, on the one hand, and the ever increasing number of published experiments, on the other hand. In particular, our results indi-cate a “lock-in” effect in the choice of materials (i.e., a pos-itive reinforcement of the choices of DOM and PM in new experiments according to combinations already studied). Finally, our analysis allows researchers to identify the combinations of materials studied and their prevalence in the experiments and, thereby, provides a basis for the planning of future experimental efforts.
DOM and PM Categorization
First, we constructed a database of DOM and PM that were stud-ied in combination. The identities of the DOM and PM were obtained from experimental studies that investigate the effects of DOM on inorganic PM in aquatic media and were published between 1977 and 2015. Here, we consider an experiment as a pair of DOM and PM studied in combination. For example, a publication that separately studied the effect of river humic acid
and alginate on TiO2for different pH values and ionic
composi-tion contains two experiments: one for “river humic acid–TiO2”
and another for “alginate–TiO2.” In total, our database contains
951 experiments from 271 peer-reviewed publications that used 94 different PM types and 133 different DOM types.
Here, we differentiate between three groups of DOM in the database: (i) group 1 DOM consists of isolates from environ-mental samples such as humic substances and hydrophilic acids, which are mixtures of various substances and only character-ized in terms of averaged properties (48 DOM types); (ii) group 2 DOM consists mostly of individual substances such as syn-thetic polymers, low-molecular-weight ligands, isolated proteins, and polysaccharides (68 DOM types); and (iii) group 3 DOM contains whole-water samples such as lake water, river water, and sewage treatment plant effluents (18 DOM types). Group 1 DOM, in particular humic substances, are frequently used in PM–DOM experiments (537 of the 951 experiments) and, at the same time, difficult to characterize. Therefore, we focus on this group in the following.
In the absence of a consensus regarding the extraction and characterization methods for group 1 DOM (29), and lack of
consistency in the reported properties (SI Appendix, Consistency
of Reported DOM Parameters), a DOM categorization fully based on chemical composition or chemical properties is not currently feasible. Therefore, in most cases, we characterize the group 1 DOM in our database as either unfractionated DOM, humic acid, or fulvic acid and in addition in terms of the environmental sources from which they were sampled (i.e., river, soil, peat, etc.). In a next step, we add information on chemical composition, which is possible because humic substances from similar sources often tend to have similar chemical composition, carbon distri-butions, and molecular weight distributions (14, 30–36). Below we investigate this relationship between DOM source and DOM properties in more detail.
DOM properties that correlate with the type and extent of DOM–PM interactions and are, therefore, relevant here include molecular weight, aromaticity, aliphaticity, and carbonyl content (16, 37–39).
Here, we focus on aliphatic, aromatic, and carbonyl
car-bon content estimated from solid-state13C-NMR spectra. This
method is often used to characterize humic substances (35, 40).
Solid-state 13C-NMR spectra are readily available for most
humic substances provided by the International Humic
Sub-stances Society (IHSS) (www.humicsubstances.org).
To investigate the relationship between the environmental sources of group 1 DOM and their carbon composition, we com-piled a set of 80 different samples of group 1 DOM along with data on their content of aromatic carbon, aliphatic carbon, and carbonyl carbon. To increase the diversity of this set, we used the group 1 DOM from our database in combination with
addi-tional types of group 1 DOM (Dataset S2). We then performed a
principal-component analysis (PCA) to map the 80 DOM types onto the 2D space spanned by the first to principal components
(PCs). An earlier PCA study of the13C NMR spectra of 8 DOM
samples discussed the differentiation between humic and fulvic acids but not the relationship between carbon distribution and the environmental sources of the DOM (41).
The first two PCs explain 99.9% of the variability in the car-bon composition of the DOM samples analyzed. The first PC
(denoted PC1) is a linear combination of the aromatic carbon and carbonyl carbon contents in relationship to the aliphatic car-bon content (PC1 weights: 0.67, 0.57, and 0.47 for aliphatic, aromatic, and carbonyl carbon, respectively). The second PC (denoted PC2) is the difference between carbonyl carbon con-tent and aromatic carbon concon-tent (PC2 weights: 0, 0.59, and 0.81 for aliphatic, aromatic, and carbonyl carbon, respectively) (SI Appendix, Annex A).
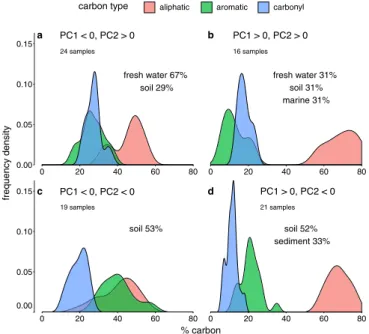
The first two PCs, therefore, divide the space of group 1 DOM carbon distribution into four quadrants (quadrants a–b in Fig. 1). Fig. 1 shows for each quadrant, derived from the DOM that falls into the quadrant, the distributions of aliphatic (red), aromatic (green), and carbonyl (blue) carbon.
Based on the PC weights listed above, DOM samples with a high PC2 score have low aromatic carbon content (often less than 20% of total carbon), which is similar to their content of carbonyl carbon. These materials belong to quadrants a or b. DOM that falls in quadrants c or d has a low PC2 score and is characterized by high content of aromatic carbon (mostly above 20% and up to 60%). Finally, DOM samples that score high in PC1 have high aliphatic carbon content (more than 50%), and therefore fall in quadrants b or c.
The distribution of all 80 group 1 DOM samples in the 2D
space spanned by the first two PCs is depicted inSI Appendix,
Fig. S6.Most aquatic DOM has relatively low aromatic carbon content and either low or high aliphatic carbon content (quad-rants a and b). More specifically, all river fulvic acids share sim-ilar fractions of aliphatic, aromatic and carbonyl carbon, which
agrees with earlier findings (35) (SI Appendix, Fig. S7).
Gener-ally, freshwater DOM shows relatively little variability in its car-bon distribution. DOM from soil, in contrast, shows the highest variability and is found in all four quadrants. Soil humic acids,
fresh water 67% soil 29% 24 samples a fresh water 31% soil 31% marine 31% 16 samples b soil 53% 19 samples c soil 52% sediment 33% 21 samples d 0.00 0.05 0.10 0.15 0.00 0.05 0.10 0.15 0 20 40 60 80 0 20 40 60 80 % carbon frequency density
carbon type aliphatic aromatic carbonyl
0 20 40 60 80 0 20 40 60 80
Fig. 1. Distributions of aliphatic, aromatic, and carbonyl carbon content in
the four quadrants defined by the first two PCs, based on 80 group 1 DOM samples in total. “High” and “low” in the following are relative terms and specific to each type of carbon. Quadrant a is low content of both aliphatic and aromatic carbon and high content of carbonyl carbon. Quadrant b is low aromatic carbon and high carbonyl and aliphatic carbon content. Quad-rant c is low content of carbonyl and aliphatic carbon and high content of aromatic carbon. Quadrant d is high content of aliphatic and aromatic car-bon and low content of carcar-bonyl carcar-bon. In each quadrant, the percentages indicate how many DOM samples belong to the different types of environ-mental DOM sources.
specifically, have a high aromatic carbon content and therefore show up in quadrants c or d. Some soil samples, primarily fulvic acids, have carbon distributions similar to that of aquatic DOM and are found in quadrants a and b. Extraction and purifica-tion processes of soil DOM are a potential cause to this large variability in its carbon composition (35, 42), but natural het-erogeneity can also be a cause. Overall, humic substances show important differences in their carbon distribution. In experi-ments with PM, humic substances should be chosen in such a way that they actually reflect the type of environment that is in the focus of the experiment. For example, many experiments use Aldrich humic acid as a generic DOM. In the PC1–PC2 graph, Aldrich humic acid lies in the bottom part of quadrant c,
typ-ical of coal and soil humic acids (SI Appendix, Fig. S6), which
makes this DOM type not representative of any aquatic
envi-ronment. The map of humic substances inSI Appendix, Fig. S7
can assist in the selection of humic substances for experiments with PM. For further details of the relationship between the
composition and the sources of group 1 DOM, seeSI Appendix,
Environmental Sources and Chemical Composition of Dissolved Organic Matter.
In conclusion, our analysis allows us to differentiate between several group 1 DOM categories with substantially different frac-tions of aromatic, aliphatic and carbonyl carbon. We will use these categories (and DOM subgroups within the categories) to characterize the diversity of the group 1 DOM, such as humic substances, investigated in experiments with PM.
Regarding PM, the focus of the experiments is often
material-specific [e.g., fate of TiO2 (43)]. Accordingly, the PM types in
our database are defined by the chemical composition of both the core material and the coating (e.g., citrate-coated silver, sil-ver, and titanium dioxide). Additionally, we also interpret the results of the analysis in terms of broader PM groups based on the core material (e.g., metal, metal oxide, metal sulfide, etc.). The complete list of DOM and PM used in the experiments and
the respective references are given inDataset S1.
Organizing the Experimental Data in a Network
In our analysis of the diversity of the PM–DOM combinations studied, the experimental field needs to be represented as a coherent entity. Such a representation can be attained by con-necting the different types of DOM and PM that have been inves-tigated in a network [i.e., a single structure that represents con-nections (links) between pairs of objects (nodes) (44)]. Here, we say a certain DOM and PM are connected by a link if they were studied together; the link’s weight equals the number of exper-iments studying the connected DOM and PM (note that these experiments may still use different conditions of other parame-ters such as pH, ionic strength and ionic composition). The net-work is bipartite, which means that connections are allowed only between objects of different type (45), here DOM and PM. Network Topology
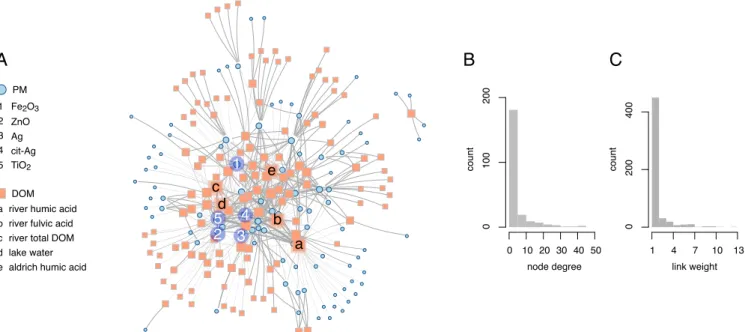
Fig. 2A shows the network derived from a set of 951 experiments with 94 PM nodes and 133 DOM nodes. In Fig. 2A, the sizes of nodes is proportional to the number of counterparts a given material was studied with (e.g., the size of a PM node type is proportional to the number of DOM types the PM was studied with). The empirical network is called “complex” because it con-tains topological features absent from random networks of the
same size (46) (SI Appendix, Table S3compares basic
proper-ties between the empirical and random networks, in which each DOM–PM combination is linked with a fixed probability).
Two important features of the empirical network are central nodes that have a large number of links (“hubs”) and relatively isolated, star-like shapes (“stars”) (the central and peripheral regions in Fig. 2A, respectively). These features reflect different types of experimental studies. Hubs (central nodes in Fig. 2A)
PNAS
ENVIRONMENTAL
SCIENCES
A
B
C
Fig. 2. Important aspects of the empirical network. (A) The empirical network with nodes scaled according to their degree (i.e., number of links) and colored by material type as indicated in the legends. Five material types with high node degrees are indicated for each class, PM and DOM. Link widths are proportional to the number of experiments using the linked combination. (B) Distribution of the number of DOM or PM types studied with any given PM or DOM, respectively (node degrees). (C) Distribution of the number of experiments conducted per each unique combination of DOM and PM (link weights).
correspond to well-studied materials that are frequently
investi-gated in combination with new materials (e.g., Fe2O3, TiO2and
Sigma-Aldrich humic acid). The presence of star-like shapes is quantified by the network’s negative degree assortativity, which means that the correlation between the number of links of
neigh-boring nodes is negative (SI Appendix, Table S3). Materials
form-ing the centers of stars were studied in combination with many others (edges of the stars), which in turn were studied mainly or exclusively with the central material. Stars indicate the introduc-tion of new combinaintroduc-tions of materials that were rarely studied in other experiments (e.g., lake humic acid, wetland total DOC, and CuS).
If materials are selected for new experiments that lead to hubs or peripheral stars, then the overall materials’ diversity increases, because new links are added to the network. It remains unclear, however, whether the call for an increase in the materials’ diver-sity intends to promote the systematic investigation of selected and well-studied materials with new counterparts (hubs), or whether the need is for general expansion of the network by using completely new materials (peripheral stars). The simultaneous presence of hubs and stars in the empirical network is reflected by the right-skewed degree distribution, which reflects the distri-bution of the number of material types with which each material was studied (see Fig. 2B).
The diversity of the experimental field increases with the num-ber of DOM–PM combinations studied. In the empirical net-work, diversity is reflected by the density of the links (i.e., the fraction of existing links out of all possible links). The density of the empirical network is 4.3%, which means that 4.3% of the pos-sible DOM–PM combinations (535 of 12,502 pospos-sible ones) have been studied in one or more experiments. However, some exper-iments study the same combinations of DOM and PM. Had each experiment studied a different DOM–PM combination (i.e., all links have a weight of 1), the overall number of links in the net-work would be the total number of experiments, which results in a density of 7.6% (951 DOM–PM combinations of 12,502 possi-ble ones). The network’s density is specific to the empirical net-work presented here, and addition of new materials (i.e., nodes) will result in a network with a different structure and density.
Because the number of experiments studying a given DOM– PM combination is the weight of the link connecting the two mate-rials, high diversity of DOM–PM combinations studied will yield links with weights of 1 (under the assumption that the number of experiments is lower than the number of DOM–PM combina-tions). On the other hand, low diversity will result in links of higher weights. In our empirical network, most links have low weight, but there are a few links that have substantially higher weights (up to 13). The resulting right-skewed distribution of link weights (Fig. 2C) indicates that the topology of the empirical network is the result of two opposing trends in the choice of materials.
It is desirable that any given DOM–PM combination will be studied under different conditions by different researchers (i.e., the link connecting the given DOM and PM will have a weight >1). However, the fact that most links have a weight of 1 means that only a handful of DOM–PM combinations undergo such a more detailed investigation. For example, of the 951
experi-ments in our database, soil fulvic acid and Fe2O3were studied
only once, whereas river humic acid in combination with citrate-coated silver was studied in 13 experiments.
Not all DOM types in the empirical network have the same environmental abundance (e.g., humic substances vs. proteins). To test the effect of different DOM types on the structure of the network, we built a “reduced” network only from experiments that use humic substances as DOM. Importantly, this reduced network has similar properties as the full empirical network. Par-ticularly, both the full and the reduced networks are sparse (i.e., have low density), have a similar topology (i.e., core-periphery structure with hubs and star-like regions), and share many of
the central nodes (SI Appendix, Table S4 and Fig. S10).
There-fore, the reduced network reflects similar trends in the choices of materials as the full network, and the properties of the full network are not caused by mixing DOM types of different envi-ronmental abundance and relevance.
Network Evolution from 1990 to 2015
Here, we investigate how temporal changes in the diversity of materials shape the global structure of the empirical network. To this end, we compare the empirical network to two simulated
networks that exhibit either high or low diversity, and track their structural changes over time.
The simulated networks were obtained by replacing in each publication in our database the DOM–PM combinations that were actually studied by DOM–PM combinations that were selected according to two rules: To obtain a network that exhibits low diversity, for each publication a DOM–PM combination was chosen that repeats one of those mentioned in the references cited in the publication. Correspondingly, choosing DOM–PM combinations different from the ones used in the cited refer-ences of each publication (by sampling uniformly at random from all combinations not studied in the cited references), resulted in a network with high diversity. We simulated 1,000 networks in each year for each network type (i.e., low- and high-diversity networks).
The simulated and empirical networks differ by the number of nodes and links as well as link weights. Because low diver-sity implies that over the years fewer DOM–PM combinations are studied, the corresponding network is smaller than the one exhibiting high diversity. In the high-diversity case, the network is constantly expanded by the introduction of new materials. The only quantity that is conserved across all networks is the total sum of link weights (i.e., the number of experiments performed in each year), which is used as a basis of comparison between the empirical and simulated networks: to compare the diversity of the networks, we measure how many DOM–PM combina-tions were studied compared with the number of experiments performed up to a given year. Accordingly, we define a diversity
index, Dcomb,i, as:
Dcomb,i=
ncomb,i
nexp,i , Dcomb,i2
1
nexp,i, 1 , [1]
where i counts the years and ncomb,i and nexp,i are the number
of DOM–PM combinations studied and the number of experi-ments, respectively, in all years from 1990 to year i.
When the diversity is maximal, each experiment studies a
dif-ferent DOM–PM combination and Dcomb,itakes the value of
1. A decrease in Dcomb,i indicates that the number of
combi-nations studied compared with the total number of experiments
decreases. The minimum value for Dcomb,iis 1/nexp,i, which
cor-responds to the case where all experiments up to year i studied the same combination of materials. Similarly, we define a diver-sity index for each class of material, DOM and PM:
Dmat,i=nmat,i
nexp,i, Dmat,i2
1
nexp,i, 1 , [2]
where nmat,i is the number of different types of DOM or PM
studied in all years from 1990 to year i.
All simulations started from the empirical network in 1990 (Fig. 3A, network 1). As can be seen in Fig. 3A, in the networks
with high diversity Dcombincreases with time (network 2); when
the diversity is low (network 3), Dcombprimarily decreases with
time. After 2007, there is a strong increase in the number of experiments per year (see bars in Fig. 3 B and C), which
cor-relates with a clear decrease in the Dcomb of the low-diversity
network (lower series of boxplots in Fig. 3A). In contrast, for the high-diversity network the number of experiments per year
has almost no correlation with the Dcombvalues (upper series of
boxplots in Fig. 3A). The reason for this finding is that the
high-diversity network quickly approaches a high Dcomb value, and
new DOM–PM combinations increase both the numerator and
the denominator in Eq. 1 and Dcombdoes not change much. The
maximum value of 1 is not observed because at the starting point of the simulations (in 1990) several experiments already studied the same DOM–PM combinations. The boxplots represent the
range of Dcombfor each year, obtained from the 1,000 simulated
high- and low-diversity networks (for a detailed discussion, see
SI Appendix). 0.0 0.2 0.4 0.6 0.8 1.0 combinations diversity ind ex , D comb 4 3 04 0 80 12 0 0.0 0.2 0.4 02 0 60 100 number of exper iments 1990 1995 2000 2005 2010 2015 0.0 0.2 0.4
material diversity index,
Dmat year 1 2
B
C
A
DOMriver humic acid river fulvic acid
aldrich humic acid water samples group-2 DOM PM ZnO cit-Ag pvp-Ag Ag other than metal and metal oxides TiO2
river total DOM terrestrial DOM
iron oxides, copper oxide
Fig. 3. Temporal changes in the diversity of the materials studied. (A)
Diver-sity index of the DOM–PM combinations, Dcomb, as a function of time.
Net-work 1 represents the experimental field in 1990 and is the starting point for the simulated networks. Network 2 is the expected structure of the experi-mental field in 2015, when the diversity of the DOM and PM was simulated to be high during 1990–2015. Network 3 is the result of simulating low diver-sity during this period. Boxplots represent distributions of Dcombfor 1,000
simulated networks in each year. Network 4 is the current empirical net-work; red asterisks represent the change in Dcombof the empirical network.
The light red band shows the variation in Dcombas a result of either a finer
(upper bound) or coarser (lower bound) categorization of DOM types. The left vertical axis in B shows the material diversity index, Dmat, of DOM as a
function of time. Bars in B show the number of experiments in each year (right vertical axis); the color code indicates different DOM types, and the legend shows DOM types mentioned in the text. The left vertical axis in C shows the material diversity index, Dmat, of PM as a function of time. Bars
in C show the number of experiments in each year (right vertical axis); the color code indicates different PM types, and the legend lists some of the most-used PM types between 2012 and 2015.
The Dcombof the empirical network (network 4 in Fig. 3A)
decreases over time, however, not monotonously. Numerous factors influence the choice of materials (e.g., scientific inter-est and preferences of individual scientists, inter-established scientific collaborations, trends in the field, costs and availability of mate-rials, etc.), which results in the study of both new
combina-tions and combinacombina-tions studied before. Accordingly, the Dcomb
of the empirical network shows alternating periods of increase and decrease. Still, the significantly negative slope of a linear
regression line fitted to the Dcombvalues (see Methods section)
indicates that it is mainly a trend toward lower diversity of the materials studied that has shaped the structure of the experimen-tal field over the last 25 y.
We performed several tests to check how stable the decreasing
trend in Dcombis. Specifically, we analyzed how Dcomb is
influ-enced by potential missing publications in our database (e.g., not retrieved in the publication search), and by finer or coarser
def-initions of the DOM types. The decreasing trend in Dcombwas
stable in both tests: the decreasing diversity was also observed under random perturbations of the publications in our database, which we used to simulate the effect of missing publications. Decreasing diversity is also shown by the red band in Fig. 3A,
PNAS
ENVIRONMENTAL
SCIENCES
which shows the influence of finer and coarser definitions of the
DOM types on Dcomb. For a detailed discussion, seeSI Appendix,
Resilience of the Experimental Network.
In conclusion, the observation of an overall decrease in the
Dcomb holds for a wide range of possible definitions of DOM
types. Therefore, the decrease in diversity is unlikely to be an artifact of the DOM categorization scheme used.
In Fig. 3 B and C, temporal changes in the material diversity
index (Dmat) are depicted separately for DOM and PM,
respec-tively (y axes on the left). For DOM, Dmatdecreases over the
entire period. In contrast, the decrease in PM diversity slows down after the year 2000. In the early 2000s, calls were made to assess the potential risks of nanotechnology (3, 47), which were followed by extensive research aimed at evaluating the fate of ENPs in the environment (48). Because these ENPs are more diverse (e.g., in terms of their surface properties and morpholo-gies) than natural PM, ENP research introduced some additional diversity into the experiments. Thus, the overall decrease in the diversity of the experimental field is likely due to the constant decrease in DOM diversity.
There are several plausible explanations for the observed
decrease in Dcomb; from the perspective of an individual
sci-entist, low diversity between the experiments might be of a minor concern or is even desirable (e.g., for the purpose of reproducibility of experiments). The overall diversity and its importance is only evident when the entire experimental field is assessed as a whole. Therefore, the decrease in diversity may arise from the discrepancy between the individual and the collective perspectives. Additionally, even when individual researchers aim at studying new DOM–PM combinations to increase the diversity, the large number of possible DOM– PM combinations makes it difficult to assess (based on pub-lished experiments) which additional DOM–PM combinations should be investigated. Another possibility is that the increas-ing occurrence of certain materials used in the experiments may result in the perception of these materials as standards, creat-ing drift toward the use of these materials in a positive feedback process.
The last period (2012–2015), which displays a decrease in
Dcomb for the empirical network (Fig. 3), is of special interest
because the number of experiments carried out in this period comprises about 46% of the total number of experiments ana-lyzed here (442 of 951). We will therefore analyze the origin of the decreasing trend, in particular in the last years, in more detail in the following section.
Systematic Trends in Experimental Designs Explain the Reduction in the Diversity of Materials
Here, we investigate the temporal trends and frequency of use of specific materials, first for DOM and then for PM.
Fig. 3B shows that the various DOM types used in the exper-iments in recent years originate mainly from whole-water sam-ples (e.g., lake water, river water, sea water, etc.; group 3 DOM) (orange parts of the bars in Fig. 3B) and from group 1 DOM sampled from river water (blue parts of the bars in Fig. 3B). The focus on group 1 humic substances from river water has become more pronounced in 2010–2015 and the fraction of experiments with group 1 DOM from other environment types such as peat, soil, seawater, and coal, has correspondingly decreased (purple
part of bars in Fig. 3B; also seeSI Appendix, Fig. S3 B and C,
where the groups of DOM are shown in more detail than in Fig. 3B). Other relevant parts of DOM visible in Fig. 3B are Aldrich humic acid (red parts of the bars) and group 2 DOM such as alginate (green).
The river DOM shown in blue in Fig. 3B mostly belongs to quadrant a on the map spanned by the first two PCs of the PCA
(Fig. 1 andSI Appendix, Fig. S6). These are substances that have
relatively low aliphatic and aromatic carbon content. On the
other hand, use of DOM that belongs to quadrant c constantly decreases. This DOM has low aliphatic and high aromatic car-bon content and includes humic acids from peat, soil, and coal (SI Appendix, Fig. S6). Finally, the experiments in our database only rarely use DOM that contains high aliphatic and high aro-matic carbon content, such as the ones that belong to quadrant
d(e.g., sediment humic substances), and high aliphatic and low
aromatic carbon content (i.e., marine humic substances in quad-rant b).
The increasing focus on group 1 DOM types with similar car-bon distribution (predominantly from quadrant a) parallels the decreasing diversity index of both DOM types used and DOM– PM combinations studied, primarily between 2012–2015 (Fig. 3 A and B).
Soil DOM is highly heterogeneous and, at the same time, has low prevalence in the experiments (Fig. 3B). Accordingly, the information regarding the interaction of PM with soil DOM is still scarce. Because there is no “representative” soil DOM (see results of the PCA above), studies on the interaction between soil DOM and PM, for example in pore water, need to account for the heterogeneity of soil DOM, and use DOM extracted from different specific soil types.
Group 2 DOM, which primarily includes isolated and well-defined substances, was used in only 22% of all experiments (211 out of 951 experiments). Group 1 DOM is the major focus of the experimental effort, which confirms previous observations of high prevalence of humic substances as the DOM component in the DOM–PM experiments (26).
The DOM isolated from environmental media (blue and pink in Fig. 3B), on the one hand, and DOM in water samples without further processing (yellow in Fig. 3B), on the other hand, pro-vide two complementary options for studying DOM–PM interac-tions. With isolated DOM, a deeper mechanistic understanding of the interaction between DOM and PM can be obtained. How-ever, it is not always the case that the synthetic conditions created are environmentally relevant. Water samples, on the other hand, better represent environmental conditions but lack of control of the concentration and properties of the DOM present in a water sample limits the mechanistic understanding of the experimental output (25). Because these two approaches are complementary (49), it follows that, when researchers have obtained a mechanis-tic understanding, their insights could be expanded and corrob-orated in follow-up experiments with natural-water samples, for example see refs. 50 and 51.
Water-sample DOM types comprise a large number of the overall experiments (Fig. 3B). In the empirical network, however, water-sample DOM types occupy only a small region in the
net-work (light blue squares in the netnet-work shown inSI Appendix,
Fig. S5A). This finding indicates that the large number of exper-iments that use water samples are investigated in combination with only a small fraction of all PM types present in our database. Therefore, there is a potential for more diversity through investigation of water-sample DOM with more PM types. How-ever, in these experiments the DOM and also the experimen-tal conditions in general would have to be characterized in a more detailed, more comprehensive, and more systematic way than what is found in many existing studies. Without that, the added value of more experiments with water samples will remain unclear.
For the PM in our database, it is the combinations of coat-ing and core material that need to be investigated to understand the trend in diversity. The initial coating of ENPs strongly influ-ences the interaction of the particles with DOM, which in turn can affect the stability of the ENPs (52–54). For this reason, every PM that was reported to have a distinct initial coating is a sepa-rate entry in our database. On the other hand, if the authors of an experimental study did not mention the exact PM coating (and if this information could not be found in the material description
of the supplier), or the authors explicitly referred to the PM as “bare,” we consider this PM as uncoated. Therefore, “uncoated” PM in the empirical network means that a possible initial coating of the PM was not considered as a parameter in the experiments, and therefore the experimental results do not account for the coating’s interaction with DOM.
PM types with novel coatings are continuously introduced into the network, which increases the diversity of the PM in the exper-imental network (because the PM types in our database are dis-tinguished by both their core material and their coating (Fig. 3C, years 2011–2013) or keeps the decrease shallow (years 2014– 2015). However, the diversity of the PM–DOM combinations further decreases (Fig. 3A, years 2012–2015) because the coated PM types are investigated only with a (very) limited number of DOM, as is demonstrated by the network shown in Fig. 4A.
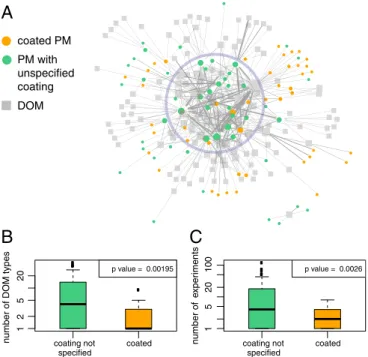
In Fig. 4A, the 45 nodes that correspond to coated PM (orange dots) mainly occupy the periphery of the network, whereas those that correspond to uncoated PM (49 nodes) are mostly central (light blue circle in Fig. 4A). Particularly, coated PM is studied with significantly fewer DOM counter-parts than uncoated PM (Fig. 4B). When the well studied citrate-and poly(vinylpyrrolidone) (PVP)-coated nanosilver as well as citrate-coated nanogold are not considered, the number of times a given coated PM was studied (i.e., number of experiments) is considerably smaller than a given uncoated PM (Fig. 4C).
We conclude that uncoated materials are often re-studied in combination with different DOM types and possibly varying other medium conditions. However, for coated PM, follow-up
p value = 0.00195 p value = 0.0026
C
B
A
coated PM PM with unspecified coating DOM 12 5 20number of DOM types coating not
specified coated coating notspecified coated
1 5 20 100 number of exper iments
Fig. 4. Differences between coated PM and PM where coating was not
considered (uncoated). (A) Uncoated PM (green) are located mainly at the center of the empirical network (light blue circle), whereas the coated PM (orange) are located mainly at the periphery of the network. Size of nodes is proportional to their degree. (B) Boxplots showing the distributions of the number of DOM types studied with uncoated and coated PM (i.e., the degrees of the PM nodes). (C) Boxplots showing the number of experi-ments performed (i.e., sum of link weights of the PM nodes) with uncoated and coated PM (with citrate- and PVP-coated nanosilver and citrate-coated nanogold omitted). The borders of the boxplots are the 25th and the 75th percentiles. P values are for the two-sample, nonparametric Mann–Whitney
U test (alternative hypotheses: “uncoated PMs are studied with more DOM
types than coated PMs” and “uncoated PMs are studied in more experi-ments than coated PMs”).
experiments with different DOM types are performed only spo-radically. As explained earlier, uncoated PM refers to any PM not explicitly described as being coated. The imbalance between the study of coated vs. uncoated PM implies that the role of the initial coating in determining the interaction of a PM with DOM is often not considered. However, ENPs are frequently coated, and, accordingly, coated ENPs are also likely to be released to the environment (52). Therefore, the underrepresentation of experiments with coated PM in the network indicates that more experiments that explicitly consider the coating of ENPs are needed to sufficiently characterize the interaction of ENPs with DOM.
Finally, in SI Appendix, Fig. S11, we observe that the
net-work’s core, which contains the majority of the uncoated PM, is comprised mostly of recent experiments. Therefore, the low con-sideration of the effect of initial PM coating on DOM–PM inter-actions is a current phenomenon.
Conclusions and Recommendations
Over the last 25 y, numerous experiments have been performed that aim to elucidate the effect of DOM on ENPs specifically and PM in general. Still, recent reviews call for additional exper-iments (25, 26), and it is important to consider carefully which DOM–PM combinations should be studied in future experi-ments. Here, the overall objective of the experiments plays an important role. One objective is to investigate the fate of PM in specific environments, such as ENPs in surface water. For exper-iments with this objective, DOM representative of the environ-ment considered will be used (e.g., river and lake humic acids and fulvic acids for surface water but not Aldrich humic acid, which
reflects soil DOM properties;SI Appendix, Fig. S7).
Another objective is to mechanistically study the PM–DOM interactions without a focus on a specific environment, but with the aim to improve the general mechanistic understanding of these interactions. For this kind of experiment, a broad range of material properties is needed.
To increase the diversity of materials, researchers can study entirely new materials (i.e., add new nodes to the empirical net-work) and/or study DOM–PM combinations that were not stud-ied together before (i.e., add new links between existing nodes in the empirical network). For the selection of DOM for new
experiments, the PC1–PC2 map inSI Appendix, Figs. S6 and S7
can guide the identification of suitable DOM. In any case, it is imperative that the experiments will be comparable in terms of the materials’ characterization to foster the development of both empirical models and a better mechanistic understanding.
The development of a DOM classification based on physico-chemical properties and physico-chemical functionality requires a consis-tent reporting of relevant DOM characteristics (chemical com-position, carbon distribution, molecular weight, etc.). In 40% of the publications in our database that use one or more group 1 DOM, there is no information regarding the molecular weight nor the chemical composition nor the carbon distribution for at least one of the group 1 DOM studied. Similarly, less than half of the publications in our database that use DOM from
the IHSS report the sample’s identifier (SI Appendix, Fig. S1).
It is essential that the basic characteristics of the DOM used in experiments with PM are reported much more systematically and comprehensively.
What are possible reasons for the observed decrease in diver-sity? To some extent, the decrease has been caused by the many studies focusing on ENPs in aquatic systems in the last years (which is an intentional focus on an environmentally relevant problem).
In addition, because the experimental field is large and dis-parate, it is difficult to obtain a comprehensive overview of past experimental achievements. This situation may lead to a lock-in dynamics that reinforces the use of certain DOM–PM
PNAS
ENVIRONMENTAL
SCIENCES
combinations and makes other combinations less visible and likely to be studied.
Such a lock-in effect in favor of certain experimental settings or materials is not limited to the field of environmental fate of ENPs. It is known that in science in general an initial focus on certain experimental settings reinforces the use of these set-tings in the future. For example, in nanomaterial ecotoxicology it has been pointed out that the majority of the ecotoxicologi-cal data are confined to, among others, fresh water organisms, although more studies on terrestrial and marine organisms are needed (55). Another example is the various databases that sum-marize key properties of ENPs to facilitate ENP risk assessment. These databases often offer information on selected ENP types
(e.g., TiO2and ZnO) but lack the required information on
oth-ers (e.g., Ag and Fe2O3) (56). In both examples, the materials
and/or experimental settings are criticized as being unrepresen-tative or too narrow (55, 56).
This problem is also discussed in a more general way in phi-losophy of science. Weisberg and Muldoon (57) point out that the ability of a scientific community to discover new knowledge depends on the balance between scientists who use established settings and scientists who apply new approaches to new settings (57). Our analysis shows how an imbalance between these two approaches can emerge over time.
A network perspective as shown here is useful because in a net-work the entire experimental field, consisting of diverse experi-mental settings, can be visualized as a single entity. This visu-alization provides a graphical summary of the current state of the science, but also a tool for modeling and understanding how the structure of the research field has developed; finally, it helps identify gaps in the body of experiments performed and future research needs. In the context of DOM and PM research, fur-ther research should (i) place more emphasis on the initial coat-ing of the PM and its interaction with DOM; (ii) confront results from experiments with isolated DOM against studies with natu-ral water samples; and (iii) strive to increase the diversity of the types of DOM and PM investigated.
Materials and Methods
Publication Search. The empirical network is based on experiments that study the effects and/or interactions of DOM with PM in aquatic media. Experiments that report transport of PM in porous media were included if in addition they studied the DOM effects on the PM in aqueous media. Exper-iments where the PM is a naturally occurring colloid (e.g., suspended sedi-ment) were not included. Relevant studies published until 2013 were taken from the review by Philippe and Schaumann (26). Studies between 2013– 2015 were obtained from two search queries in SciFinder (58) performed on July 2, 2015 using the keywords (i) colloids and organic matter, yielding 352 results; and (ii) nanoparticles and organic matter, yielding 493 results. The search results were automatically filtered, using a designated R script, and the remaining publications contained in their abstract either one of the (stemmed) keywords: “stability,” “aggregation,” “adsorption,” “sorption,” “sedimentation,” “coating,” “deposition,” “mobility,” “surface,” “disag-gregation,” and “precipitation.”
In a second search (July 12, 2016) additional publications were obtained from two more queries in SciFinder (58): “dissolved organic matter and nanoparticles” and “dissolved organic matter and inorganic colloids,” for experimental papers published between 1977–2015. This search resulted in 173 and 58 papers for the first and second query, respectively. Of those, 26 were relevant based on their title and abstract and were not already in our database. A third SciFinder search (December 12, 2016) was car-ried out for experimental papers published between 1977–2015 using four additional queries: “dissolved organic matter and nanoparticles dissolu-tion,” “dissolved organic matter and nanoparticles precipitadissolu-tion,” “dis-solved organic matter and colloids precipitation,” and “dis“dis-solved organic matter and colloids dissolution.” This search gave 53, 7, 28, and 95 hits for the first to fourth query, respectively. Of those, six were pertinent to our analysis and were not yet in the database. The remaining papers were stud-ied in detail and kept if they report the effect of DOM on PM aggrega-tion/dissolution/precipitation or if they study the coating of PM by DOM in aquatic media.
Types of Studies. Of the 271 publications, 172 investigate, among others, PM aggregation; 45 study, among others, PM dissolution and precipitation; and 58 study only DOM adsorption onto PM surfaces. A full list of publications and the used materials are given inDataset S1.
PCA. We analyzed the carbon distribution of different DOM types reported in the literature and on the IHSS website (www.humicsubstances.org; accessed November 8, 2016). The full list of materials and their properties are given inDataset S2. Because of the many missing values for different parameters (above), we could not use all DOM types listed in the references. The publications analyzed here report the carbon distribution as obtained from13C-NMR spectra. Different authors sometimes use
differ-ent regions of the chemical shift to quantify differdiffer-ent carbon types such as aliphatic, heteroaliphatic, acetal, aromatic, carboxyl and carbonyl carbon. To smooth out these differences, we combined smaller integration intervals to larger ranges that account for three basic carbon types: aliphatic carbon (i.e., heteroaliphatic and acetal carbon), aromatic carbon, and carbonyl (also accounts for carboxyl) (International Humic Substances Society and refs. 59 and 60): (i) aliphatic carbon (%), integrated area between 0 and 110 ppm; (ii) aromatic carbon (%), integrated area between 110 and 165 ppm; and (iii) carbonyl carbon, integrated area between 165 and 220 ppm.
Next, we performed a PCA (on the scaled database). In short, a PCA finds the set of orthogonal vectors (also called the principal components or, in short, PCs) that define the linear combinations of the parameters that cap-ture the highest variability in the database. Each data point is projected into the respective PC dimension by calculating the linear combination of the parameters, weighted by the respective PC coefficients. The analysis was done using the function princomp in R, and its output is presented inSI Appendix, Annex A.
Empirical Network Construction. From the publications collected a list of all studied DOM–PM combination was extracted and converted to a bipartite network (45) using the igraph package 61, available in R, version 3.3.0 (62). This network has two types of nodes, PM or DOM, and links are only possible between nodes of different types. The network, G, is defined by
G = (U,V,E), E ✓ U ⇥ V, [3]
where U and V are the sets of all DOM and PM, respectively, and U ⇥ V is the Cartesian product, i.e., the set of all possible links. The set E denotes all DOM–PM combinations studied. The weight of a given link is the number of experiments studying the DOM and PM connected by this link. Links are undirected because they imply the presence of both materials in the corre-sponding experiments.
Coated PM was regarded as a new material (i.e., citrate-coated silver NPs were regarded different from polyvinylpyrrolidone-coated silver NPs) because the coating/surface functionalization has been shown to alter the interaction of the particles with DOM. The broad PM groups are based on chemical composition of the core material. The different types of DOM were categorized according to source (e.g., humic acid from a river or a lake) and physicochemical properties (e.g., anionic and nonionic surfactant). Excep-tions included commercial humic acids, often from an unspecified source (63), which were categorized according to the manufacturer’s name (e.g., Aldrich humic acid). For experiments reporting the effects of the total DOM from a given source as well as the different DOM fractions, the entry in the database is for the unfractionated DOM (e.g., different molecular fractions of Suwannee River Natural Organic Matter (64) were given a single node in the network).
Linear Regression on the Diversity Values Between 1990 and 2015. A linear regression line was fitted to the Dcomb values presented in the section
Network evolution between 1990–2015. However, inference of regression parameters by means of ordinary least squares (OLS) requires independence of the error terms (i.e., residuals), which is not the case for the OLS resid-uals of the Dcombvalues. Rather, they exhibit a serial correlation that can
be modeled by an autoregressive (AR) process of order 1. Therefore, the linear regression was carried out using generalized least squares with resid-uals correlation structure of the respective AR process, using the function
gls() from the package nlme (65) in R (62). The resulting regression line is
given by
Dcomb= 0.807 0.00893 · t (t: years from 1 to 25). [4]
Simulation of Networks with High and Low Diversity of DOM–PM Combinations. For each case (i.e., high and low diversity of the studied DOM–PM com-binations), 1,000 networks were simulated for each year from 1990–2015. Networks of high diversity were simulated by replacing the DOM–PM com-binations used in a given publication by comcom-binations sampled uniformly at random from all possible combinations that were not studied in the cited publications of this given publication. Networks of low diversity were simu-lated by replacing the studied DOM–PM combination of a given publication by the most frequent combinations used in the cited references of this pub-lication; if all experimental combinations cited in a publication are unique, DOM–PM combinations were sampled uniformly at random from the ones studied in the cited references of the publication.
Supporting Information. SI Appendixcontains results and figures from addi-tional analyses. The analysis of the robustness of the diversity trend using bootstrap simulation was performed with the package boot (66) in R (62).
Some figures in theSI Appendixwere created by the ggplot (67) and
ggre-pel (68) packages in R (62).Dataset S1contains the experiments (with ref-erences) used to create the empirical network.Dataset S2lists the carbon distribution of the DOM types used for the PCA. The analysis code and its description are publicly available at
https://github.com/nicolesanikast/DOM-PM network.
ACKNOWLEDGMENTS. We thank Eli Goldberg for helpful discussions and
the Seminar for Statistics (Eidgen ¨ossische Technische Hochschule Zurich), in particular Claude Renaux, for the valuable statistic consulting, support, and guidance. Funding from the Swiss Federal Office for the Environment is gratefully acknowledged. This work is part of the NANOHETER project under the European Area Network (ERA-NET) on Safe Implementation of Innovative Nanoscience and Nanotechnology (SIINN). M.S. acknowledges financial support from the Czech Ministry of Education, Youth, and Sports (Grant LM2015051) and Masaryk University (CETOCOEN PLUS Project Grant CZ.02.1.01/0.0/0.0/15 003/0000469).
1. Karn B, Kuiken T, Otto M (2009) Nanotechnology and in situ remediation: A review of the benefits and potential risks. Environ Health Perspect 117(12):1823–1831. 2. Gottschalk F, Nowack B (2011) The release of engineered nanomaterials to the
envi-ronment. J Environ Monit 13(5):1145–1155.
3. Colvin VL (2003) The potential environmental impact of engineered nanomaterials.
Nat Biotechnol 21(10):1166–1170.
4. Boxall ABA, Tiede K, Chaudhry Q (2007) Engineered nanomaterials in soils and water: How do they behave and could they pose a risk to human health? Nanomedicine 2(6):919–927.
5. Hannah W, Thompson PB (2008) Nanotechnology, risk and the environment: A review.
J Environ Monit 10(3):291–300.
6. Batley GE, Kirby JK, McLaughlin MJ (2013) Fate and risks of nanomaterials in aquatic and terrestrial environments. Acc Chem Res 46(3):854–862.
7. Beckett R, Le NP (1990) The role or organic matter and ionic composition in deter-mining the surface charge of suspended particles in natural waters. Colloids Surf 44: 35–49.
8. Liu J, Legros S, von der Kammer F, Hofmann T (2013) Natural organic matter concen-tration and hydrochemistry influence aggregation kinetics of functionalized engi-neered nanoparticles. Environ Sci Technol 47(9):4113–4120.
9. Baalousha M (2009) Aggregation and disaggregation of iron oxide nanoparticles: Influence of particle concentration, pH and natural organic matter. Sci Total Environ 407(6):2093–2101.
10. Aiken GR, Hsu-Kim H, Ryan JN (2011) Influence of dissolved organic matter on the environmental fate of metals, nanoparticles, and colloids. Environ Sci Technol 45(8):3196–3201.
11. Majedi SM, Kelly BC, Lee HK (2014) Role of combinatorial environmental factors in the behavior and fate of ZnO nanoparticles in aqueous systems: A multiparametric analysis. J Hazard Mater 264:370–379.
12. Gallego-Urrea JA, Perez Holmberg J, Hassell ¨ov M (2014) Influence of different types of natural organic matter on titania nanoparticle stability: Effects of counter ion con-centration and pH. Environ Sci Nano 1(2):181–189.
13. Abe T, Kobayashi S, Kobayashi M (2011) Aggregation of colloidal silica particles in the presence of fulvic acid, humic acid, or alginate: Effects of ionic composition. Colloids
Surf A Physicochem Eng Asp 379(1-3):21–26.
14. Erhayem M, Sohn M (2014) Effect of humic acid source on humic acid adsorption onto titanium dioxide nanoparticles. Sci Total Environ 470-471:92–98.
15. Erhayem M, Sohn M (2014) Stability studies for titanium dioxide nanoparticles upon adsorption of Suwannee River humic and fulvic acids and natural organic matter. Sci
Total Environ 468:249–257.
16. Deonarine A, Lau BLT, Aiken GR, Ryan JN, Hsu-Kim H (2011) Effects of humic sub-stances on precipitation and aggregation of zinc sulfide nanoparticles. Environ Sci
Technol 45(8):3217–3223.
17. Pan B, Xing B (2008) Adsorption mechanisms of organic chemicals on carbon nano-tubes. Environ Sci Technol 42(24):9005–9013.
18. Hesselink FT, Vrij a, Overbeek JTG (1971) Theory of the stabilization of dispersions by adsorbed macromolecules. II. Interaction between two flat particles. J Phys Chem 75(5):2094–2103.
19. Napper D (1977) Steric stabilization. J Colloid Interface Sci 58(2):390–407. 20. Chen KL, Mylon SE, Elimelech M (2007) Enhanced aggregation of alginate-coated
iron oxide (hematite) nanoparticles in the presence of calcium, strontium, and barium cations. Langmuir 23(11):5920–5928.
21. Fleer GJ, Lyklema J (1974) Polymer adsorption and its effect on the stability of hydrophobic colloids. II. The flocculation process as studied with the silver iodide-polyvinyl alcohol system. J Colloid Interface Sci 46(1):1–12.
22. Pelssers E, Stuart M, Fleer G (1989) Kinetic aspects of polymer bridging: Equilibrium flocculation and nonequilibrium flocculation. Colloids Surf 38(1):15–25.
23. John G (1988) Polymer adsorption and flocculation in sheared suspensions. Colloids
Surf 31:231–253.
24. Labille J, Thomas F, Milas M, Vanhaverbeke C (2005) Flocculation of colloidal clay by bacterial polysaccharides: Effect of macromolecule charge and structure. J Colloid
Interface Sci 284(1):149–156.
25. Louie SM, Tilton RD, Lowry GV (2016) Critical review: Impacts of macromolecular coat-ings on critical physicochemical processes controlling environmental fate of nanoma-terials. Environ Sci Nano 3:283–310.
26. Philippe A, Schaumann G (2014) Interactions of dissolved organic matter with natural and engineered inorganic colloids: A review. Environ Sci Technol 48(16):8946–8962. 27. Grillo R, Rosa AH, Fraceto LF (2015) Engineered nanoparticles and organic matter: A
review of the state-of-the-art. Chemosphere 119:608–619.
28. Goldberg E, Scheringer M, Bucheli T, Hungerbuehler K (2015 Prediction of nanopar-ticle transport behavior from physicochemical properties: Machine learning provides insights to guide the next generation of transport. Environ Sci Nano 2:352–360. 29. Filella M (2008) Freshwaters: Which NOM matters? Environ Chem Lett 7(1):21–35. 30. Beckett R, Jue Z, Giddings JC (1987) Determination of molecular weight distributions
of fulvic and humic acids using flow field-flow fractionation. Environ Sci Technol 21(3):289–295.
31. Chin YP, Aiken G, O’Loughlin E (1994) Molecular weight, polydispersity, and spec-troscopic properties of aquatic humic substances. Environ Sci Technol 28(11):1853– 1858.
32. Esteves VI, Otero M, Duarte AC (2009) Comparative characterization of humic sub-stances from the open ocean, estuarine water and fresh water. Org Geochem 40(9):942–950.
33. Perminova IV, et al. (2003) Molecular weight characteristics of humic substances from different environments as determined by size exclusion chromatography and their statistical evaluation. Environ Sci Technol 37(11):2477–2485.
34. Malcolm RL (1990) The uniqueness of humic substances in each of soil, stream and marine environments. Anal Chim Acta 232:19–30.
35. Malcolm RL (1990) Variations between humic substances isolated from soils, stream waters, and groundwaters as revealed by C-NMR spectroscopy. Humic Substances in Soil and Crop Sciences: Selected Readings, eds MacCarthy P, Clapp EC, Malcolm RL, Bloom PR (Soil Science Society of America, Madison, WI), pp 13–35.
36. Slomberg DL, et al. (2016) Insights into natural organic matter and pesticide charac-terisation and distribution in the Rhone River. Environ Chem 14:64–73.
37. Chen W, Qian C, Liu XY, Yu HQ (2014) Two-dimensional correlation spectroscopic anal-ysis on the interaction between humic acids and TiO2 nanoparticles. Environ Sci
Tech-nol 48(19):11119–11126.
38. Ghosh S, Wang ZY, Kang S, Bhowmik PC, Xing BS (2009) Sorption and fractionation of a peat derived humic acid by kaolinite, montmorillonite, and goethite. Pedosphere 19(1):21–30.
39. Louie SM, Spielman-Sun ER, Small MJ, Tilton RD, Lowry GV (2015) Correlation of the physicochemical properties of natural organic matter samples from different sources to their effects on gold nanoparticle aggregation in monovalent electrolyte. Environ
Sci Technol 49:2188–2198.
40. Simpson AJ, Simpson MJ, Soong R (2012) Nuclear magnetic resonance spectroscopy and its key role in environmental research. Environ Sci Technol 46(21):11488–11496. 41. Thomsen M, et al. (2002) Characterisation of humic materials of different origin: A
multivariate approach for quantifying the latent properties of dissolved organic mat-ter. Chemosphere 49(10):1327–1337.
42. Worobey BL, Webster GRB (1981) Indigenous 13C-NMR structural features of soil humic substances. Nature 292(5823):526–529.
43. Stone V, et al. (2010) Nanomaterials for environmental studies: Classification, refer-ence material issues, and strategies for physico-chemical characterisation. Sci Total
Environ 408(7):1745–1754.
44. Newman MEJ (2003) The structure and function of complex networks. SIAM Rev Soc
Ind Appl Math 45(2):167–256.
45. Asratian AS, Denley TMJ, Haggkvist R (1998) Introduction to bipartite graphs. Bipar-tite Graphs their Applications (Cambridge Univ Press, Cambridge, UK), pp 7–22. 46. Costa LDF, Rodrigues FA, Travieso G, Villas Boas PR (2007) Characterization of complex
networks: A survey of measurements. Adv Phys 56(1):167–242.
47. Williams R, Alivisatos P, eds (2000) Nanotechnology Research Directions: IWGN Work-shop Report Vision for Nanotechnology in the Next Decade (Springer, The Nether-lands).
48. Lecoanet HF, Bottero JY, Wiesner MR (2004) Laboratory assessment of the mobility of nanomaterials in porous media. Environ Sci Technol 38(19):5164–5169.
49. Wang Z, Zhang L, Zhao J, Xing B (2016) Environmental processes and toxicity of metal-lic nanoparticles in aquatic systems as affected by natural organic matter. Environ Sci
Nano 3(2):240–255.
50. Ottofuelling S, Von der Kammer F, Hofmann T (2011) Commercial titanium dioxide nanoparticles in both natural and synthetic water: Comprehensive multidimensional