HAL Id: tel-01362508
https://tel.archives-ouvertes.fr/tel-01362508
Submitted on 9 Sep 2016HAL is a multi-disciplinary open access
archive for the deposit and dissemination of sci-entific research documents, whether they are pub-lished or not. The documents may come from teaching and research institutions in France or abroad, or from public or private research centers.
L’archive ouverte pluridisciplinaire HAL, est destinée au dépôt et à la diffusion de documents scientifiques de niveau recherche, publiés ou non, émanant des établissements d’enseignement et de recherche français ou étrangers, des laboratoires publics ou privés.
New insights into the current- and past hydrology of the
north-western subtropical Pacific Ocean over the past 25
kyr, based on investigations of the Nd isotopic
composition of seawater and deep-sea sediments from
the northern South China Sea
Qiong Wu
To cite this version:
Qiong Wu. New insights into the current- and past hydrology of the north-western subtropical Pacific Ocean over the past 25 kyr, based on investigations of the Nd isotopic composition of seawater and deep-sea sediments from the northern South China Sea. Geochemistry. Université Paris Sud - Paris XI, 2014. English. �NNT : 2014PA112169�. �tel-01362508�
UNIVERSITÉ PARIS-SUD
ÉCOLE DOCTORALE 534 :
MODÉLISATION ET INSTRUMENTATION EN PHYSIQUE, ÉNERGIES, GÉOSCIENCES ET ENVIRONNEMENT
Laboratoire : Géosciences Paris Sud (GEOPS)
THÈSE DE DOCTORAT
SCIENCES DE L'UNIVERS
par
Qiong WU
New insights into the current- and past hydrology of the
north-western subtropical Pacific Ocean over the past 25 kyr, based
on investigations of the Nd isotopic composition of seawater and
deep-sea sediments from the northern South China Sea
Date de soutenance : 08/09/2014 Composition du jury :
Directeur de thèse : Christophe Colin Professeur (Université Paris-Sud) Rapporteurs : Laure Meynadier Professeur (Université Paris Diderot)
Paolo Montagna Chercheur (CNR-ISMAR) Examinateurs : Pinxian Wang Professeur (Tongji University)
1
Acknowledgements
This thesis represents a four-year journey full of amazing and pleasant memories. I have worked in excellent labs and have met many wonderful people in various fields who took me “under their wing” from the very beginning. I benefited immensely from their efforts and I wish to take this opportunity to express my sincere appreciation for their help.
First of all, I would like to sincerely thank my advisor, Prof. Christophe Colin, who offered me the opportunity to pursue this study in the Laboratoire de Geosciences Paris-Sud (GEOPS). Without his enthusiastic support, patient guidance, and invaluable advice in the process of this research, this work would not have been possible. His great interest in geochemistry and his passion for scientific research have inspired me in my pursuit of professional development.
I am particularly grateful to Prof. Zhifei Liu of Tongji University for his enthusiasm for this research project since the early stages, for his organizing of seawater sampling campaigns, and for my visits to Tongji University. Despite his busy schedules, he has always taken the time to share his thoughts regarding the progress of this work.
Particular thanks also go to Prof. Norbert Frank and Dr. Eric Douville for organizing my work in the geochemical lab at the Laboratoire des Sciences du Climat et de l'Environnement (LSCE) and for their constructive comments during the preparation of the manuscripts. Prof. Giuseppe Siani is much appreciated for sharing his expertise in foraminiferal identification and for fruitful discussions during the preparation of the texts.
Many people have helped me carry out essential laboratory work for this thesis. It has been a great pleasure to work with them. Special thanks go to François Thil and Quentin Dubois-Dauphin for their invaluable assistance with the Nd isotope analysis using the MC-ICP-MS instrument. I also thank Louise Bordier for her assistance in analyzing element concentration using the ICP-MS instrument whenever needed. Thanks also go to Eline Salle for her supervision of work carried out in the clean lab and for her assistance in solving each problem I encountered.
I would like to thank all of the members of the Paléoclimats et Dynamique Sédimentaire team at GEOPS and the members of the LSCE lab whom I cannot unfortunately name
individually here. My life would have been much less fun without the laughs and similes we shared. I enjoyed every small moment I spent with all of them.
I’m also grateful to the members of the jury for their willingness to review this thesis and for helping me to improve it.
The seawater sampling cruises were financially supported by the Natural Science Foundation of China projects (No. 91128206 and 40925008). I would like also thank the China Scholarship Council for the full scholarship support of my four-years stay in France.
Finally, I am eternally grateful to my very beloved family. Particular thanks to my loving parents for all their unconditional love and support for everything I do.
3
Contents
Acknowledgements ...
1General introduction ...
7Chapter 1: General background ...
17Geological, hydrological and climatological settings ... 17
1.1 Physiography of the study area ... 18
1.2 Climatological and palaeoclimatological settings ... 19
1.3 Hydrological setting ... 22
1.3.1 Hydrology of the Pacific Ocean ... 22
1.3.2 Hydrology of the South China Sea ... 30
1.4 εNd as a proxy for reconstructing ocean circulation ... 35
1.4.1 The Sm/Nd geochemical system ... 35
1.4.2 Nd cycle in the ocean ... 37
1.4.3 Nd isotopic composition of water masses in the western Pacific Ocean and the SCS ... 40
1.4.4 Available archives for reconstructing past seawater εNd ... 44
1.5 Geological and sedimentological settings and present day distributiosn of εNd in river- and in surface sediments of the SCS ... 47
1.5.1 Geological and sedimentological settings ... 48
1.5.2 Present day distribution of εNd in river- and surface sediments of the SCS. . 52
1.6 State of the art of past seawater εNd records available in the Pacific Ocean: implications for past hydrological changes ... 54
1.7 Summary of Chapter 1 ... 57
Chapter 2: Material and methods ...
592.1 Material ... 60
2.1.1 Seawater sample collection ... 60
2.1.2 Sediment samples ... 65
2.2 Methods ... 68
2.2.1 Seawater pre-concentration and chemical procedures prior to instrumental measurement ... 68
2.2.2 Cleaning procedures for foraminifera ... 70
2.2.3 Bulk sediment leaching procedures... 71
2.2.4 Ion chromatographic purification ... 71 2.2.5 Analytical procedure for determining REE concentration in seawater samples
... 74
2.2.6 Analytical procedures for measuring REE concentration in foraminifera and Fe-Mn coatings ... 74
2.2.7 Nd isotopic composition analyses ... 75
Chapter 3 ...
77Introduction ... 77
New insights into hydrological exchange between the South China Sea and the western Pacific Ocean based on the Nd isotopic composition of seawater ... 78
Abstract ... 78
3.1 Introduction ... 79
3.2. Hydrological setting ... 82
3.3. Material and methods ... 85
3.4. Results ... 91
3.5. Discussion ... 99
3.6. Conclusions ... 106
Chapter 4 ...
109Introduction ... 109
Neodymium isotopic composition in foraminifera and authigenic phases of South China Sea sediments: implications for the hydrology of the North Pacific Ocean over the past 25 kyr ... 110
Abstract ... 110
4.1. Introduction ... 111
4.2. Hydrological setting ... 114
4.3. Material and methods ... 117
4.4. Results ... 121
4.5. Discussion ... 126
4.6. Conclusion ... 133
Chapter 5 ...
137Introduction ... 137
News insights into the hydrology of the north-western subtropical Pacific Ocean based on εNd investigations of South China Sea sediments ... 138
Abstract ... 138
5.1 Introduction ... 139
5.2. Seawater εNd and the hydrological settings of the Philippine Sea and the SCS ... 143
5
5.3. Material and methods ... 145
5.4. Results ... 150 5.5. Discussion ... 151 5.6. Conclusions ... 162
Chapter 6 ...
165 Conclusions ... 165 Perspectives ... 169References ...
171Appendix ...
1977
General introduction
Aims and scope of the study
In this section I outline the state of the art of Pacific Ocean hydrology, as well as the objectives of the present study. The main objective of this study is to reconstruct the hydrology of the western Pacific (Philippine Sea) during the last deglaciation and the Holocene using the εNd analysed on biogenic and authigenic phases of sediments from the northern South China Sea (SCS). To achieve this primary scientific objective, it was first necessary to constrain the Nd isotopic composition of water masses of the Philippine Sea and the northern SCS that up to now have remained poorly documented. In a second step, REE concentrations and Nd isotopic signatures of different species of foraminifera, cleaned using different procedures, as well as Nd extracted from authigenic Fe-Mn oxide fractions dispersed in sediment, have been investigated in order to test the ability of such archives to reconstruct past seawater Nd isotopic composition and to reconstruct past variability of ocean circulation in the northern SCS. In addition, the structure of this thesis and a summary of the contents of the constituent chapters are provided.
It is now widely recognized that large-scale thermohaline ocean circulation is one of the major factors driving the world’s climate (Broecker and Denton, 1990; Rahmstorf, 2002; Clark et al., 2002). It affects climate through heat redistribution by surface current flow from the equator to sub-polar latitudes and it also affects regional temperature. Changes in the inter-basinal transfer of surface return flow also causes warm waters to exchange between ocean basins or to pool in the subtropics at shallow and intermediate depths, thereby affecting regional temperature and the evaporation/precipitation balance. In addition, changes in deep-water circulation and stratification have the potential to change the carbon storage capacity of the ocean (Stocker and Wright, 1996; Rahmstorf, 1995, 2003; Toggweiler and Russell, 2008; Marchitto et al., 2007; Bryan et al., 2010). Intermediate and deep-water masses of the global ocean constitute an important carbon reservoir that has the potential to release a huge amount of CO2 to the atmosphere during reorganization of the ocean over time and at
different time scales (Francois et al., 1997; Sigman et al., 2000; Spero and Lea, 2002; Broecker and Peng, 1987).
Records of past global climate preserve evidence of large-scale changes in temperature and ice volume at glacial-interglacial transitions. Although the timing of ice ages is broadly driven by Milankovich orbital cycles, the small insolation changes require amplifying mechanisms in order to produce the large glacial - interglacial climate changes. Variation in North Atlantic Deep Water (NADW) production is a potential amplifier and has been suggested as a trigger for the rapid global climate shifts that occurred during the last glacial period (e.g. Dansgaard/Oeschger (D/O) cycles and Heinrich events). Carbon dioxide (CO2) is another
possible amplifier, on glacial-interglacial time scales, because its atmospheric concentration is predominantly controlled by changes in deep-ocean storage (Francois et al., 1997; Broecker and Denton, 1990; Yu et al., 2010) and in the terrestrial carbon reservoir (e.g. Schimel et al, 1997; Shao et al., 2013). The North Atlantic Ocean is a strategic area in which to study deep convection, which mainly occurs in the Greenland, Iceland and Norwegian Seas, and to define the dynamic of thermohaline ocean circulation through time; because of this it has been intensively investigated during recent decades (Duplessy et al., 1988; Oppo and Lehman, 1993; Curry and Oppo, 2005). The Pacific Ocean has a major influence on global climate due to its large volume and its role as a potential carbon reservoir (Matsumoto et al., 2002; Yu et al., 2013). However, compared to the Atlantic Ocean, past hydrographical studies of the Pacific Ocean have been limited, particularly in the case of deep- and intermediate water masses.
9
Classic oceanographic proxies used to reconstruct past deep-water circulation, such as temperature and salinity, which are conservative in the ocean, as well as nutrient concentrations, such as phosphate, nitrate or silica, which are typical of certain water masses, are not preserved. Therefore, a number of proxies (tracers) have been developed to extract information from marine sediments regarding water mass distribution and flow in the past. The most commonly applied geochemical proxies for reconstructing past deep-water circulation have been stable carbon isotope composition (δ13
C), Cd/Ca ratio, and 14C (Keigwin, 1998; Marchitto et al., 2007; Boyle, 1988). Based on these proxies, it has been possible to establish the hydrological changes in the global ocean at different time scales. It is, however, difficult to make quantitative estimates of water mass mixing on the basis of the Cd/Ca or δ13C proxies because these proxies can be greatly affected by changes in surface productivity over time. Recent investigations have focused on an alternative approach to evaluating the degree of global thermohaline circulation, at glacial-interglacial timescales, based on the 231Pa/230Th ratio adsorbed in marine sediment particles (McManus et al., 2004). However, the circulation signal inferred from these proxies can be affected by secondary effects such as regional thermodynamics (Charles et al., 1993; Lynch-Stieglitz et al., 1995), changes in biological productivity (Mackensen et al., 1993), dissolution of foraminiferal calcite (McCorkle et al., 1995), changes in bottom-water calcite saturation (Marchitto et al., 2000) and margin scavenging (Marchal et al., 2000). The history of global paleo-circulation is often the subject of intense debate because the different proxies used to trace paleo-water masses sometimes produce conflicting results.
The neodymium isotopic composition (143Nd/144Nd) of seawater has been shown to be a useful proxy for tracing water mass provenance within the ocean (Lacan and Jeandel, 2004a, 2004b and 2005; Von-Blanckenburg, 1999; Molinar-Kesscher et al., 2014; Amakawa et al., 2004, 2009, 2013; Jeandel et al., 1998 and 2013; Grass et al., 2012; Cater et al., 2012). Its advantage over several other proxies (e.g. δ13C of dissolved inorganic carbon and Cd/Ca ratios as recorded by benthic foraminifera) lies in the fact that Nd isotopes are not known to be affected by biological processes and, thus, can serve as quasi-conservative water mass tracers (Frank, 2002; Goldstein and Hemming, 2003; Martin and Scher, 2004).
Nd isotopic composition is expressed as εNd=[(143Nd/144Nd)Sample/ (143Nd/144Nd)CHUR - 1]
x 10000, where CHUR stands for chondritic uniform reservoir and represents the present-day average earth value; (143Nd/144Nd)CHUR = 0.512638 (Jacobsen and Wasserburg, 1980). The
2003), is shorter than the global turnover time of the ocean (about 1000 yrs; Broecker and Peng, 1982). Consequently, as a result of continental lithogenic inputs of various ages, and boundary-exchange processes that occur at the continental margin (Lacan and Jeandel, 2005), intermediate- and deep-water masses acquire εNd from downwelling surface water (Goldstein and Hemming, 2003). In the ocean, the only way that the initial isotopic composition of a water mass can be changed is by the addition of Nd with a different isotopic composition through riverine or eolian inputs or by mixing with other water masses. However, away from the continental margins, and at short time scales (<500 years), εNd can be considered a quasi-conservative tracer. On the basis of these observations, εNd proxy has been widely used in order to track water mass mixing (Lacan and Jeandel, 2004a, 2004b, 2004c; Amakawa et al., 2004, 2009, 2013; Singh et al., 2012).
Although there are some limitations regarding the application of this proxy to track water mass provenance in certain areas of the ocean, numerous studies show that εNd can be reliably used in order to reconstruct past seawater evolution (Frank et al., 2006; Piotrowski et al., 2004, 2008; Pahnke et al., 2008; Basak et al., 2010; Martin and Scher., 2004). This proxy has already been used in paleo-oceanographic studies based on the dispersed authigenic ferromanganese oxide precipitates in sediments (Gutjahr et al., 2008; Pahnke et al., 2008; Piotrowski et al., 2004 and 2005; Rutberg et al., 2000), planktonic and benthic foraminifera (Burton and Vance, 2000; Roberts et al., 2010; Vance and Burton, 1999) as well as deep-sea coral skeletons (Colin et al. 2010; Copard et al., 2010, 2011, 2012; Robinson and van de Flierdt, 2009; van de Flierdt et al., 2006; Montero-Serrano et al., 2011) in order to track changes in water mass provenance and mixing at different time scales.
Throughout the last glacial-interglacial cycle, major reorganisation of water masses in the North Atlantic occurred. Several studies based on nutriment proxies (δ13C and Cd/Ca) provide evidence that, during the last glacial period, production of the North Atlantic Deep Water (NADW) was shallower, significantly weaker and less exported to the south than is the case today (Oppo and Fairbank, 1987; Duplessy et al., 1988; Mix and Fairbanks, 1985; Curry and Oppo, 2005; Labeyrie et al., 1996).
Furthermore, based on the reconstruction of past seawater εNd, the deep water of the Atlantic Ocean and the Southern Ocean were characterized by more radiogenic εNd values during the LGM than is the case in the Holocene (Ruterg et al., 2000; Piotrowski et al., 2004,
11
2005, 2012; Robert et al., 2010; Robinson and van de Flierdt, 2009; Skinner et al., 2013). This implies a decreasing influence of NADW and a higher northward propagation of the SSW in the Atlantic Ocean and Indian Ocean during the glacial period. This pattern is clearly intensified during millennial-scale cold episodes in the high latitudes of the Northern Hemisphere (e.g. Heinrich stadials - HS). In addition, 231Pa/230Th records reveal that NADW formation during the last glacial period was slower than it is today and reached a minimum during Heinrich event (Lippold et al., 2012; McManus et al., 2004). All of these studies using complementary hydrological proxies indicate that, during the last glacial- and deglaciation periods, several episodes of iceberg and meltwater discharge from the Northern Hemisphere ice sheets (e.g. Heinrich events - HE and Younger Dryas - YD) were closely associated with the collapse of NADW formation, cooling in a large part of the Northern Hemisphere, and warming in the southern hemisphere (Rahmstorf, 1994 and 1995; Broecker, 1998; McManus et al., 2004). These cold episodes observed in the high latitudes of the Northern hemisphere are associated with relatively warm episodes in the high latitudes of the Southern Hemisphere and are probably triggered by sudden changes in North Atlantic and southern Ocean deep water formation rates. This climate system mechanism corresponds to the bipolar seesaw (Broecker, 1998; Shakun and Carlson, 2010; Pedro et al., 2011; Siani et al., 2013).
Several studies that focus on the Indian Ocean have revealed similar hydrological changes as those observed the Atlantic Ocean, with a higher northward propagation of the SSW during the last glacial period (Bryan et al., 2010; Piotrowski et al., 2009; Romahn et al., 2014). For example, past seawater εNd records obtained from sediments in the equatorial Indian Ocean suggest a pronounced northward intrusion of deep Southern Sourced Water (SSW) during the last glacial period and the HS1 (Piotrowski et al, 2009; Wilson et al., 2012). In addition, chemical tracers (e.g. Δ14C, δ13C,) also show northward propagation of the Antarctic Intermediate Water (AAIW) during Heinrich events (Jung et al., 2009; Byran et al., 2010; Romahn et al., 2014).
Compared to the Atlantic Ocean, paleohydrological studies of the North Pacific Ocean have been limited, particularly for deep and intermediate water masses. This is mainly due to the low sedimentation rate which is a feature of Pacific Ocean deep-sea sediments, poor preservation of bio-carbonate due to shallow carbonate compensation depth (CCD), and problems relating to the use of hydrological proxies (e.g. δ13
C of dissolved inorganic carbon and Cd/Ca ratios as recorded by benthic foraminifera) for determining the main water masses of
the Pacific Ocean that undergo considerable mixing in the North Pacific. Consequently, the variability of the northward propagation of the SSW in the North Pacific is, as yet, not well constrained. Today, deep convection of the NPIW and NPDW is very weak, or absent, due to the low salinity lid of the North Pacific Ocean and water vapour transport related to the Asian Monsoon. The evolution of these water masses of the North Pacific since the last glacial period is not well understood and is still a matter of debate.
Nevertheless, glacial ocean stratification of the South Pacific has been observed in many studies (e.g. Shackleton et al., 1988; Sikes et al., 2000; Matsumoto et al., 2002; Galbraith et al., 2007; Siani et al., 2013). Deep-water reservoir ages that are older than present day ages have been identified to the east of New Zealand during the glacial period, associated with the isolation of deep-water from atmosphere (Sikes et al., 2000). In the eastern South Pacific Ocean (off the southern Chilean coast), differences in foraminifera benthic - planktic 14C and δ13C also support the theory of the occurrence of less ventilated deep water in the glacial South Pacific Ocean and provide evidence for two major periods of enhanced upwelling in the southern Ocean during the last deglaciation. This could be an important mechanism responsible for the abrupt deglacial atmospheric CO2 rise (Siani et al., 2013). This last study suggests synchronous
changes in the Southern Ocean circulation and Antarctic climate during the last deglaciation. Recently, Basak et al. (2010) have reported on a study of εNd from core MV99-MC19/GC31/PC08, collected near southern Baja California, permitting the identification of variations in the relative proportions of NPIW and AAIW over the past 38 kyr. The variations observed support the concept of an increased contribution of AAIW at the beginning of the deglaciation (during the Heinrich Stadial 1 - HS1), suggesting that old carbon was transported from the deep southern abyss to the shallow tropics via the AAIW.
It has been suggested that increased δ13C of benthic foraminifera in the subarctic Pacific Ocean are probably due to enhancing enhanced formation of the NPIW during the last glacial period (Rella et al., 2012). It was also recently suggested that the deep-water of the North Pacific was directly ventilated by dense waters formed in the subarctic Pacific during HS1. Recently, Okazaki et al. (2010) have compiled 14C data from benthic and planktonic foraminifera from several cores in the North Pacific and have shown that ventilation age decreased drastically during the last HS1 event. In particular, they argue for a greater northward advection of salty subtropical waters to the subarctic gyre, overcoming the halocline (Emile-Geayet al., 2003), and forming “deep waters” during HS1. Indeed, there are many signs
13
of increased ventilation recorded in sediments deposited within the upper portion of the North Pacific water column during HS1 (Ahagon et al., 2003; Duplessy et al., 1989; Mix et al., 1999; Sagawa and Ikehara, 2008). However, a number of geochemical proxies, previously measured at multiple deep North Pacific core sites between 2710 and 3640 m, are inconsistent with local ventilation of the lower half of the ~5000 m deep water column at this time. Among these measurements, the high-resolution radiocarbon data of Lund et al. (2011) suggest that the waters at 2710 m were actually very poorly ventilated (i.e. 14C-depleted) during the HS1, although these authors note the potential input of 14C-derived carbon from geological reservoirs at this time. In addition, redox sensitive elements show that there was no deep-water formation in the North Pacific during the HS1 but support the idea that ventilation in the North Pacific during the HS1 was restricted to the NPIW above 1300 m (NPIW) (Jaccard and Galbraith, 2013). δ13C values of benthic foraminifera investigated from several cores collected at different water depths indicate that strong ventilation only occurred at mid-depth in the North Pacific during the HS1 (Bostock et al., 2010; Max et al., 2014). Consequently, there is still debate regarding the possible formation of intermediate- deep-water masses (NPIW, NPDW) in the Pacific during deglacial North Hemisphere cold events when NADW formation had collapsed (HS1, YD) (Mix et al., 1999; Ohkushi et al., 2003; Okazaki et al., 2010; Rella et al., 2012; Herguera et al., 2012; Rae et al., 2014).
The objectives of this study
The South China Sea (SCS) is a semi-enclosed, marginal sea connected to the western subtropical North Pacific through the deep Luzon Straits. It receives deep-water masses from the Philippine Sea that result from the mixing of the Northern- (NPDW and NPIW) and Southern (SSW) Sourced Water masses. Consequently, the northern SCS constitute an ideal location in the western Pacific Ocean for reconstructing past hydrological changes in deep-water masses of the subtropical Pacific Ocean that, as yet, remain poorly documented. As εNd values of the NPDW/NPIW in the North Pacific are characterized by more radiogenic values (-4) than the UCDW in the South Pacific (-6 to -8) (Amakawa et al., 2004 and 2009; Piepergras and Wasserburg, 1980), εNd could be a useful proxy to constrain past changes in water mass provenance and mixing during the last deglaciation and the Holocene in the western subtropical North Pacific Ocean.
The aim of this study is to reconstruct the evolution of the hydrology of the western subtropical North Pacific Ocean by using εNd proxy analysed on foraminifera and dispersed authigenic ferromanganese oxide precipitates in sediments from deep-sea cores collected in the northern SCS. Over the last decade, several studies have reported distinct Nd isotopic compositions for the main deep-water masses of the Pacific Ocean (Amakwa et al., 2004, 2009, 2013; Piepergras and Wasserburg, 1980). However, the distribution of the Nd istotopic composition of seawater from the Philippine Sea and the SCS is not yet established. In addition, in marginal areas, seawater Nd isotopic composition can be affected by processes of “boundary exchange’’ involving some combination of release, removal and exchange of Nd between seawater and ocean margin sediments (Lacan and Jeandel, 2001 and 2005; Grenier et al., 2013). This process, mostly observed in modern seawater studies, has the potential to modify the εNd composition along deep-water flow paths in some locations of the Ocean (e.g. Jeandel et al., 1998; Lacan and Jeandel, 2001 and 2005; Amakawa et al., 2009; Carter et al., 2012; Grasse et al., 2012). Consequently, before using the εNd proxy on deep-sea sediments of the SCS for the purpose of hydrological reconstruction, it is absolutely necessary to establish the spatial distribution of dissolved Nd isotopic composition of the main water masses of the Philippine Sea and the northern SCS. It is also necessary to establish the importance of “boundary exchange’’ on the εNd values of the intermediate and deep-water masses of the SCS. Intermediate and deep-water masses that enter the SCS should not be strongly modified by sediments from the margin of the northern SCS that are characterized by unradiogenic Nd isotopic composition.
It is also necessary to carefully establish the reliability of Nd isotopic composition obtained from the Fe-Mn oxide fraction leached from sediments and foraminifera with εNd seawater. To test the viability of this climatic archive, we have investigated modern sediments (core-top samples) from several cores located in different part of the SCS. We have also finalised chemical protocols to extract the seawater Nd isotopic composition incorporated in the foraminifera and Fe-Mn oxide coatings of the SCS sediments. Finally, we have analysed the Nd isotopic composition of foraminifera and of dispersed authigenic ferromanganese oxide precipitates in sediments from one sediment core located in the northern SCS in order to reconstruct past variability of ocean circulation in the northern SCS during the last 25 kyr.
The results of all investigations undertaken as part of this thesis are organized in six chapters.
15
In chapter 1, I present the hydrological and geological settings of the Philippine Sea and the SCS, the Nd cycle in the ocean and the εNd proxy, the climatological setting around the SCS and a brief overview of hydrological changes and seawater εNd records available for the Pacific Ocean.
In chapter 2, I present the scientific strategy used to reply to the scientific questions addressed in this study. I present the material that we have selected in order to investigate modern and past hydrological changes of the Philippine Sea and the northern SCS, and I describe all procedures that have been used to analyse REE concentrations and Nd isotopic compositions of seawater samples, foraminifera and Fe-Mn oxide coatings.
In chapter 3, I present, for the first time, the vertical distribution of the Nd isotopic compositions of seawater samples collected from 16 stations located in the western Philippine Sea, in the Luzon Straits and in the northern SCS along the trajectory of the deep water which enters the SCS. These results allow me to (1) constrain the Nd isotopic composition of water masses along the west Pacific and the northern SCS that, up to now, has been documented; (2) track hydrological exchange through the Luzon Straits; and (3) establish if there is currently any impact from the process of “boundary exchange” in the SCS, between water masses entering the SCS and sediments from the margin, which are characterized by very contrasting εNd values ( -4 and -12, respectively).
In chapter 4, I establish the analytical procedures permitting the extraction of present day seawater εNd values from different archives (authigenic Fe-Mn oxides and benthic - planktonic foraminifera). In this study, we have tested a number of different analytical cleaning procedures applied to foraminifera samples in order to remove Fe-Mn coatings. εNd values obtained on modern foraminifera for the SCS (core-top samples) have been compared to those of seawater obtained by means of the analyses presented in chapter 3. Results suggest that the Nd isotopic composition incorporated on foraminifera represent bottom water εNd regardless of the species (benthic and planktonic foraminifera). This allows us to determine the best chemical cleaning procedure in order to extract seawater εNd from SCS sediments. We have also demonstrated that εNd extracted from Fe-Mn oxide coatings can be readily affected by the dissolution of lithogenic particules.
In chapter 5, I present a seawater εNd record spanning the last 30 cal kyr BP obtained from the planktonic foraminifera. This is the first seawater εNd record obtained in the deep water masses of the SCS and it allows us to define new constraints on the hydrology of the western subtropical Pacific Ocean (Philippine Sea).
17
Chapter 1: General background
Geological, hydrological and climatological settings
In this first chapter, I present important general background information that permits the reader to better understand the scientific problematic and the scientific strategy for this study. Firstly, I present the physiography of the study area and the hydrological setting of the Philippine Sea and the South China Sea (SCS). I outline the Nd cycle in the ocean and present the advantages and limitations of the use of Nd isotopic composition as a proxy for reconstructing ocean circulation. I go on to describe the geological setting and the εNd of river sediments and surface sediments of the study area because interactions between detrital particles and seawater have previously been shown to have an impact on seawater εNd. In the last sections, I describe the climatological setting of the SCS and provide a brief overview of hydrological changes and past seawater Nd records from the Pacific Ocean covering the past 35 kyr period. This allows me to introduce a past seawater Nd record that will be used later for comparison with our new εNd record.
1.1 Physiography of the study area
The main topographic features of the Pacific Ocean are shown in Figure 1.1. The Pacific Ocean is the largest of all the earth’s oceans. It covers an area of 178.106 km2 and represents 40% of the total surface area of the world’s oceans. The inter-oceanic ridge system in the Pacific Ocean is located close to the eastern boundary, forming a large southeastern Pacific Ocean similar in size to the Indian Basin.
The central and the northern Pacific Ocean are subdivided, more by convention than topography, into the Northeast Pacific, Northwest Pacific, Central Pacific, and Southwest Pacific Basins. Another notable feature of the Pacific Ocean is that its ocean floor contains a large number of volcanic seamounts, particularly in the Northwest and Central Pacific Basins.
There are several marginal seas located along the western boundary of the Pacific Ocean. Marginal seas located in the western equatorial Pacific (Coral Sea, Sulu Sea, Celebes Sea, Philippine Sea and South China Sea) are of a great importance for global oceanic circulation because they permit connection of deep- and surface water masses between the Pacific Ocean and the Indian Ocean (Fig 1.1).
Fig. 1.1. Map of the main topographical features of the Pacific Ocean and its marginal seas. The acronyms WCB and ECB stand for the West Caroline Basin and East Caroline Basin, respectively.
19
The South China Sea (SCS) is the largest marginal sea in the western North Pacific. In the north it connects with the Philippine Sea and the East China Sea through the Luzon Strait (>2000 m) and the Taiwan Strait (<100 m) respectively (Fig 1.2). In the south, it connects with the Sulu and Javas Seas through the relatively shallow Mindoro (~200 m) and Karimata (<50 m) straits, respectively (Fig.1.2). On the west, the SCS is surrounded by a number of large rivers (e.g. Pearl River, Red River and Mekong River).
Fig. 1.2. Geographical map of the SCS. The main Asian rivers, as well as straits connecting the SCS with surrounding seas, are indicated.
1.2 Climatological and palaeoclimatological settings
The SCS and its surrounding continent are located in the low latitudes of the western Pacific. The tropical western Pacific is an important region in regulating global heat and
moisture transport (Trenberth et al., 1998; Qu et al., 2009). The regional climate is primarily affected by the East Asian Monsoon which is a sub-system of the Asian Monsoon (Wang et al., 2001 and 2004).
The Asian monsoon results from a contrast in land-sea sensitive heating (Webster, 1987) and is characterized by seasonal switches in wind direction, precipitation and runoff. It is a major determinant of land vegetation over SE Asia. During winter months, temperatures over the Asian continent, being lower than those over the Pacific Ocean, induce low surface pressure over the ocean and the development of a high pressure cell over northern Asia. This pressure gradient produces cold, dry winds that blow from Central Asia to the SCS. Conversely, during summer, the Asian continent heats up while the ocean stays cooler, inducing a low atmospheric pressure cell over central China, a reversal in wind direction and heavy monsoon rainfall over southern and eastern Asia (Webster, 1987). At the same time, this monsoon climate also has an influence on the SCS by generating a seasonal reversal of the oceanic circulation pattern (e.g. Wang and Wang, 1990).
Most of the paleoclimatic studies which permit the reconstruction of long-term East-Asian paleo-monsoon intensity variations, are based, primarily, on Chinese Loess Plateau deposits using several proxies such as grain size, magnetic susceptibility or clay minerals distribution (An et al., 2000; Porter and An, 1995; Xiao et al., 1995; Lu et al., 2000). Similar studies have been undertaken of deep-sea sediments from the Indian Ocean and the SCS. Such reconstructions have shown that, during glacial periods, summer East Asian monsoon intensity was weaker, whereas the winter one was stronger (Wang and Wang, 1990; Miao et al., 1994; Clemens et al., 1996; Pflaumann and Jian, 1999), when compared to the present conditions. These differences were marked by an increase in aridity over the northern Asian continent and significant eolian dust inputs, which originated from Chinese deserts, were deposited on the Central China Loess Plateau and in the northern Pacific Ocean. In contrast, interglacial periods are characterised by a stronger summer monsoon, coupled with strengthened southwestern winds and enhanced monsoon rainfall over the continent (Morley and Heusser, 1997; Lu et al., 1999).
In most of these studies, winter monsoon strength variations are characterized by strong cyclicities at ~100 and 41 kyr, with considerably less variance in the 23 kyr precession band, indicating a link between high-latitude climatic changes and monsoon variations (e.g. Ding et al., 1995; Xiao et al., 1995; Wang, 1999; Jian et al., 2001; Beaufort et al., 2003). Recent
21
studies have shown that the East Asian summer monsoon pattern could be independent from the winter monsoon intensity and be characterised by different orbital frequencies, which imply separate forcing controls. In terrigenous sediment records from the South China Sea, a strong 23 kyr precession cycle has been observed in East Asian summer monsoon intensity over the last glacial-interglacial cycles (Boulay et al., 2005), and during the period between 3.2 and 2.5 Ma (Wehaussen and Brumsack, 2002). Over low latitude areas, solar insolation, determined by the precession of the Earth orbit, has also been identified as the main factor controlling Indian summer monsoon intensity. It has already been widely studied in marine sediments from the Arabian Sea (e.g. Prell, 1984; Clemens et al., 1991; Clemens and Prell, 2003) and the Bay of Bengal (Colin et al., 1998 and 1999).
For the Holocene, several studies (stalagmite and SCS records) indicate a reduction in East Asian Monsoon precipitation well correlated with a southward shift of the ITCZ which, itself, is mainly driven by a reduction in summer solar insolation (Wang et al., 2005). At a shorter time scale, rapid changes in the East Asian Monsoon have been observed during the last climatic transition associated with a reduction in summer monsoon activity during the northern hemisphere cold event of the Younger Dryas (Wang et al., 2001). Such rapid climatic changes in the East Asian Monsoon have also been observed during the Holocene (Wang et al., 2005).
For the last glacial period, East Asian monsoon variations on Dansgaard–Oeschger time scales (1500 years) were reported from the SCS (Wang et al., 1999; Bühring et al., 2004; Higginson et al., 2003), the Sulu Sea (de Garidel-Thoron et al., 2001; Oppo et al., 2001), and the Sea of Japan (Tada et al., 1999). As an overriding feature these records reveal increased summer East Asian monsoons during interstadials, and increased winter East Asian monsoons during stadials. These marine-based results are consistent with the exceptionally well-dated monsoon records from Hulu cave (Wang et al., 2001) as well as with results from loess sections in China (Porter and An, 1995; An, 2000). In addition, opposite rainfall patterns have been observed in the northern and southern tropics during Heinrich cold events (H1) (Peterson et al., 2000; Wang et al., 2001; Placzek et al., 2006). However, the age models associated with these various archives are insufficient to assess either the fine details of phasing within the monsoon records themselves, or the details of monsoon phasing relative to high-latitude climate change, at the level necessary to determine which system initiates these abrupt transitions.
Figure 1.3. Modern Asian monsoon system: (A) distribution of modern monsoonal regions in Asia, Africa and Australia (Wang et al., 2005); (B) pressure and surface wind pattern in winter and (C) in summer.
1.3 Hydrological setting
1.3.1 Hydrology of the Pacific Ocean
23
the Pacific Ocean have been carried out which have permitted us to greatly improve our understanding of the hydrology of the northern Pacific (Tsuchiya., 1991; Talley., 2007; Yasuda et al., 1997; Kaneko et al., 2001; Kawabe and Fujio, 2010). Salinity and water masses within different layers of two cross- sections in the North Pacific (24ºN) and the South Pacific (28ºS) are illustrated in Figure 1.4. This schematic map shows similar water mass structures in the North Pacific and South Pacific. Southern source waters from the South Pacific are observed in the North Pacific, but hardly any northern source water is observed in the South Pacific. This situation is essentially different from that of the Atlantic Ocean. To better understand what causes this particular characteristic, the hydrology of the Pacific Ocean is described in detail in the following section.
Figure 1.4. Spatial distribution of salinity and water mass components along cross sections centered at 24º N (a and b) and at 28º S (c and d) (Talley et al., Eds., 2011).
1.3.1.1 Surface water hydrology
The main surface currents of the Pacific Ocean are illustrated in the Figure 1.5.
Fig. 1.5. Map showing the main surface currents in the Pacific Ocean (Talley et al., Eds., 2011).
In general, the surface layer, characterized by the highest salinity, originates in the region between latitudes 20ºN and 30ºN where evaporation dominates over precipitation (Suga et al., 2000). This extremely salty water is called North Pacific Tropic Water (NPTW) and occupies the layer above 200 m. The NPTW flows westward and is then advected in the North Equatorial Currents (NEC) (Suga et al., 2000; Lukas et al., 1996). On the western boundary of the North Pacific, the NPTW separates into two branches, the northward branch flows in the
25
Kuroshio Currents which contribute to the maximum salinity water component in the Philippine Sea. The southward branch of the NPTW, presumably carried by the Mindanao Currents, enters the Indian Ocean through the Indonesian Throughflow or is carried back to the North Pacific by the North Equatorial Countercurrent (NECC) (Fig 1.5) (Suga et al., 2000; Qiu and Lukas, 1996). Through salt exchanges with other water masses, the NPTW is the major source of salinity in the North Pacific and becomes gradually less saline along its westward pathway (Li and Wang, 2012).
1.3.1.2 Intermediate Water
At a greater water depth, there is a salinity minimum (34.0-34.4) clearly evident in the subtropical gyre of the North Pacific within a depth range of 300 to 900 m (You et al., 2000; Talley, 1993). This water mass corresponds to the North Pacific Intermediate Water (NPIW). It is believed that this NPIW is mainly formed in the eastern part of the Okhotsk Sea where the Kuroshio Extension mixes with the Oyashio currents (Talley., 1993; Yasuda et al., 1996; You et al., 2000) (Fig. 1.6). This water mass is formed by shallow convection in the Okhotsk Sea driven by wintertime brine rejection and is characterized by low salinity and high oxygen content. This relatively fresh water mass dominates most of the mid-depth layer (300-1000 m) in the North Pacific subtropical gyre. However, several recent studies have shown that the sources and process of formation of the NPIW, as well as the pathways of the NPIW in the North Pacific, are still not fully established (Miyao and Ishikawa, 2003; You et al., 2000; You., 2003; Nakano et al., 2007).
For the NPIW two pathways are currently debated in the literature (Fig 1.6). On the one hand, previous studies assumed that a considerable amount of the NPIW is transported into the subtropical gyre by the recirculation of the Kuroshio Extension in the North Pacific, which turns southwards around 160ºE and then back to the western part of the subtropical gyre (Talley., 1993; Yasuda et al., 1997; Masujima et al., 2003). A recent numerical study supports the existence of this short route for the NPIW (Fujii et al., 2013). On the other hand, other studies carried out by You (2003, 2010) have shown a long circulation pathway for the NPIW in the subtropical gyre, which implies that the NPIW spreads far further east of the 160ºE and enters the subtropical gyre at 140ºW.
(AAIW) and is also characterised by a salinity minimum (34.1-34.5) between 500 and 1500 m depth (Qu et al., 1998; Qu and Lindstrom, 2004; Lindstrom et al. 1990; Tsuchiya 1991) (Fig 1.6). AAIW generally originates from subduction of Antarctic Surface Water in the Antarctic convergence region and spreads to the west of South America (Reid, 1997; Talley, 1999). During winter, local winter convection induces a salinity minimum water. This water mass is injected into the AAIW. AAIW is carried to the Southeast Pacific through a wind-driven subtropical gyre. From there, it moves anticlockwise around the gyre and flows westward at low latitudes (~20ºS) as a tongue of low salinity and high oxygen (O2) extending well into the
Coral Sea (Fig 1.6). AAIW then spreads northward from the Coral Sea to the Solomon Sea and from the Solomon Sea to the Bismarck Sea. From there, AAIW is spread into the western North Pacific carried by the New Guinea Coastal Undercurrent (NGCUC) (Lindstrom et al. 1990; Tsuchiya 1991; Zenk et al., 2005).
After crossing the equator in the western Pacific, part of the AAIW flows eastward in the equatorial circulation, while the rest continues northward along the western boundary of the North Pacific (Reid 1965; Tsuchiya 1991). This northward AAIW is transported by the New Guinea Coastal Undercurrent (NGCUC) and the Mindanao Undercurrent, through which AAIW extends to about 15ºN along the Philippine coast (Qu et al. 1999; Qu and Lindstrom, 2004). The northern boundary between AAIW and NPIW is around 15ºN which prevents AAIW entering into the North Pacific subtropical gyre. The contribution of the AAIW becomes less pronounced as it flows northward via the western boundary currents into the North Pacific at 15ºN (Talley., 2007; Qu and Lindstrom, 2004).
27
Fig. 1.6. Schematic map of mid-depth circulation in the Pacific Ocean. The round solid dot represents the main formation region of NPIW. The acronyms of MWR, EUC and NGCUC represent Mixed Water Region, Equatorial Under Current and New Guinea Coastal Undercurrent, respectively. The circulation mode is adapted from Zenk et al (2005), Kawabe and Fujo (2010) and You (2003).
1.3.1.3 Deep water masses
The deep water mass of the Pacific is characterized by two deep water masses, one originating from the Southern Ocean and one originating from the North Pacific (Fig. 1.7). Unlike the small amount of transport from the Pacific Ocean to the Atlantic Ocean through the Arctic Ocean, the water exchange between the Pacific Ocean and the Southern Ocean is estimated as being up to 100 Sv. The Southern Ocean circulation is dominated by the strong, deep, eastward-flowing current known as the Circumpolar Deep Water Current (CDW), which turns around Antarctica.
Fig.1.7. Schematic map of the upper deep-water circulation in the Pacific Ocean (after Kawabe and Fujio, 2010). Volumes of water masses transported by the main currents are indicated in Sv (106 m3s–1) within the dark circles.
The CDW is the very thick layer that extends from below the AAIW to above the dense bottom waters that are advected on the Antarctic shelves. The CDW contains a mixture of deep waters from each of the ocean basins: North Atlantic Deep Water (NADW), Pacific
29
Deep Water (PDW), and Indian Deep Water (IDW), as well as water formed locally within the Weddell Sea (Rodman and Gordon, 1982; Gordon et al., 2001; Oris et al., 1999; Rodehacke et al., 2007). It upwells south of the Antarctic Circumpolar Current (ACC) where a portion becomes the source of the bottom waters around Antarctica. Some of these dense Antarctic waters also modify the CDW which is usually divided into Upper CDW and Lower CDW (UCDW and LCDW) (Whitworth et al., 1999; Orsi et al., 1999; Rintoul et al., 2001).
UCDW originates from the Southern Ocean and is identified as an oxygen minimum layer created by the high contribution of low oxygen PDW and IDW and local deep water formed in the Antarctic area to the south of the Polar Front (PF). UCDW flows at a water depth of between 600 and 2000 m. In the South Pacific, UCDW lies below the AAIW and above the CDW. In the North Pacific, modified UCDW lies between NPIW and PDW (Fig 1.4).
Fig.1.8. Schematic map of the lower deep-water circulation in the Pacific Ocean (after Kawabe and Fujio, 2010). Volumes of water masses transported by the main currents have been reported in Sv (106 m3s–1) within dark circles. The number x+ (x–) means a little more (less) than x Sv.
The LCDW is recognized in the Pacific by low temperatures and higher salinity than the overlying PDW. The LCDW enters the Pacific in the Deep Western Boundary Current (DWBC) in the southwest, east of New Zealand (Fig. 1.8). In the Central Pacific, the volcanic arc of the eastern Philippine Sea induced a separation of the LCDW into a western and an eastern branch. The western branch (about 4Sv) enters the Philippine Sea and flows northward to the Northwest Pacific Basin (Kawabe et al., 2003). The eastern branch (about 8 Sv) propagates eastward to the Northeast Pacific Basin through the western edge of the Central Pacific Basin (Kawabe et al., 2005 and 2009; Fujio et al., 2000). The Properties of the LCDW change while it propagates northward as a result of upwelling to the PDW in the North Pacific (Joyce et al., 1986; Johnson and Toole, 1993).
Pacific Deep Water (PDW) is observed everywhere in the North Pacific and is characterised by the absence of contact with the atmosphere. It is formed from internal mixing and upwelling of waters from the Southern Ocean (Talley, 2007). It is formed within the Pacific from upwelled bottom waters and modified UCDW/LCDW. In the North Pacific, north of 40ºN, the very oldest PDW is characterized by the lowest salinity of the North Pacific. The water acquires this property through downward diffusion of the upper-layer water mass that then forms “new” PDW corresponding to the North Pacific Deep Water (NPDW) (Talley & Joyce, 1992). PDW and UCDW occupy approximately the same density (and depth) range in the Pacific Ocean. The UCDW flows into the southeast Pacific whereas PDW flows to the west and then re-circulates to the South Pacific along the South American margin (Fig 1.7). The existence of this pathway of the PDW in the South Pacific is supported by silica concentration that indicates southward flow of PDW along the South American boundary (Kawabe and Fujio, 2010) (Fig 1.7).
1.3.2 Hydrology of the South China Sea
Regional hydrology investigations have been carried out in order to better understand the water masses in the SCS and its role in heat transportation in the region (Wyrtki, 1961; Qiu et al., 1984; Guo, 1985; Qu et al., 1997; Farris and Wimbush, 1996; Qu et al., 2000; Tian et al., 2006; Tozuka et al., 2007; Yuan et al., 2008). In general, the SCS is connected in the north to the Philippine Sea and the East China Sea through the Luzon Strait (>2000 m) and the Taiwan Strait (<100 m), respectively. In the south, it connects with the Sulu and Javas Seas through the relatively shallow Mindoro (~200 m) and Karimata (<50 m) straits, respectively (Fig.1.2).
31
The water exchange between the SCS and the surrounding seas involves a dominant inflow through the Luzon strait and a dominant outflow through the Karimata, Mindoro, and Taiwan straits. Recent studies have proposed a definition of this through flow as South China Sea Through Flow (SCSTF). These studies suggest that the SCSTF plays a key role in regulating the sea surface temperature pattern in the SCS and adjacent tropical Indian and Pacific Oceans (Qu et al., 2004, 2005, 2006, 2009; Tozuka et al., 2007 and 2009).
In addition, the surface circulation in the SCS is predominantly forced by the seasonal wind reversal during winter and summer monsoons. In general, during the winter, inflow of surface water into the SCS is predominant. On the contrary, during the summer an outflow of surface water predominates. (Fig. 1.9a and 1.9b). Within the water depth range of the thermocline, the intrusion of the Kuroshio Current into the SCS, during both summer and winter, has been observed in several studies (Farris and Wimbush, 1996; Caruso et al., 2006; Liang et al., 2008).
Fig. 1.9. Schematic map of the surface circulation in the SCS during the summer (a) and winter (b). (adapted from Fang et al., 1998).
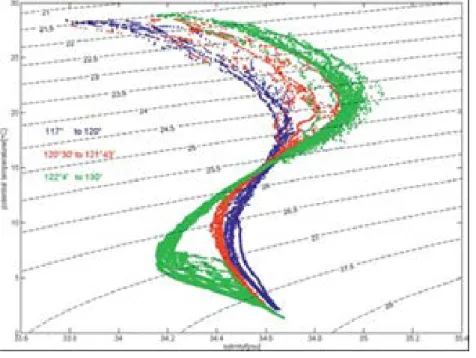
The Luzon Strait is the deepest channel connecting the SCS with the Philippine Sea. It permits the intermediate and deep-water exchange between the SCS and the Philippine Sea. The hydrographic observations along a cross section roughly centred at 21ºN are illustrated in Figure 1.10. This figure shows a similar pattern of water T°C and salinity on both sides of the
Luzon Straits (Fig.1.10). However, slightly different potential temperature-salinity (θ-S) profiles between the SCS and the Philippine Sea indicate that modification of the water masses takes place in the SCS (Tian et al., 2009; Xie et al., 2011). As described below, the surface and upper layer of the Philippine Sea are dominated by NPTW. There is an intrusion of NPTW into the Northern part of SCS but the propagation of this water mass is restricted to the Northern part of the SCS due to the outflow of the South China Sea Tropical Water (SCSTW) to the Philippine Sea (Gong et al., 1992; Chen and Huang, 1996).
Fig. 1.10. Diagram of potential temperature versus salinity of water stations located along a cross section centered around a latitude of 21ºN (Tian et al., 2009).
Both hydrographic observations and numerical models indicate that, in order to compensate for the inflow of surface water (NPTW) into the SCS, there is an outflow of intermediate water from the SCS at depths between 500 m and 1500 m (Chao et al., 1996; Tian et al., 2006; Li and Qu, 2006; Yang et al., 2010). This water mass is called the South China Sea Intermediate Water (SCSIW) and is characterized by a weaker salinity minimum (>34.4) compared to NPIW (34-34.4) in the western Pacific Ocean. This weaker salinity minimum of the SCSIW results from the mixing of surface water with deep waters of the SCS (Chen et al., 2001; Liu and Liu, 1988). Nevertheless, the actual pathway of the intermediate layer through the Luzon Straits is not well understood (Tian et al., 2006; Yang et al., 2010; Xie et al., 2011).
33
Several studies show that the net transport of the intermediate layer is eastward and indicate a strong seasonal modification of the spatial distribution of the flow across the Luzon Strait. Field experiments conducted in July 2007 by Yang et al. (2010) indicate, at the intermediate layer, the existence of a westward flow in the northern part of the strait and an eastward flow in the southern part (Fig 1.11 a, b). Whereas earlier investigations, carried out in October 2005, in the same area demonstrated a reversed flow pattern across the strait, in which a westward flow and an eastward flow occur in the southern and the northern part of the strait, respectively. Consequently, the properties of intermediate water in the Luzon Straits vary seasonally (Qu et al., 2000).
Fig.1.11. Flow velocity in the Luzon Strait, (a) and (b) show observation carried out in the October 2005 (winter) (Tian et al., 2006) and July 2007 (summer) (Yang et al., 2011), respectively. The dashed line indicates eastward flow whereas the solid line denotes westward flow. The area with westward flow is shaded in yellow.
Water masses below 2000 m in the SCS are characterized by relatively homogenous physical properties (T°C and S‰). They are similar to those of the western Pacific Ocean (Philippine Sea) at depths of around 2000 m (Li and Qu, 2006; Qu et al., 2006). PDW, characterised by low temperature (~2°C) and high salinity (>34.6), sinks in the deep SCS basin immediately after it crosses the Luzon Strait. It enhances vertical diffusion and upwelling and potentially contributes to upper layer circulation (Tian et al., 2009; Li and Qu, 2006; Qu et al., 2006). Both observations and models indicate that deep circulation in the SCS is strongly controlled by the complex bathymetry of the SCS (Li and Qu, 2006; Zhao et al., 2014; Wang et al., 2011; Zhang et al., 2014). It has been established that the PDW flows into the Luzon Straits mainly through the middle channel, then turns southward along the Luzon Trough, and finally enters the SCS (Fig. 1.12a). Forced by the Luzon overflow from the Pacific Ocean, basin-scale cyclonic circulation was found throughout the deep SCS. Embedded in the basin scale cyclonic circulation, a stronger sub-basin scale cyclonic circulation is seen around 116ºE in the central SCS where the current is probably influenced by a number of seamounts (Wang et al., 2011; Zhang et al., 2014) (Fig. 1.12b).
Fig. 1.12. (a) mean volume transport of the deep layer in the Luzon Straits from simulation (Zhao et al., 2014). (b) geostrophic current from 2400 m to the bottom, the light pink shading indicates water depths shallower than 2400 m. The dark pink shading indicates seamounts shallower than 3600 m (Wang et al., 2011).
35
water masses. As the intermediate water predominantly flows out of the SCS throughout the year, there is a strong inflow of deep water from the Pacific Ocean to compensate for this outflow. These processes induce the rapid turnover in the SCS deep water that has been recently estimated at around 30-50 years (Gong et al., 1992; Li and Qu, 2006., Wang et al., 2011). This suggests a very short residence time for deep-water in the SCS.
1.
4 εNd as a proxy for reconstructing ocean circulation
Numerous recent studies have demonstrated the great potential of Nd isotopic composition (143Nd/144Nd) applied to seawater samples, as well as to authigenic phases or biogenic carbonates of marine sediments, to establish present and past hydrological changes of the ocean (Ling et al., 1997; Van de Flierdt et al., 2004; Rutberg et al., 2000; Piotrowski et al., 2005, 2008; Robert et al., 2010; Copard et al., 2010; Colin et al., 2010). This relatively new proxy is currently well developed and is widely used by the paleoceanography community. In this section, I present background information regarding the Sm/Nd geochemical system, the Nd cycle in the ocean, an overview of present day distributions of dissolved Nd isotopic composition of the SCS and the Pacific, and an overview of the different archives available for reconstructing past seawater εNd through time.
1.4.1 The Sm/Nd geochemical system
Neodymium (Nd) is a lanthanides series element (or Rare Earth Element - REE) that has seven isotopes: 142Nd, 143Nd, 144Nd, 145Nd, 146Nd, 148Nd, and 150Nd. Of these, 143Nd is a radiogenic daughter isotope produced by α-decay of 147
Sm, which has a long half-life of approximately 1.06x10⁻¹¹ years (equations 1 and 2).
147
Sm 143Nd + α (equation 1) (143Nd)t = (143Nd)i + (147Sm)t (eλt - 1) (equation 2)
Where the (143Nd)t is the quantity of 143Nd measured, (143Nd)i is the quantity of initial 143
Nd, the (147Sm)t is the quantity of 147Sm measured, and the λ is the disintegration constant
As is it very difficult to analyse the abundance of isotope 143Nd, the ratio of radiogenic
143
Nd to stable 144Nd has been used for geochemical investigations and equation 2 becomes:
�143Nd 144Nd�𝑡= � 143Nd 144Nd�𝑖+ � 147Sm 144Nd�i�e λt-1� (equation 3)
Where the (143Nd/144Nd)t is the Nd isotopic ratio measured, (143Nd/144Nd)i is the Nd initial
isotopic ratio, and (147Sm/144Nd)t is the isotopic ratio measured.
The heterogeneity of the 143Nd/144Nd ratios of rocks depends mainly on the age differences and the fractionation of initial Sm/Nd ratios in the mantle and crust. Sm is selectively incorporated in mantle-derived oceanic basalts, whereas continental crust rocks are Nd-enriched. The Sm/Nd ratio of bulk earth can be assumed to be the same as that of chondritic meteorites. With increasing age, continental rocks display relatively lower
143
Nd/144Nd ratios while oceanic basalts display higher ones (Fig. 1.13a). Due to the long half-life of 147Sm, and the relatively comparable geochemical properties of the Sm and the Nd, the value range of the 143Nd/144Nd ratio analysed in rocks at the surface of the earth is very narrow. Nd isotopic compositions are, therefore, conventionally expressed using epsilon notation (εNd). This εNd is obtained by normalizing the 143
Nd/144Nd measured in samples to the 143Nd/144Nd ratio of the Chondritic Uniform Reservoir (CHUR), which represents the present day average earth 143Nd/144Nd ratios (equation 4):
εNd= �� 143Nd 144Nd�sample �143Nd 144Nd�CHUR -1� ×104
Where the (143Nd/144Nd)sample and (143Nd/144Nd)CHUR represent the measured Nd isotope
ratios in the sample and the CHUR, respectively. The (143Nd/144Nd)CHUR is 0.512638
(Jacobsen and Wasserburg, 1980).
For any rock, a negative or a positive εNd value implies that, on average over the history of the earth, the Sm/Nd ratio of that rock, or its precursors, has been lower/higher than the CHUR model. This in turn implies that the REE pattern of the rock, or its precursors, was light REE enriched/depleted (Fig. 1.13b). In general, crustal rocks are characterized by a wide range in εNd values, from 0 to -50, while mid-ocean ridge basalts (MORB) display positive εNd values of between 0 and + 12 (Piepgras and Wasserburg, 1980).
37
Fig. 1.13. (a) Evolution of the Nd isotopic composition in mantle and crust since 4.5 Ga. The bold line shows the evolution of the bulk earth or CHUR (chondritic uniform reservoir); also shown is the evolution of crust created at 3.5 Ga, the corresponding residual mantle, and the evolution of a continuously depleted mantle. (b) Evolution of bulk earth, crust, and mantle when 143Nd/144Nd is expressed by εNd (White, Ed., 2005).
1.4.2 Nd cycle in the ocean
Nd mainly exists in dissolved form in seawater (90 to 95 %), with a concentration of about 10-12 g/g which increases with water-depth (Jeandel., 1993; Amakawa et al., 2004; Singh et al., 2012). Its residence time, recently re-assessed to about 600 - 1000 yr (Tachikawa et al., 1999 and 2003), is shorter than the time for inter-ocean mixing. Consequently, through lithogenic inputs, water masses are characterised by different Nd isotopic compositions (Piepgras and Wasserburg, 1980; Jeandel, 1993; Jeandel et al., 1995; Lacan and Jeandel,
2004a; Lacan and Jeandel, 2004b; Lacan and Jeandel, 2004c; Lacan and Jeandel, 2005).
The provenances of the dissolved Nd in the ocean are outlined in the Figure 1.14. The dissolved Nd in the Ocean derives mainly from (1) the desorption of Nd from lithogenic particules originating mainly from eolian dust and riverine sediments; (2) dissolved Nd in rivers; (3) a process called “boundary exchange ”.
Fig. 1.14. Schematic diagram showing the main sources of dissolved Nd in the Ocean.
The contribution of each of these sources of Nd to the ocean, and the process involved in the global Nd oceanic cycle, are still poorly constrained. Over recent decades, great efforts have been made to better understand these issues (e.g. Arsouze et al., 2007; Rempfer et al., 2011; Lacan and Jeandel, 2005; Grenier et al., 2013; Grasse et al., 2012).
First of all, there is evidence that hydrothermal sources do not contribute significantly to the dissolved seawater Nd budget. It is generally admitted that the role of hydrothermal input is negligible because Nd, as well as all REEs, are scavenged quickly and very close to the hydrothermal sites (Michard et al., 1983; German et al., 1990; Halliday et al., 1992).
Riverine input, particularly in regimes of strong chemical weathering, is a very important source for the dissolved Nd budget of water masses, although most of the dissolved Nd load of rivers is precipitated in estuarine sediments (Frank, 2002; Elderfield et al., 1990; Ingri et al., 2000). Results from models also indicate that dissolved Nd input from rivers is an important component of the Nd cycle, particularly in the upper 500 m of the water column (Rempfer et
39
al., 2012).
Eolian dust can also influence the Nd isotopic signatures of surface waters by partial dissolution and desorption of dust particles. Tachikawa et al. (1997, 1999) suggested that up to 20% of the Nd contained in dust particles is released into seawater and, therefore, represents an important contributor to the dissolved Nd budget in the Atlantic Ocean. From REE patterns along an E-W transect across the Pacific Ocean, Greaves et al. (1999) showed that eolian inputs are important for the dissolved Nd budget of Pacific surface waters. In contrast, Jones et al. (1994) suggested that eolian sources of the Asian dust do not greatly modify the Nd isotopic composition of deep-waters in the NW Pacific. This is in agreement with recent simulations of the distribution of Nd in the ocean that indicate that Nd deriving from eolian dust inputs generally impacts only on the Nd isotopic composition of the upper layer of the ocean (Arsouze et al., 2007; Rempfer et al., 2012).
Earlier studies have indicated that continental margins play an important role in scavenging a number of elements in the ocean because of the efficient removal/deposition of the elements from the water column to sediments in areas affected by strong terrigenous fluxes (Anderson et al., 1990; Spencer et al., 1981). More recently, several studies have indicated an opposing interpretation of the role of the continent/ocean interface. These studies suggest an additional source of Nd to the Ocean induced by exchange of Nd between seawater and detrital particles delivered to the oceans from the continents by erosion (Lacan and Jeandel, 2001 and 2005; Grenier et al., 2013). Based on Nd isotopic composition analysis conducted on seawater located along four different oceanic margins (Fig. 1.15), Lacan and Jeandel (2005) showed, for the first time, that the Nd isotopic signatures of a water mass could be modified away from their original areas of production. They have demonstrated that the εNd of water masses flowing along an oceanic margin acquire the Nd isotopic composition of sediments from this margin. This modification of the Nd isotopic signature is caused by additional sources of Nd, whereas the Nd concentrations of the water masses show limited variations. This decoupling between Nd concentrations and Nd isotopic composition distributions in the ocean has been defined as the “Nd paradox”. A process called “boundary exchange” was proposed by Lacan and Jeandel (2005) to explain this “Nd paradox”. In this case, sediments on oceanic margins are not only the sink, but are also the source, of the Nd in the ocean. Indeed, “boundary exchange” corresponds to an exchange of elements (REEs) through the processes of absorption / desorption between water masses and sediments
deposited on the oceanic margin. Several studies have simulated Nd concentration and isotopic composition distributions in the Ocean (Arzouse et al., 2007, 2009; Grenier et al., 2011). Using different model configurations, Arzouse et al. (2007 and 2010) quantified the overall exchange rate of the “boundary exchange”. They found that the time needed for the oceanic margins to significantly imprint the Nd isotopic composition of the surrounding seawater ranges from 0.5 years for surface seawater to 10-50 years for deep water.
Fig. 1.15. Variations of the Nd isotopic compositions and Nd concentrations in different water masses flowing along 4 different oceanic margins (Lacan and Jeandel, 2005).
1.4.3 Nd isotopic composition of water masses in the western Pacific Ocean and the SCS
Compared with the large number of investigations carried out in the Atlantic Ocean, available data concerning Nd isotopic compositions in the western Pacific Ocean, and the surrounding continent, are scarce (Lacan et al., 2012, and reference therein).
41
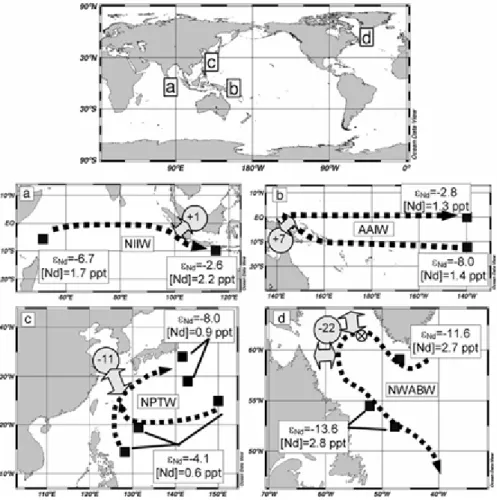
1.16. Available surface seawater εNd values for the SCS, obtained by Amakawa et al., (2000), are listed in Fig. 1.17. Unfortunately, εNd values for intermediate and deep-water masses of the SCS and the Philippine Sea are not available. However, from all of these studies, it is possible to determine the Nd isotopic composition of the main intermediate and deep-water masses of the Pacific Ocean and Pacific sector of the Southern Ocean (Fig. 1.16).
Fig. 1.16. Map of the positions of the water stations for which εNd are available for the full water column. Blue rectangles represent data from Piepgras and Wasserburg (1982), Piepgras et al. (1979), Piepgras and Jacobsen (1988). Black rectangles represent data from Lacan and Jeandel (2001). Red dots represent data from Amakawa et al. (2004, 2009, 2013). Green diamonds represent data from Grasse et al. (2012). Red diamonds represent data from Carter et al. (2012), Stichel et al. (2012). White dots represent data from Grenier et al. (2013). White diamonds represent data from Jeandel et al. (2013). Yellow triangles represent data from Haley et al. (2014). Red triangles represent data from Molina-Kescher et al. (2014).
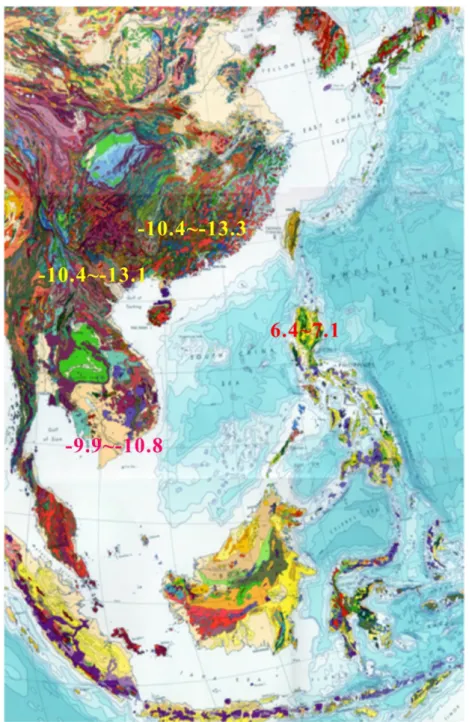
Fig 1.17. Map showing the distribution of sea surface water εNd values from the SCS and the surrounding marginal seas (orange triangle). εNd values of surface sediment and sediments from Asian rivers in the SCS and the surrounding marginal seas have also been included for comparison. Red triangles represent Korean and Yellow river sediments samples; blue diamonds represent core-top samples; yellow rectangles represent loess samples; white rectangles represent rocks samples; pink dots represent Pearl River/Mekong River/Red River sediments samples; blue triangles represent dust samples; blue rectangles represent Philippine river sediments samples. Data are from GEOROC database: http://georoc.mphmainz. gwdg.de/georoc/, Liu et al. (2007), Goldstein et al. (1984), Goldstein and Jacobsen (1988), Amakawa et al. (2000).
The εNd values of the water masses in the Southern Ocean range from -7 to -9. Such values are consistent with the mixing in the Southern Ocean of water masses from all the