Publisher’s version / Version de l'éditeur:
Vous avez des questions? Nous pouvons vous aider. Pour communiquer directement avec un auteur, consultez la première page de la revue dans laquelle son article a été publié afin de trouver ses coordonnées. Si vous n’arrivez pas à les repérer, communiquez avec nous à PublicationsArchive-ArchivesPublications@nrc-cnrc.gc.ca.
Questions? Contact the NRC Publications Archive team at
PublicationsArchive-ArchivesPublications@nrc-cnrc.gc.ca. If you wish to email the authors directly, please see the first page of the publication for their contact information.
https://publications-cnrc.canada.ca/fra/droits
L’accès à ce site Web et l’utilisation de son contenu sont assujettis aux conditions présentées dans le site LISEZ CES CONDITIONS ATTENTIVEMENT AVANT D’UTILISER CE SITE WEB.
Lux Europa 2009, 11th European Lighting Conference [Proceedings], pp.
745-752, 2009-09-09
READ THESE TERMS AND CONDITIONS CAREFULLY BEFORE USING THIS WEBSITE.
https://nrc-publications.canada.ca/eng/copyright
NRC Publications Archive Record / Notice des Archives des publications du CNRC :
https://nrc-publications.canada.ca/eng/view/object/?id=822bdfd4-dc18-42ef-a606-3a33ccb44d74 https://publications-cnrc.canada.ca/fra/voir/objet/?id=822bdfd4-dc18-42ef-a606-3a33ccb44d74
NRC Publications Archive
Archives des publications du CNRC
This publication could be one of several versions: author’s original, accepted manuscript or the publisher’s version. / La version de cette publication peut être l’une des suivantes : la version prépublication de l’auteur, la version acceptée du manuscrit ou la version de l’éditeur.
Access and use of this website and the material on it are subject to the Terms and Conditions set forth at
Energy savings due to occupancy sensors and personal controls: a
pilot field study
http://www.nrc-cnrc.gc.ca/irc
Ene rgy sa vings due t o oc c upa nc y se nsors a nd pe rsona l c ont rols: a
pilot fie ld st udy
N R C C - 5 1 2 6 4
G a l a s i u , A . D . ; N e w s h a m , G . R .
S e p t e m b e r 2 0 0 9
A version of this document is published in / Une version de ce document se trouve dans:
Lux Europa 2009, 11th European Lighting Conference, Istanbul, Turkey,
September 9-11, 2009, pp. 745-752
The material in this document is covered by the provisions of the Copyright Act, by Canadian laws, policies, regulations and international agreements. Such provisions serve to identify the information source and, in specific instances, to prohibit reproduction of materials without written permission. For more information visit http://laws.justice.gc.ca/en/showtdm/cs/C-42
Les renseignements dans ce document sont protégés par la Loi sur le droit d'auteur, par les lois, les politiques et les règlements du Canada et des accords internationaux. Ces dispositions permettent d'identifier la source de l'information et, dans certains cas, d'interdire la copie de documents sans permission écrite. Pour obtenir de plus amples renseignements : http://lois.justice.gc.ca/fr/showtdm/cs/C-42
Energy savings due to occupancy sensors and personal controls:
A pilot field study
Anca D. Galasiu1 and Guy R. Newsham1
Abstract
A study was conducted in cubicle workstations occupied by individuals conducting their regular office duties. The workstations were lit by dimmable direct-indirect luminaires controlled via DALI protocol by occupancy sensors in each luminaire and personal controls located on the occupants’ computer screens. The energy use and power demand attributable to the lighting controls were compared to those of a conventional lighting system previously in place. The occupants’ opinion of the DALI system was also examined. Despite a low frequency-of-use, the personal controls were mentioned by 75% of the occupants as a feature they appreciated having. In contrast, only 30% of the occupants liked the occupancy sensors. Despite the fact that the DALI system had an installed lighting power density 50% higher than the conventional system, with both controls in operation it saved 32% in daily energy use. This shows that lighting power density does not uniquely define energy performance. Time-of-use, which is strongly linked to controls, is critically important.
Keywords: DALI, Lighting Controls, Energy Savings, Electricity Demand Reductions, Open-Plan Offices.
1. Introduction
Prior studies of personal lighting control suggest that it offers office occupants a route to a more comfortable physical work environment while also delivering energy savings. Successful application of personal controls can act as a powerful demonstration for energy efficiency because of this win-win scenario. Research in a laboratory setting demonstrated energy savings of ~15%, while improving occupant environmental satisfaction, mood, and visual comfort [1]. Occupancy sensors, which switch the lights off when the space is not occupied, have also been shown to provide energy savings of ~25% in private offices, and 40% in sporadically occupied spaces such as meeting rooms and washrooms [2]. Photosensors, which use daylighting to offset the use of electric lighting, have also generated energy savings ranging from 20-60% in side-lit spaces, when optimal shade-management was provided [3]. Field research has also showed that lighting systems incorporating personal control, occupancy sensors and daylight-linked dimming have the potential to generate considerable (~70%) energy savings and peak power reductions in open-plan environments [4]. These savings were maintained over the long-term, and the lighting system was positively perceived by the occupants. Such controls, however, have an incremental cost and their market penetration to date has been notably low. Further evidence of long-term energy savings generated by commercially available lighting systems featuring different types of controls and luminaires may spur the market uptake of such technologies.
2. Objectives
This study complements previous field-study work by the same authors [4]. The new study investigated the long-term performance of a different lighting control system protocol, and luminaires which featured occupancy sensors and personal occupant control. The lighting system under consideration was installed in nine cubicle workstations. Data was collected throughout a year to examine energy use (compared to the pre-existing conventional lighting system), as well as the occupants preferred lighting conditions and use of their personal lighting controls.
1 National Research Council Canada, Institute for Research in Construction, Indoor Environment Program,
3. Description of the test-site
The study took place in an open-plan office area with 10 cubicle workstations (total area 85 m2), which was retrofitted with workstation-specific direct-indirect luminaires with personal control and occupancy sensors. The area was primarily lit by electrical lighting. Two north-facing windows (75x230 cm) located remotely from the study area and two clerestory windows (210x50 cm) located at the top of the west-facing wall above the space ceiling line contributed a small amount of daylighting during the day (~200 lux in two workstations located right below and less than 35 lux in the rest of the space).
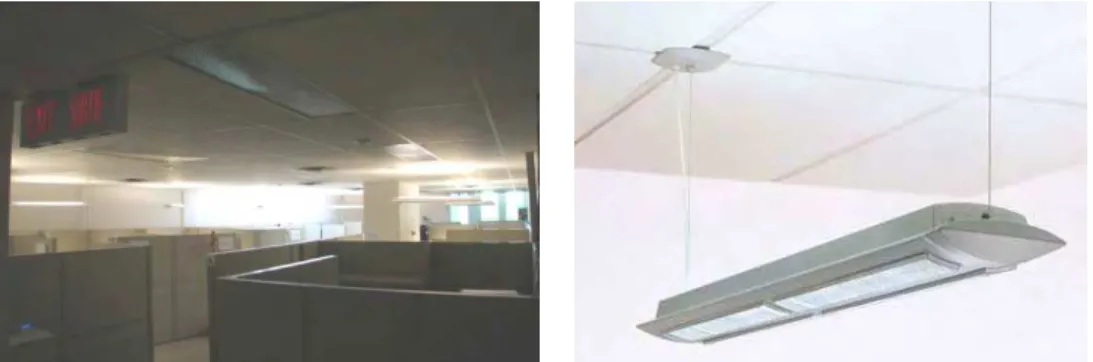
Figure 1. Picture of the study area Figure 2. Picture of the direct-indirect luminaire
Lighting before the retrofit was provided by 10 (60x120 cm) and 5 (30x120 cm) conventional ceiling-recessed fluorescent louvered luminaires (each including 2x32-T8 lamps; 3500 K) and static electronic ballasts, controlled by two manual switches located on the wall at the two entrances into the open-plan space. One of the luminaires was used for emergency lighting, remaining continuously on for 24 hours/day.
For the study, the conventional luminaires (with the exception of the emergency lighting) were removed and nine of the ten workstations were retrofitted with direct-indirect luminaires as shown in Figure 2 (30x120 cm, 3x54W-T5 fluorescent lamps, 3500 K). One workstation was not intended to be occupied throughout the study and was not retrofitted. The new luminaires, suspended at about 50 cm below the ceiling, provided an average illuminance of 1200 lux at desktop height at full output. After the retrofit, the lighting power density installed in the area increased from ~10.5 W/m2 to ~17 W/m2.
Each 3-lamp luminaire was connected via DALI protocol [5] to a central control computer and to each occupant’s desktop computer. The lamp in the center of the luminaire directed the light mainly upward, toward the ceiling, providing constant general lighting around the open-plan space. These lamps were controlled centrally during the study based on a daily schedule that kept them continuously on at only 30% of full lamp output from 7:30 AM to 7:00 PM on workdays. This setting effectively reduced the installed lighting power density of the studied system from ~17 W/m2 to ~15W/m2, and the average illuminance at desktop height dropped to ~1000 lux at full downlight output. Although some might consider this installed power density and maximum illuminance excessive, it did provide the occupants with a wide range of possible light levels, providing for a full variety of occupant preferences [1,6]. Outside of the scheduled hours, the uplights were turned on by integrated occupancy sensors when sensing presence in the workstation.
The two lamps at the sides of the luminaire directed the light mainly downward and could be controlled via two controls:
• an integrated occupancy sensor (OS), which switched the downlights off when the occupant had been absent from the workstation for 15 minutes, and switched the lights back on at the previously selected level when the occupant returned.
• an individual (personal) control (IC), consisting of an on-screen graphical interface located on the occupant’s computer that allowed on/off switching or dimming of the downlights to a preferred level from 0 to 100% light output. The control panel also featured 4 default preset lighting scenes that the occupant could also use to set the downlights at 100%, 80%, 50% and 10% of full lamp output.
The workstations were used as regular offices by students, visiting workers and other temporary staff conducting their normally-assigned tasks. All occupants had access to the personal control from the beginning of their tenure. No more than one person occupied a workstation at any one time, but individual work terms in many cases were shorter than the study period, so that a workstation’s occupant changed as the study proceeded. In total, the nine workstations were occupied by 19 individuals. The allocation of the occupants to a particular workstation followed a random process based on which workstation was available when a new employee arrived. After their arrival, the occupants were given a tutorial on the lighting control system and its use.
4. Method
Data related to each luminaire was collected continuously from June 9, 2006 to July 31, 2007, using the central controller software of the standard installation of the lighting system. The software automatically tracked the energy use of each workstation every 5 minutes, recording the preferred settings and the occupancy patterns of the occupants. The software reported the energy use of each light fixture with all available controls in operation simultaneously. However, we also derived the separate saving contribution of each of the controls if only one control had been in operation, using observed relationships between the dimming level, electric power demand, and the occupancy sensor and individual (personal) control setpoints.
To calculate the savings associated with the controls, we considered the following two basic cases that assumed full lighting energy use during the daily work-schedule of the lighting system (7:30 AM to 7:00 PM):
• energy use (Efull) and power demand (Pfull) of the DALI lighting system in the absence of controls;
• energy use (Econv) and power demand (Pconv) of the conventional lighting system previously in place. A logger system installed before the retrofit recorded the use (on/off status) of the previous lighting system over 150 workdays, from October 27, 2005 to June 7, 2006. These data combined with luminaire power measurements was used to calculate the energy use of the conventional lighting system during regular workdays. This provided an adequate baseline for comparing the performance of the new lighting system used in the same space over several seasons.
For each luminaire, we calculated the percentage in energy savings and the power demand reductions with the DALI downlights controlled by:
• occupancy sensors only (Eos); In this case it was considered that no individual (personal) controls were available, therefore, the downlights would have been used continuously at full power when the occupants were present in their workstations and the delay time following departure (actual occupancy), being turned off during the rest of the time.
• individual (personal) controls only (Eic); In this case it was considered that no occupancy sensors were available, therefore, the downlights would have been used continuously at the occupant-selected level during the daily work-schedule of the lighting system; Additional calculations estimated the energy use assuming that the occupants would have manually switched the lights on and off every day at arrival and departure time (Eic.2).
• occupancy sensors and individual (personal) controls combined (Eos+ic); This is the monitored case, with the downlights operating at the dimming level set by the occupants during the workstation actual occupancy and being turned off the rest of the time. This is the energy use reported by the lighting system monitoring software.
Note that all the above calculations included the energy used by the uplights, which were continuously on at 30% of full power during scheduled hours. Therefore, whenever we present comparisons to the lighting system used at full power we in fact mean a luminaire with 2x54W downlights at full output and 1x54W uplight at 30% output.
Formal consent to analyze the lighting system data was sought from the occupants, who were asked through an e-mail invitation to either accept or reject their participation in the study. Two occupants declined participation, therefore, only data collected from 17 participants is presented. At the same
occasion, the occupants were also asked to complete a short questionnaire regarding their opinion of the lighting control system. The questionnaire included the following 3 open-text questions:
1. What do like most about the lighting control system in your workstation? 2. What do like least about the lighting control system in your workstation?
3. If you could change one thing about the lighting control system, what would it be?
5. Results
5.1 Energy performance of the automatic lighting system
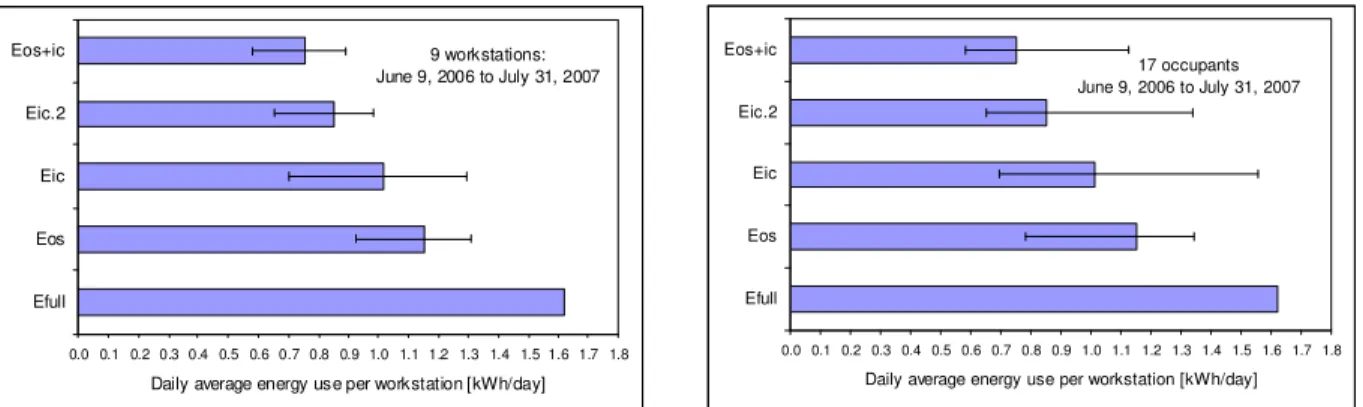
The daily average energy use of the lighting system for the various control scenarios was compared with the energy use of the same lighting system without controls and used at full power during the daily work schedule. As shown in Figure 3, when used together, the two controls saved on average 54% in energy use per workstation per day (Eos+ic versus Efull)). The individual (personal) control generated the largest savings, with 37% if used on its own (Eic versus Efull)). Estimated additional savings of 10% would have been possible without occupancy sensors if the occupants had consistently turned on and off the light in their workstations at arrival and departure time (Eic.2 versus Eic). If used on their own, the average daily energy savings per workstation due to the occupancy sensors were about 29% (Eos versus Efull). The “error bars” shown in Figure 3 indicate the range of daily average energy use calculated across the 9 workstations (average of 214 workdays/workstation) and the 17 occupants (average of 120 workdays/occupant). Depending on the workstation, with both controls in operation, the average daily energy savings ranged between 45-64%. The average energy used by each of the 17 occupants ranged between 0.57-1.12 kWh/day. 0.0 0.1 0.2 0.3 0.4 0.5 0.6 0.7 0.8 0.9 1.0 1.1 1.2 1.3 1.4 1.5 1.6 1.7 1.8 Efull Eos Eic Eic.2 Eos+ic
Daily average energy use per workstation [kWh/day] 9 workstations: June 9, 2006 to July 31, 2007 0.0 0.1 0.2 0.3 0.4 0.5 0.6 0.7 0.8 0.9 1.0 1.1 1.2 1.3 1.4 1.5 1.6 1.7 1.8 Efull Eos Eic Eic.2 Eos+ic
Daily average energy use per workstation [kWh/day] 17 occupants June 9, 2006 to July 31, 2007
Figure 3. Luminaire daily average energy use for various control scenarios compared with the same luminaires used at full power during scheduled hours. In each graph, the “error bars” show the range of average daily use calculated across the 9 workstations (left) and the 17 occupants (right).
In a previous lighting installation studied by the authors [4], the average energy used per workstation (N=86) over a period of 39 days when the lighting system was controlled only by occupancy sensors and personal control ranged between 0.36-0.82 kWh/day. In the previous study, the occupancy sensors would have accounted for 29-38% of the energy savings if used as the only control option, and the individual (personal) controls would have saved only 10-20% if used on their own. We suspect the difference between our studies to be directly linked to the amount of light generated at full power by the luminaires used in each system. The average illuminance measured in the previous study at desktop height with the lamps at full power was about 400 lux, whereas in the present study the average illuminance was about 1000 lux. This is much higher than recommended practice levels [7], and the illuminance levels observed to be preferred by occupants of similar offices [1,6]. Further discussion on the occupants preferred lighting levels is provided below.
5.2 Comparison with the conventional static lighting system
The daily average energy use of the DALI lighting system for various control scenarios was compared with the daily average energy used in the same space by the previous conventional lighting system. The results presented in Figure 4 compare the energy use of the 9 luminaires of the new lighting installation versus the 14 luminaires used in the previous installation. The emergency lighting was excluded from this
analysis since this luminaire was continuously on for 24 hours/day during both periods. The daily average time-of-use of the conventional lighting system was ~11.9 hours/day, which compares well with the ~11.5 hours/day used by the DALI daily schedule.
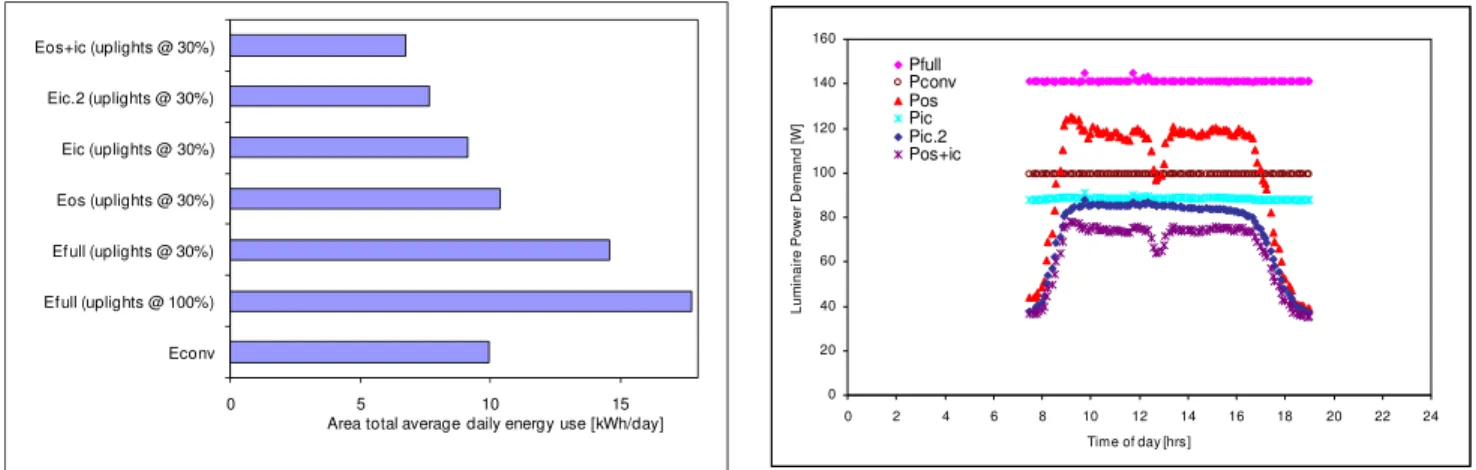
As shown in Figure 4 (left graph), due to the much higher lighting power density of the DALI system, the daily energy use with all three lamps at full power is ~80% higher than that of the conventional system. The restriction applied on the uplight to operate at only 30% of full power still maintained the difference between the two systems at 47%. Nevertheless, even with this apparent drawback, with both controls in operation, the DALI system saved 32% in daily energy use compared to the lighting system previously in place (Eos+ic versus Econv). However, controlled by occupancy sensors only (Eos), the DALI system would have used 4% more energy than the conventional system, while controlled based on the individual (personal) controls only (Eic), the DALI system would have saved only 8%. Compared to the energy use of the conventional system, these savings would have increased by an additional 15% without occupancy sensors if all the occupants would have consistently switched on and off the lights daily at arrival and departure from work (Eic.2 versus Econv).
0 5 10 15 Econv Ef ull (uplights @ 100%) Ef ull (uplights @ 30%) Eos (uplights @ 30%) Eic (uplights @ 30%) Eic.2 (uplights @ 30%) Eos+ic (uplights @ 30%)
Area total average daily energy use [kWh/day]
0 20 40 60 80 100 120 140 160 0 2 4 6 8 10 12 14 16 18 20 22 24 Time of day [hrs] L u m inair e P o wer De m and [ W ] Pfull Pconv Pos Pic Pic.2 Pos+ic
Figure 4. Area daily average energy use of the automatic lighting system (left) and luminaire daily average power demand per workstation (right) for various control scenarios compared with a conventional lighting system of the type previously in place used at full power during scheduled hours.
Data also showed that the DALI lighting system resulted in significant reductions in the daily power demand for lighting. Figure 4 (right graph) shows the average power demand profile during the daily work-schedule. When used together, the two controls reduced the average peak power demand per workstation to about 78 W, a reduction of 54% compared to the same fixtures used at full power (140 W/workstation), and by 34% compared to the conventional lighting system previously in the space. Around 1 PM, the average power demand dropped to ~64 W/workstation due to occupancy sensor savings during lunch time absences.
Compared to the same luminaires used at full power, the power demand would have been reduced on average by 29% during scheduled hours if the lighting system had been controlled based on occupancy only (Pos), and by 37% if the system had been controlled based on the individual (personal) control only (Pic). An additional 10% reduction in the average daily power demand during scheduled hours would have been achieved, without occupancy sensors, if the occupants would have consistently turned the lights on/off when coming to work in the morning and leaving for the day in the afternoon (Pic.2). Due to the operation of the controls, the effective average lighting power density was ~7 W/m2, because not all lights are on simultaneously, nor are they on at full power. This is about half the installed lighting power density of the lighting system (~15 W/m2).
5.3 Occupant preferred lighting levels
The occupants’ preferred average illuminance was calculated as an average of three illuminance measurements taken at night on each individual’s desktop, one in front of the computer monitor and two on each side at 80 cm distance from the monitor. As reported consistently in the literature [1,6,8,9], this
study also shows a large variation between the light levels selected by the participants. Among 17 occupants, the median selected illuminance was 600 lux, with 7 individuals choosing a level lower than the recommended practice lighting levels for offices (500 lux), and 10 individuals choosing levels higher than recommended practice.
As mentioned before, there were two clerestory windows in the space. Even though their net daylight contribution was expected to be relatively small, we investigated the possibility that the four participants who worked the closest to these windows would use their manual controls to lower the electric lighting levels in response to daylight. The energy use data, however, suggests that these individuals had on average about the same daily energy use or, in some cases even higher, than the other occupants who worked in workstations that were further away from the clerestory windows. Furthermore, it was in one of the workstations located right below these windows where the highest average daily use of lighting energy was recorded. Overall, the data does not suggest that individuals used their individual (personal) controls in direct response to daylighting.
5.4 Individual (personal) control frequency-of-use
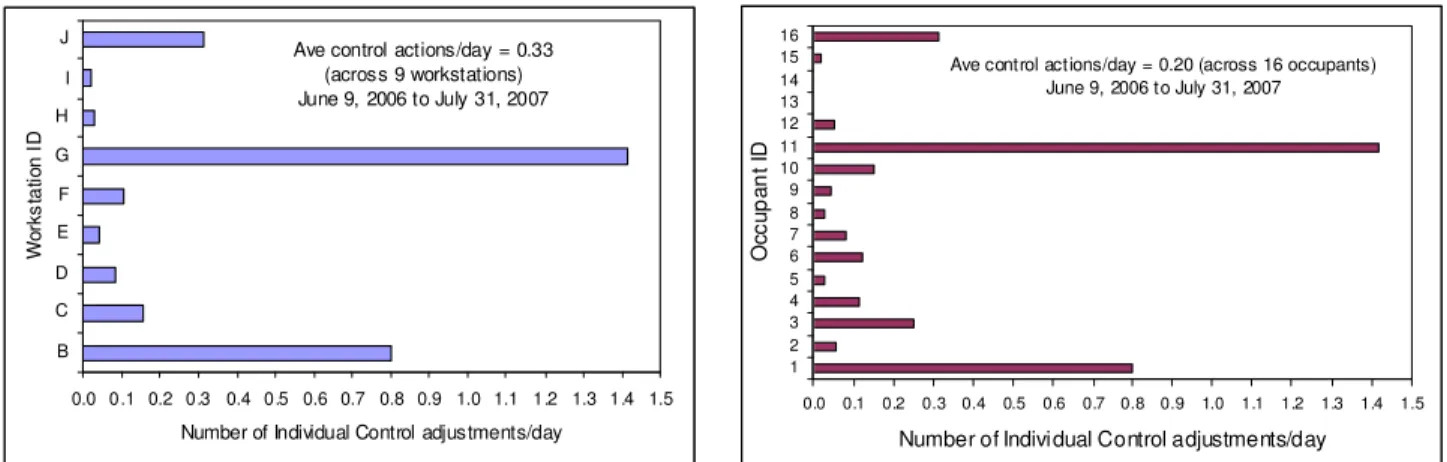
Figure 5 presents the average number of personal control adjustments occurring per day in each workstation (left) and for each occupant (right). Aside from one single active occupant with the shortest tenure in the space (36 workdays), who occupied the workstation labelled G (left graph) and adjusted the downlights at least once a day, the occupants used their personal controls rarely. Calculated across all 9 workstations, the average manual control adjustments per workstation per day was 0.33. However, this average value is biased by one or two more active occupants and the median was only 0.07 user-requested adjustments/day. This is slightly higher than that found in the previous study [4], which amounted to 0.05 average manual control adjustments/workstation/day (calculated across 86 workstations). This difference is likely due to the frequency with which a new occupant took tenure of a particular workstation.
Figure 5. Daily average user-requested downlight adjustments per workstation (left) and per occupant (right). Data is shown for 16 individuals only because in one of the workstations two occupants shared the workspace on alternating days during the same period of time.
Ave control actions/day = 0.20 (across 16 occupants) June 9, 2006 to July 31, 2007 0.0 0.1 0.2 0.3 0.4 0.5 0.6 0.7 0.8 0.9 1.0 1.1 1.2 1.3 1.4 1.5 1 2 3 4 5 6 7 8 9 10 11 12 13 14 15 16 O cc u pa nt I D
Number of Individual Control adjustments/day 0.0 0.1 0.2 0.3 0.4 0.5 0.6 0.7 0.8 0.9 1.0 1.1 1.2 1.3 1.4 1.5 B C D E F G H I J Wo rk s ta ti o n I D
Number of Individual Control adjustments/day Ave control actions/day = 0.33
(across 9 workstations) June 9, 2006 to July 31, 2007
This study also confirms that most occupants worked under a single chosen electric light level for long periods of time. In addition, data also confirmed that in a system which includes occupancy sensors, the majority of the occupants will rely on this control system to turn off the lights for them when leaving the space for an extended period of time, regardless of how long after their departure this is programmed to happen. This behaviour is estimated to have increased the daily energy use of the lighting system controlled by personal controls only (without occupancy sensors) by 10%, compared to the energy used by the same lighting system used at full power (Figure 3, Eic.2 versus Eic).
5.5 Occupancy sensor frequency-of-activation
Based on the field-collected data we also calculated the average number of times that the occupancy sensors were activated daily compared with similar data obtained in our previous study [4]. In the present study, the occupancy sensors turned off the downlights on average 6 times/workstation/day (ranging from 3.5 off activations/day to 10.5 off activations/day). An equivalent number of daily light-on activations occurred. This value is higher than that found in the previous study, where for 86 workstations there was an average of ~3.5 off activations/workstation/day. Presumably, this difference is due to the type of work and occupancy profiles at the two sites.
The overall on-time per day and switching frequency in this study imply an average on/off switching cycle time shorter than the 3 hours used for standard lamp life tests [10]. This suggests that lamp life might be shortened by the application of occupancy sensors. On the other hand, occupancy sensors ensure that the lamps are on for less time per day, which may increase the time between lamp replacement, compared to the case with no sensors.
5.6 Lighting study questionnaire
Seventeen participants completed the lighting study questionnaire. Most of them (N=13) mentioned the flexibility and the ability to adjust the light levels, or the automatic on/off switching of the lights based on the actual occupancy (N=5), among the features of the lighting system they liked. One individual even appreciated the speed and the accuracy of the motion detector when entering the workstation, while a few others (N=6) criticized the sensitivity of the occupancy sensor and its inability to either detect their presence when performing tasks that did not require frequent movement, or to prevent false trigger-on by passers-by. One person appreciated that the personal control was accessible through a web browser, whereas others (N=6) considered this to be an inconvenience and would have preferred to have a dedicated icon on their desktops. Three people commented on the unfriendliness of the personal control interface and having to repeat the commands or wait too long for the system to respond. The preset scenarios were not to the liking of some individuals (N=4), who commented that it was not obvious enough how to change their default setting. One person would have liked access to a tasklight and disliked the position of the luminaire.
Most suggestions for improvement of the lighting system were related to adjusting the sensitivity of the occupancy sensors, and creating a dedicated icon and a friendlier individual (personal) control interface. Two occupants suggested adding reminders about adjusting the light levels, or resetting the lights periodically so that individuals would be faced with readjusting the light levels on a regular basis, perhaps even daily. However, we speculate that this latter suggestion is somewhat biased since these participants had actually been involved in lighting-related research projects and were likely more indulgent than the average user towards methods that would lead to increased energy savings.
6. Conclusion
Due to the small sample size of occupants (N=17) and workstations (N=9), the results from this pilot-study should be considered as indicative and qualitative in nature only. In addition, the fact that some of the occupants may have known more than a novice user about the research topic addressed in this study may be a possible source of bias. Nevertheless, the relatively long exposure time for most participants engaged in their regular office tasks (average of 4 months/person), combined with the 5-minute data resolution collected over an entire year for each luminaire in the system makes for a rich dataset. Because there is very little data published to date on the long-term use of automatic lighting systems including personal control and occupancy sensors, we believe that even a limited study such as this one can constitute a valuable step towards improved recommended practices.
The results of this study confirmed that automatic lighting systems including occupancy sensors and individual (personal) controls are suitable for open-plan office environments and can save a significant amount of energy (over 30%) when compared to a conventional lighting system, even when the installed lighting power density of the automatic lighting system is ~50% higher than that of the conventional system. This demonstrates that for lighting energy conservation and peak demand savings, the most important issue is not the installed lighting power density, but the lighting use. Furthermore, despite the
fact that most occupants do not use their personal controls often, they do use them to select a preferred light level, which more often than not saves energy and improves the occupants’ comfort and their appraisal of the office environment.
Acknowledgements
The research was carried out at the National Research Council of Canada Institute for Research in Construction (NRC-IRC) with funding from the Program on Energy Research and Development (PERD) and BC Hydro Power Smart. Special thanks also go to Cristian Suvagau and Roy Hughes of BC Hydro, and Martyn Timmings of Canlyte.
References
1. Newsham, G. R., Veitch, J. A., Arsenault, C., Duval, C. (2004) Effect of dimming control on office worker satisfaction and performance. Proceedings of the IESNA Annual Conference, Tampa, FL, USA, pp. 19-41, Available at: http://irc.nrc-cnrc.gc.ca/fulltext/nrcc47069/
2. Figueiro, M.G. (2004) Occupancy Sensors: Are there reliable estimates of the energy savings?, LD+A Lighting
Design + Application, January 2004.
3. Lee, E.S., Selkowitz, S.E. (2006) The New York Times Headquarters daylighting mock-up: Monitored performance of the daylighting control system, Energy and Buildings, 38(7): 914-929.
4. Galasiu, A.D., Newsham G.R., Suvagau, C., Sander, D.M. (2007) Energy saving lighting control systems for open-plan offices: A field study, Leukos, 4(1): 7-29.
5. DALI AG (2001) Digital Addressable Lighting Interface Activity Group of ZVEI, Division Luminaires, Frankfurt am Main, Germany, Available at: http://www.dali-ag.org/
6. Veitch, J.A.; Newsham, G.R. (2000) Preferred luminous conditions in open-plan offices: Research and practice recommendations, Lighting Research and Technology, 32: 199-212.
7. IESNA/ANSI American National Standard for Office Lighting RP-1-2004.
8. Boyce, P.R., Eklund, N.H., Simpson, S.N. (2000) Individual lighting control task performance, mood and illuminance, Journal of the IESNA, 29(1):131-142.
9. Halonen, L., Lehtovaara, J. (1995) Need of individual control to improve daylight utilization and user’s satisfaction in integrated lighting systems, Proceedings of the CIE 23rd Session, New Delhi, India, pp. 200-203.
10. IESNA (2000), Lighting Handbook 9th Edition, New York, NY, USA: Illuminating Engineering Society of North America, pp. 10-13.