HAL Id: hal-01790542
https://hal.archives-ouvertes.fr/hal-01790542
Submitted on 18 Jun 2018HAL is a multi-disciplinary open access archive for the deposit and dissemination of sci-entific research documents, whether they are pub-lished or not. The documents may come from teaching and research institutions in France or abroad, or from public or private research centers.
L’archive ouverte pluridisciplinaire HAL, est destinée au dépôt et à la diffusion de documents scientifiques de niveau recherche, publiés ou non, émanant des établissements d’enseignement et de recherche français ou étrangers, des laboratoires publics ou privés.
CIGESMED’s protocol and network (Coralligenous
basEd. Indicators to evaluate and monitor the “Good
Environmental Status” of Mediterranean coastal waters)
Romain David, Sophie Dubois, Zinovia Erga, Dorian Guillemain, Laure
Thierry de Ville d’Avray, Christos Arvanitidis, Melih Ertan Çinar, Stéphane
Sartoretto, Frederic Zuberer, Anne Chenuil, et al.
To cite this version:
Romain David, Sophie Dubois, Zinovia Erga, Dorian Guillemain, Laure Thierry de Ville d’Avray, et al.. CIGESMED’s protocol and network (Coralligenous basEd. Indicators to evaluate and monitor the “Good Environmental Status” of Mediterranean coastal waters). 5th International Symposium Monitoring of Mediterranean coastal areas: problems and measurement techniques, CNR-IBIMET Firenze, Jun 2014, Livorno, Italy. pp.828-843. �hal-01790542�
CIGESMED’S PROTOCOL AND NETWORK
(CORALLIGENOUS BASED INDICATORS TO EVALUATE AND
MONITOR THE “GOOD ENVIRONMENTAL STATUS” OF
MEDITERRANEAN COASTAL WATERS)
Romain David1, Sophie Dubois1, Zinovia Erga1,5, Dorian Guillemain1, Laure Thierry de Ville d’Avray1, Christos Arvanitidis 2, Melih Çinar3, Stéphane Sartoretto4, Frédéric Zuberer1,*,
Anne Chenuil1, Jean-Pierre Féral1 with other contributors**
1
Partner CNRS- IMBE: Mediterranean Institute of Biodiversity and marine and terrestrial Ecology, Station Marine d’Endoume, Marseille (CNRS, AMU, IRD, Avignon University), MIO: Mediterranean Institut of Oceanography, Marseille (CNRS, AMU, IRD, Toulon University) and SPE: Systèmes Pour
l’Environnement, écosystemes côtiers. University of Corsica, Corte. (*) Institut Pythéas
2
Partner HCMR- Hellenic Centre for Marine Research - Institute of Marine Biology, Biotechnology and Aquaculture, Institute of Oceanography and Institute of Marine biological Resources, Thalassocosmos.
3
PartnerEGE- EGE University - Faculty of Fisheries - Dokuz Eylul University [Institute of Marine Sciences and Technology & Faculty of Science] - Cela Bayar University - Department of Biology and
Ministry of Forestry and Water Affairs [General Directorate of Water Management], Izmir / Ankara.
4
Partner IFREMER- (French Research Institute for Exploitation of the Sea), La Seyne sur Mer.
5
National Marine Park of Zakinthos, Greece
Corresponding author: romain.david@imbe.fr
** Contributors in CIGESMED : Açik Çinar S., Andral B., Aurelle D., Aysel V., Bakir K., Bellan G., Bellan-Santini D., Bouchoucha M., Bricout R., Celik C., Chatzigeorgiou G., Chatzinikolaou E., Chenesseau S., Dağli E., Dailianis T., Dimitriadis C., Doğan A., Dounas C., Egea E., Emery E., Evcen A., Faulwetter S., Gatti G., Gerovasileiou V., Güçver S.M., Issaris Y., Katağan T., Keklikoglou K., Kirkim F., Koçak F., Koutsoubas D., Marschal C., Önen M., Önen S., Öztürk B., Panayiotidis P., Pavloudi C., Pergent G., Pergent-Martini C., Poursanidis D., Ravel C., Reizopoulou S., Rocher C., Ruiton S., Salomidi M., Sarropoulou E., Selva M., Sini M., Sourbes L., Simboura N., Taşkin E., Vacelet J., Valavanis V., Vasileiadou A., Verlaque M.
Abstract – Coralligenous habitats are part of the most important Mediterranean marine ecosystems in terms of complexity and biodiversity. They provide protection, feeding and reproduction areas for more than 1600 species. This biodiversity is essential for economic activities such as fishing and scuba diving. The European program CIGESMED (ERA-NET funding), involving France, Greece and Turkey, investigates the “Good Environmental Status” of these habitats in the framework of the MFSD (Marine Strategy Framework Directive). One major objective of CIGESMED is to propose an operational, long-term, large-scale protocol to monitor coralligenous habitats in the Mediterranean Sea. This protocol is currently tested in French sites: the effects of (sampling) methods, materials and operators are studied in order to evaluate the influence of protocol implementation, and to find the easiest and most reliable procedure that could be implemented by and for a large public, also consisting of non-scientists, and would provide workable data for long-term monitoring. This protocol is based on photo-quadrats observations. The analyses are done on occurrences, relative
abundances, species associations and species’ favourite environmental profile. In parallel, complementary protocols are implemented: one concerns the cartography of coralligenous habitats, and two are about population genetics of significant habitat-forming species
Myriapora truncata (Pallas, 1766) and Lithophyllum cabiochiae ((Areschoug) Hauck,
1877)). All the data and results are organized as a non-centralized information system, with configurable plugins that can be installed free by all new partners.
Introduction
The term “the coralligenous”, meaning coral producer, was first used by Marion in 1883 [11] to describe the hard bottoms called broundo by the fishermen from Marseilles [1]. Indeed, Marion thought that the red coral (Corallium rubrum) was indivisible from these hard biogenic bottoms. Presently the word “coralligenous” sets off debate, because it is now known that the presence of red coral on this type of bottom is neither inevitable, nor exclusive. Yet, coralligenous habitats with high density of Corallium rubrum are just one of the possible type of these habitats [16]. In 2006, Ballesteros [1] recommends to use the terms “coralligenous habitats” since there are many type of coralligenous habitats, and not only one.
In the current European context, coralligenous habitats are considered habitats of “community interest” (Habitats Directive 92/43/CEE, habitat code: 1170-14) and should be shortly promoted as “priority” habitat. It is currently considered as the 2nd “hotspot” of biodiversity in the Mediterranean Sea (Posidonia meadow being the first one), and more than 1600 species constitute and live in these habitats (Ballesteros, 2006) [1]. They are also considered as high-value ecological zone since the Barcelona Convention. In 2008, this convention proposed a management plan for the coralligenous habitats, but there is currently no regulatory instrument for their protection. However, the EU Marine Strategy Framework Directive (DCSMM) requires that each state develop a strategy and an action plan in order to reach and maintain a “Good Environmental Status” [GES] for its marine habitats. This GES, as defined by the DCSMM, is assessed by 11 descriptors about the state and the pressures measured for each milieu. The first symposium on coralligenous habitats took place in 2009 [17], further to the Action Plan for the Conservation of Marine Vegetation started (adopted in 1999 by the stakeholders of the Barcelona Convention).
Since the publication from Marion in 1883, many studies on coralligenous habitats have been published and are now references including Laubier (1966) [9], Hong (1980) [7], Ballesteros (2006) [1]. Coralligenous habitats are assemblages of complex habitats with very low dynamic of construction that is not very documented. These habitats are not only “hotspots” of biodiversity, but furthermore they represent socio-economic stakes. Activities such as small-scale fishing and scuba diving highly depend on them. Fishermen look for species of high commercial value such as red coral, crustaceans, rock fishes, and other seafood. Divers look for the landscapes beauty, offered by coloured and erect species such as gorgonians, corals and bryozoans. Beyond these interests, other services provided by coralligenous habitats are suspected such as CO2 sequestration [12] [13] or marine bottoms
stabilization [14]. They are threatened by global change, and anthropogenic pressures. Only the GES can guarantee the maintaining of all these services provided by coralligenous habitats.
There are pretty few programs and networks for the monitoring of coralligenous habitats. CIGESMED (Coralligenous Indicators based to Evaluate and Monitor the “Good
Environmental Status” of the Mediterranean coastal waters) is one of them. It implies three countries (France, Greece and Turkey) from 2013 to 2016. CIGESMED objectives are (1) to fulfil the key gaps in the current scientific, knowledge of the coralligenous habitats that make it difficult to make recommendations for protecting them by developing barcoding to enhance reliable identification for conservation and protection purposes (invasive and cryptic species), and by studying genetic structuring and effective dispersal potential of keystone/habitat species, (2) to enhance the knowledge on coralligenous populations by deciding on reference states and setting up a network of Mediterranean experts (long term series), (3) to monitor networks, locally managed and coordinate them on a regional scale, standardizing protocols that could be applied to the entire Mediterranean and testing indices and indicators, specific to coralligenous, (4) to test population genetic criteria as tools to monitor the GES of the coastal Mediterranean Sea, (5) to implement a “citizen science” network and (6) to use trees of knowledge as tools to sort, organize and illustrate the large heterogeneous sets of produced data and as a tool of dissemination towards scientists, decision makers, environmental managers and general public.
This includes habitats cartography, population genetics studies to understand species relations and dispersal potential, and the setting up of a monitoring protocol.
A phase of inter-calibration of methods/material/operators is firstly implemented. This is done in order to evaluate the variability related to these experimental parameters. It enables to know in which situations results obtained by different underwater protocols are comparable. Moreover, this phase of test helps to select the best protocol to apply (the easiest, and most reliable) depending on the habitats types. The next phase will be the study of natural variability inter-site or intra-sites
.
Materials and Methods
Observations and cartography of coralligenous habitats
Intercalibration methods
The studied sites are located in Marseilles Bay. They are transects of 10 meters long at 28 meters depth. The chosen coralligenous habitats are walls dominated by the red gorgonian Paramuricea clavata, with different grades of roughness, from anfractuosities to hollows or caves, and great species richness.
To date, three variables have been studied: the sampling method, the quality of the camera, and the level of knowledge of operators in charge to identify species. The protocol was implemented as follow. Divers made photo-quadrats using a frame of 50 cm by 50 cm. The pictures were analysed by operators using the software Photoquad® [16]. Hundred points were distributed by stratified randomization. Then the operator assigned each point to one category and one sub-category among these three: (i) higher taxa (such as phyla, orders), (ii) abiotic, (iii) indeterminate. In the first category (i) the sub-categories are lower taxa (such as genius or species). The second category (ii) is subdivided into four sub-categories: sediment, bare rock, organic detritus or debris. In the third one (iii), there are three sub-categories: fuzzy image, shadow/hole, and unidentified taxon.
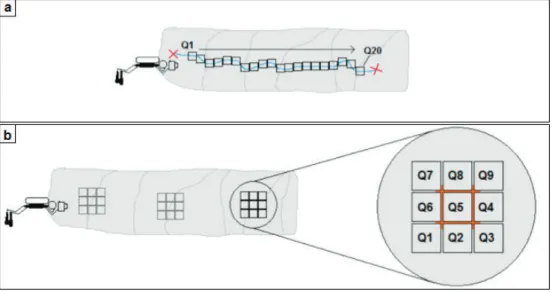
The first variable studied was the sampling method. Two sampling methods were compared: (i) permanent linear transect and (ii) random patches transect. The implementation of method (i) consisted for the diver to start from a permanent point, and
make 20 photo-quadrats, in a continuous way, on the 10 meters long transect, following a virtual horizontal line at constant depth. The implementation of method (ii) consisted to make patches of 9 photo-quadrats randomly, at constant depth. To make a patch, the diver places a frame marking the centre of the patch. Then he makes the photo-quadrats around the frame starting by the left bottom corner, and finishing by the right upper corner. It should draw a patch of 3 by 3 photo-quadrats, as illustrated figure 1
.
The second variable studied was the quality/performance of the camera. Two cameras have been compared: (i) a camera of medium quality and (ii) a camera of high quality. The models used are (i) GoPro®, and (ii) Nikon® D300s. The third variable studied was the level of knowledge of the operators in charge to identify the taxa on photo-quadrats. Two levels of operators were compared: (i) novice and (ii) experienced. The set of operators participating were: one novice and two experienced operators. Each of them analysed separately the first 5 photo-quadrats of the transect (series 1). Then they met to exchange their results (species identification) about this first set and re-do the identification work together to produce “validated data”. Again they studied separately the 2nd series of 5 photo-quadrats. Then they met again to exchange their knowledge and produce “validated” data on this 2nd series. They proceeded like that 4 times to analyse the 20 photo-quadrats of the permanent transect.
Figure 1 – The two types of transects tested. Linear transect (a): 20 photo-quadrats are taken at a given isobath, located by permanent marks. Random patch transect (b): 3 groups of 9 photo-quadrats are taken, following the indicated numbers scheme from 1 to 9, several times at a same depth.
Profile characterization and associate symbology
Due to their topography and to their complexity, there are few accurate maps of coralligenous habitats. CIGESMED program is experiencing a way to symbolise them by means of easily recognizable signs. Based on the estimation of the diversity and abundance of species observed during field surveys, coralligenous habitats cartography should also
take into account the profile parameters (orientation, slope, roughness, and major covers) that favour one or the other taxon. This study of the variability of the coralligenous habitats structure is made on small islands of Marseilles’ bay at a constant depth of 28 (± 1) meters. Observations were done on different types of sites. Either around small islands and shoals, or along coastline with all orientations represented. For each site, two depths were sampled around 28 m deep (± 1 m), and around 45 m deep (± 1 m). Samples were collected along transects cut into segments of 5 m long and 1 m wide.
To define the profile of each segment, the following typology has been applied: - Orientation of the wall: North, South, East, West and the four intermediates (Northeast, Northwest, Southeast, Southwest).
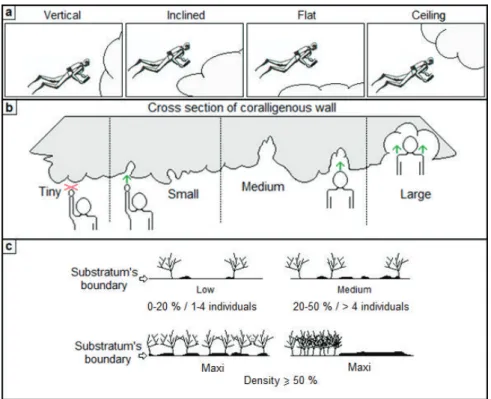
- Slope of the wall: the four categories are V, I, F, C = Vertical, Inclined, Flat, Ceiling (2a). - Roughness of the wall: the size of holes observed on the entire segment was described as: « T » (Tiny) segments with holes are less than 10 cm. « S » (Small) segments with holes that measure between 10 and 30 cm. « M » (Medium): segments with holes between 30 cm and 1 m. « L » (Large): segments whose holes must be at least 1 m large. This typology can be apply easily by the under-water diver with anatomic references as shown in Figure 2b (finger(s), fist, head, and shoulders).
- Main coralligenous species covers: the 3 or 5 majoritarian taxa were recorded with indication of relative abundance of encrusting or erect species according to the code (Figure 2c).
Figure 2 – Environmental variables taken in account are orientation, (a) slope, (b) roughness and (c) main coralligenous populations.
For this study, the cover "Low" and the lowest occurrences of species have not been taken into account in the data analysis. For data processing, the frequency of species observation for each segment was calculated for each profile setting.
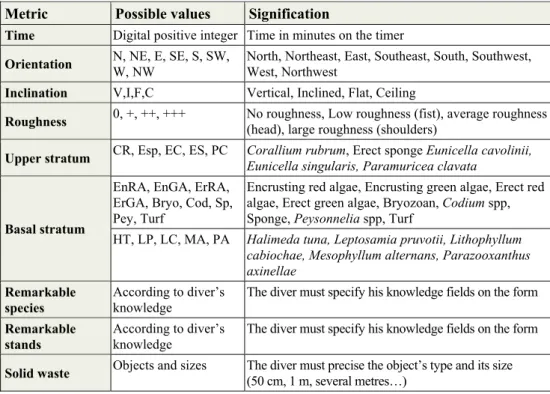
Table 1 – List of the metrics and of their acronyms. Metric Possible values Signification
Time Digital positive integer Time in minutes on the timer
Orientation N, NE, E, SE, S, SW,
W, NW
North, Northeast, East, Southeast, South, Southwest, West, Northwest
Inclination V,I,F,C Vertical, Inclined, Flat, Ceiling
Roughness 0, +, ++, +++ No roughness, Low roughness (fist), average roughness
(head), large roughness (shoulders)
Upper stratum CR, Esp, EC, ES, PC Corallium rubrum, Erect sponge Eunicella cavolinii,
Eunicella singularis, Paramuricea clavata
Basal stratum
EnRA, EnGA, ErRA, ErGA, Bryo, Cod, Sp, Pey, Turf
Encrusting red algae, Encrusting green algae, Erect red algae, Erect green algae, Bryozoan, Codium spp, Sponge, Peysonnelia spp, Turf
HT, LP, LC, MA, PA Halimeda tuna, Leptosamia pruvotii, Lithophyllum cabiochae, Mesophyllum alternans, Parazooxanthus axinellae
Remarkable species
According to diver’s knowledge
The diver must specify his knowledge fields on the form
Remarkable stands
According to diver’s knowledge
The diver must specify his knowledge fields on the form
Solid waste Objects and sizes The diver must precise the object’s type and its size
(50 cm, 1 m, several metres…)
Population genetics studies
This aspect is just starting. The aim is to understand the population structure of the coralligenous species by studying the intraspecific diversity of demes and their connectivity. The studied species are living throughout the Mediterranean Sea, giving opportunity of detecting cryptic species. For this reason, we will use the barcoding method consisting in sequencing a part of the mitochondrial gene Cytochrome c oxidase subunit I or COI. We will eventually complete with other alternative or complementary markers.
The chosen species are the erect and tree-like bryozoan Myriapora truncata, and one complex of bioconstructing corallinale algae Lithophyllum stictaeforme/cabiochiae, both of which are identifiable in situ. They were selected as they have a widespread occurrence in the coralligenous, on all the facies and at all depths (even at very low irradiance).
Myriapora truncata (Pallas, 1766) is a common bryozoan of the coralligenous
habitats throughout their distribution area. Despite its reproduction pattern (low dispersal lecitotrophic and brooded larvae), it is widespread in the Mediterranean coasts. We wonder whether there is a single species in different Mediterranean basins, or whether there are cryptic species, even possibly in sympatry, as for other bryozoans. Red calcareous algae of the order
Corallinales are the main coralligenous builders [1] [8] [9] [18]. We chose to study the genetic diversity within the species complex of Lithophyllum stictaeforme/cabiochae (Areschoug) Hauck, 1877 / (Boudouresque & Verlaque, 1978) Athanasiadis). We compare the frequencies of different genetics variants, so it is important to have enough specimens in order to be able to conclude on the possible presence of significant differences of the genetic frequencies. About thirty individuals are required for each locality's sample [15] [19].
The sampling should be made on two sides of the study site, if possible opposite ones, and at depth of 28 ± 1 m, making sure that the collected samples would come from all possible orientations. In each side, we chose two different profiles (in terms of the inclination and the roughness of the substrate). These profiles would have been firstly determined by the results of the cartography.
Standard PCR protocols is used to amplify COI fragments for both the bryozoan and the red alga, as well as another marker, not from the mitochondrial genome, for each species (detailed methods to be published elsewhere): an intron for Myriapora truncata [4] [6], and a chloroplastic marker for Lithophyllum sp. [3]. PCR products are sent to the industry for DNA sequencing, then after alignement, haplotype network reconstruction is made using the Median Joining Network software [2].
Results
Photo-quadrats inter calibration
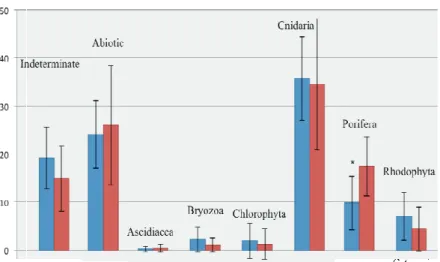
To compare the sampling methods 20 photo-quadrats done by the permanent transect method were compared to 18 photo-quadrats (2 patches) done by the random patches method. The preliminary results are presented on figure 3. It shows that at the phylum level, the two methods give equivalent results. Differences of headcounts are only significant in the phylum Porifera. Thus results are comparable
.
Figure 3 – Comparison of results given by the permanent transect method (blue) and the random patches method (red). The star marks a significant difference according to the Mann-Whitney-Wilcoxon test with a 5 % risk.
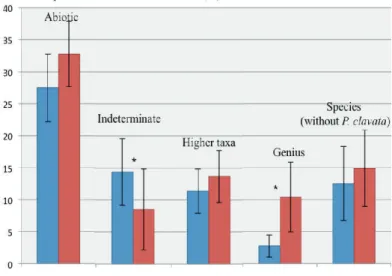
Figure 4 – Comparison of results obtained with a medium quality camera (blue) and a high quality camera (red). The star marks a significant difference according to the Mann-Whitney-Wilcoxon test with a risk of 5 %.
To compare both cameras, two sets of 8 photo-quadrats done on a permanent transect at the exact same place, were used. One was done with the medium quality camera, and the other one done with the high quality camera. But as the pictures were not taken at the exact same time, the species Paramuricea clavata disturbed the observations as it had its polyps spread out or not, depending on the set. To free ourselves from this disturbance, all observations of Paramuricea clavata were removed from both sets. The figure 4 shows that at the species level both cameras give equivalent results. But the camera of high quality enabled to reduce the number of “indeterminate” and these observations were assigned to other categories, in the majority at the genus taxa level.
Figure 5 – Comparison of results observed by different operators: one novice (in red) and two experienced (orange and brown). Mean and standard deviation between the three operators are in white cross-brace. The identifications validated by the three operators are in green.
The preliminary results on certain categories are shown on the figure 5. It shows that after only one exchange between the three operators, the novice improve a lot his capacity of identification. For some categories, the level of knowledge of the three operators gets quickly homogenized: for instance for the categories Cnidaria and Porifera. They are in most case very hard to identify on photography. From this work, it appears that cnidarian species are easiest to identify on photography by beginners while poriferan species are mostly very hard to identify without specific training
.
Photo-quadrats and genetic sampling contextualization
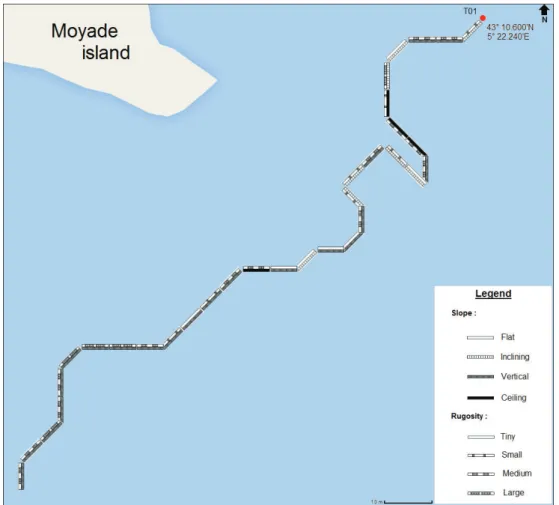
The figure 6 shows a specific symbology which has been developed in order to represent as clearly as possible on one map the orientation, slope (in black) and roughness (in red) of coralligenous habitats
.
Figure 6 – Cartography of coralligenous habitats around Moyade Island at the isobath 28 ± 1 meters deep with first symbology (to be evaluated).
Analysis of the preliminary cartography results
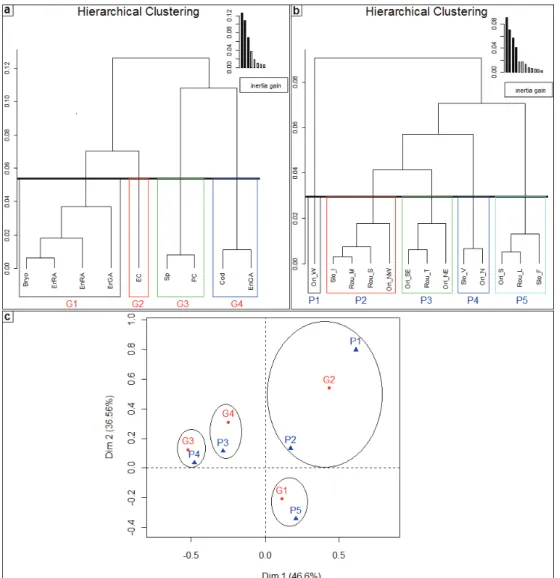
Using Hierarchical Ascendant Classification (HAC) and Correspondence Factorial Analysis (CFA) on all processed data allowed (i) to group species according to values of orientation, slope and roughness, and (ii) to pool profile parameters according to species observed per segment. They HAC shows four groups of species (Figure 7a) and five groups of profil parameters (Figure 7b). The CFA was performed on the sum of the frequencies of each variable (species and profile parameters) show in Table 2.
Figure 7 – HACs of (a) observed species (q.v. code Table 1), (b) profile parameters (first letter of the variable with : “Ori” for orientation, “Rou” for Roughness and “Slo” for Slope) and (c) FCA on frequencies of different groups of species (G1 to G4) and groups of profile parameters (P1 to P5) obtained from the HAC. n = 117.
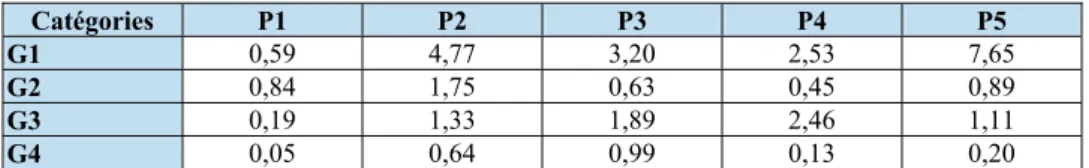
Table 2 – Table of frequencies for each species group and profile parameter (%). Catégories P1 P2 P3 P4 P5 G1 0,59 4,77 3,20 2,53 7,65 G2 0,84 1,75 0,63 0,45 0,89 G3 0,19 1,33 1,89 2,46 1,11 G4 0,05 0,64 0,99 0,13 0,20
The aim of the AFC is to associate, at best, a single group of species with a single group of profile parameters. Here, the AFC is a representation of the grouping based on proximity most common observations. Groups can be combined as follow: the group G1 is associated with P5. As P1 contains only one profile parameter, the group G2 is associated with P1 and P2. G3 and G4 groups are respectively associated with P4 and P3 groups.
Using Factorial Correspondence Analysis and Ascending Hierarchical Classifications, preferential profiles of coralligenous species can be determined: bryozoans, encrusting and foliose red algae and foliose green algae occur preferentially on horizontal walls South-oriented with large roughness. Eunicella cavolinii is mainly present on inclined walls facing West/North-West with low or medium roughness. Porifera and
Paramuricea clavata are preferentially present on vertical walls facing north. Codium
genus and encrusting green algae are more present on walls facing South-East and North-East with tiny roughness. A “profile” is thus a combination of orientation parameters combined with inclination and roughness. Further detailed study will be conducted on associations of profile features to determine the preferential profiles of different coralligenous communities. Moreover, a pre-established species list will be detailed in order to obtain more accurate results. The identification of various difficulties encountered during the contextualization work will allow other participants of the CIGESMED program to use this method in Greek and Turkish coralligenous habitats.
Data and network organisation
The aim of the data systems in CIGESMED is to make data reusable and scalable with other observatory networks. The primary principle of data organisation in CIGESMED is to not centralize data, but to adopt all accessible formats, and propose (i) a typology to contextualize taxonomic observations and ecological structure studies and (ii) tools to share these data at a large scale (Mediterraean Sea) and over the long term (at least 10 years). Achievement of these objectives requires to use (i) open access, open data, and open source software, (ii) more exchanges between country scientific communities about coralligenous studies, and (iii) make sure that surveys and protocols are reusable (cost effective, security in dive and analytics methods, knowledge of managers…). The first tool that must permit it is a plugin able of self-automatic installation on the web site of the partners, in order to install the database with formatted fields and some options to share data. The sharing flux is provided on different formats (XML, RDF), permitting to build graphs out of the information system and to request a selected part of the dataset. These data of one partner can be aggregated with other partner datasets, respecting the same query. Indexations servers and programs are responsible to build these graphs. Moreover specific ontologies will permit to densify the links between the different objects presented above (assigned points, photos, segments...). At this scale, the query is using metrics of
contextualization to improve the sensibility of each analysis and to understand what is comparable between Mediterranean regions and what is not. The objective is to build new representations of data, used to find correlation between discrete and non-ordinate values, and not only systems of metrics.
Discussion
Assessment of the environmental status
The assessment consists of the analysis of the coralligenous megabenthic assemblages by means of direct observation, photographic/video surveys (which are directly influenced by competencies and experience of the operators). This is done in order to investigate basic demographic characteristics of key associated species populations and disturbances and threats and to correlate biotic (i.e. alien species) and abiotic factors affecting the coralligenous habitats. This requires understanding the effect of each factor on data variability.
The quality of the photo-quadrats dataset suffers from the difficulty to properly isolate each variable studied. This is mainly due to the complexity of undersea operations, but it can be improved by experience gain.
The study of both sampling methods (linear or random transect) shows that observations made at a phylum level of identification are comparable if they are made according to the one or the other method. But to compare Porifera observations from one site to another, it would be recommended to implement the same method in both sites, as it’s shown that there might be significant difference of headcounts according to the applied method. As the random patch method is easier to perform, it should be recommended.
Concerning the effect of the quality of the camera on the observations made, it has been proven that the medium quality camera is sufficient to identify as much species as the high quality camera. Difference between the two is observed for species difficult to differentiate at the genus level. Indeed the high quality camera enables to give a taxonomic level at some individuals that were indeterminate with the medium quality camera. As the medium quality camera is more affordable for managers of marine protected area (5 time less expensive), it should be preferred. Finally the study of the operator’s knowledge shows that the discussion between operators enables novices to quickly improve their capacity of identification. Discussion is very useful at the beginning, and then operators reach a step, and would need a proper training to progress, if more precise identification is needed.
It should be noted that the results presented in this document are preliminary, and that work is still running. The non-independence of the variables studied implies that the hypothesis should be stipulated very carefully.
Population studies
The objective of the cartography goes beyond than mapping habitats; it provides information about environmental profiles (slope, orientation, roughness and main stands) that will be used to understand species preferences. The population genetics approach which will complete the analyses is essential to investigate species diversity, population structure and connectivity.
Myriapora truncata is an erect and robust bryozoan that is a coralligenous
bio-constructor found in most of the coralligenous stands. Mitochondrial and nuclear genetic markers are now tested on samples collected throughout littoral of the three Mediterranean countries implied in CIGESMED. Sequencing data of different genes are used to study (i) the phylogeny of Myriapora truncata and look for cryptic species, (ii) the phylogeography in order to understand its distribution area, (iii) the connectivity between populations. Lithophyllum cabiochiae is a red calcareous alga taking a major part in the coralligenous structure. Due to its photosynthetic and calcifying ability, it has an important ecological role in the carbon flux, benthic productivity, and the habitat complexity of this typically sciaphilic Mediterranean ecosystem.
Lithophyllum cabiochiae is considered to be a Mediterranean species and L. stictaeforme its Atlantic sister species. Despite their ecological importance, the
identification in these species is quite hard and their taxonomic status, presently based on morphology, is constantly changing. Our work aims to answer the taxonomic questions about these species complexes by means of molecular markers and to provide information on their population structure and phylo-geography within the Mediterranean basin. The connectivity amongst the study sites could be evidenced, helping the decisions taken about management and conservation issues.
The first results about genetic differentiation of the populations of distinct localities for each taxon illustrate the fact that gene flow (migration) is limited even at the small scale of the Marseilles region for those important coralligenous builders. Genetic barrier were previously evidenced for other species analysed in population genetics as different as the mysid Hemimysis margalefi [10] (Lejeusne and Chevaldonné 2006) or the irregular sea urchin Echinocardium cordatum [5] (Egea 2011). It may also be linked to ecological conditions; the study of the distribution of divergent groups of each species depending on currents and ecologic profiles has to be carried out.
For this study, the mapping of coralligenous habitats can be improved. Species presents in some groups are very different. So, for futures mapping, these species will be separated. For example, the group Erect Green Algae will become Halimeda tuna and
Flabellia petiolata; Red Algae will become Mesophylum, Lithophyllum and
Peyssonneliaceae; Sponges will become erect sponges and encrusting sponges. Moreover, the aim of the mapping is to associate the coralligenous communities with their preferential profile (orientation, slope, roughness) and not just with parameters. So, when the dataset will be enough large, these analyses will be conducted on all of profiles possibilities.
Data and network organisation
New representations of data, built to find correlation between discrete and non ordonate values, and not only systems of metrics depends on the quality of ontologies. The network and partners are testing now the robustness of each typology for characterization, in order to be sure that all measurements have the same meaning.
Metrics that happen to be discriminant on these representations will be tested. The aim is to apply a new index of conservation state along French coasts, to test this index on coralligenous bottoms in the Eastern Mediterranean basin and compare it with other methods used to evaluate the conservation status of the benthic communities of coralligenous bottoms.
Conclusion
A difficulty generally not taken in account is the human factor. The aim of this pilot study of operational ecology is to improve knowledge on the dynamic of coralligenous habitats and also to improve their management by creating protocols and tools. This preliminary work yet enables to better understand the importance of the level of the skill and training of operators, the type of sampling methodology implemented. CIGESMED integrated approach of complexity of coralligenous habitats must permit to mutualize and visualize large data collections, and manage knowledge to study ecosystems. Indicators, from communities to infra-specific level, will be co-constructed and their variability will be tested by scientists, marine natural parks and reserves managers, and through the implementation of a “citizen science” network. The use of new representations of data and controlled qualifications as links in a graph as tools to sort, organize and illustrate very large heterogeneous data sets is an original approach. The outcome will be an integrative assessment of the GES within the MSFD.
To continue to build the network, the community is developing a metadata catalogue and some shared typologies; we are working now on i) harmonization of data collection methods and normalization of data access (European norms) ii) initiation/animation of thematic network about coralligenous habitats in Mediterranean Sea gathering all competent actors. This network is meant to be perennial, open, and fully decentralized (to allow for continuous update) at local, regional, national and international scales
This organisation will permit data diffusion and upper accessibility through local, regional, national and international reports and Quality Management System at each geographic level (local, regional, national levels) to ensure continuous improvement.
Acknowledgements
We are gratefull to the organizing committee who invite one of us (RD). We thank A. Haguenauer, S. Chenesseau, F. Zuberer and all the underwater diving team for their participation to the sampling in Marseilles and T. Dailianis for samples from Crete. We thank M. Verlaque who helps us for the identification of Corallinales and A. Le Gall for helpful advices. Thanks are also due to S. Chenesseau and A. Ereskovsky for the SEM. A special thanks to the SIP (Computing Service of the OSU Pytheas) who provides all the hardware part and assistance for developments.
This project was funded by the SeasEra program CIGESMED (CNRS- ANR convention n° 12-SEAS-0001-01).
References
[1] Ballesteros E. (2006) - Mediterranean coralligenous assemblages: a syntheses of
present knowledge, Oceanogr. Mar. Biol., Annu. Rev. 44, 123 – 195.
[2] Bandelt H. J., Forster P., Röhl A. (1999) - Median-joining networks for inferring
intraspecific phylogenies, Mol. Biol. Evol. 16, 37 – 48.
[3] Broom J. E. S., Hart D. R., Farr T. J., Nelson W. A., Neill K. F., Harvey A. S., Woelkerling W. J. (2008) - Utility of psbA and nSSU for phylogenetic reconstruction in
[4] Chenuil A., Hoareau T. B., Egea E., Penant G., Rocher C., Aurelle D., Mokhtar-Jamai K., Bishop J. D. D., Boissin E., Diaz A., Krakau M., Luttikhuizen P. C., Patti F. P., Blavet N., Mousset S. (2010) - An efficient method to find potentially universal
population genetic markers, applied to metazoans, BMC Evol. Biol. 10, 276.
[5] Egea E (2011) - Histoire évolutive, structures génétique, morphologique et
écologique comparées dans un complexe d’espèces jumelles: Echinocardium cordatum (Echinoidea, Irregularia). Aix-Marseille Université, Marseille.
[6] Gérard K., Guilloton E., Arnaud-Haond S., Aurelle D., Bastrop R., Chevaldonné P., Derycke S., Hanel R., Lapègue S., Lejeusne C., Mousset S., Ramšak A., Remerie T., Viard F., Féral J. -P., Chenuil A. (2013) - PCR survey of 50 introns in animals:
Cross-amplification of homologous EPIC loci in eight non-bilaterian, protostome and deuterostome phyla, Mar. Genomics. 12, 1 – 8.
[7] Hong, J. -S. (1980) - Etude faunistique d’un fond de concrétionnement de type
coralligène soumis à un gradient de pollution en Méditerranée nord-occidentale (Golfe de Fos), Thèse de doctorat. Aix-Marseille II.
[8] Laborel J. (1961) - Le concretionnement algal "coralligène" et son importance
géomor-phologique en Méditerranée. Recueil Travaux Station Marine d'Endoume. 23, 37-60.
[9] Laubier L. (1966) - Le coralligène des Albères. Monographie Biocoenotique. Ann. Inst. Océan., Paris.
[10] Lejeusne C, Chevaldonné P (2006) - Brooding crustaceans in a highly fragmented
habitat: the genetic structure of Mediterranean marine cave-dwelling mysid populations. Mol Ecol 15, 4123–40
[11] Marion A. F. (1983) - Esquisse d’une topographie zoologique du Golfe de Marseille. Ann. Mus. Hist. Nat., Marseille, Marseille.
[12] Martin S., Charnoz A., Gattuso J. -P. (2013) - Photosynthesis, respiration and
calcification of the Mediterranean crustose coralline alga Lithophyllum cabiochae (Corallinales, Rhodophyta). Eur. J. Phycol. 48, 163 – 172.
[13] Noisette F. (2013) - Impacts de l’acidification des océans sur les organismes
benthiques calcifiants des milieux côtiers temprérés. Thèse de doctorat. Université
Pierre et Marie Curie.
[14] Pedel L., Fabri M. C., Menot L., Van Den Beld I (2013) - Mesure de l’état écologique
des habitats benthiques du domaine bathyal à partir de l’imagerie optique. (Sélection de métriques et proposition d’une stratégie de surveillance). Convention
13/1210491/NYF Convention MEDDE-Ifremer pour le Bon Etat Ecologique des habitats benthiques profonds.
[15] Porter J. S., Ryland J. S., Carvalho G. R. (2002) - Micro- and macrogeographic
genetic structure in bryozoans with different larval strategies. J. Exp. Mar. Biol.
Ecol. 272, 119-130.
[16] RAC/SPA UNEP – MAP (2006) - Classification des biocénoses benthiques marines
de la région Méditerranéenne. CAR/ASP (Tunis), 13 p.
[17] RAC/SPA UNEP – MAP (2009) - Proceedings of the 1st Mediterranean symposium
on the conservation of the coralligenous and other calcareous bio-concretions,
RAC/SPA (Tabarka), January. 1–278.
[18] Sartoretto S. (1996) – Vitesse de croissance et bioérosion des concrétionnements
‘coralligènes’ de Méditerranée nord-occidentale. Rapport avec les variations Holocènes du niveau marin. Thèse doctorat d’écologie. Université d’Aix-Marseille II 194 p.
[19] Schwaninger H. R. (1999) - Population structure of the widely dispersing marine
bryozoan Membranipora membranacea (Cheilostomata): implications for population history, biogeography, and taxonomy. Mar. Biol. 135, 411 – 423.
[20] Trygonis V., Sini M. (2012) - PhotoQuad: A dedicated seabed image processing
software, and a comparative error analysis of four photoquadrat methods. J. Exp.
Mar. Biol. Ecol. 424, 99-108.
[21] Walsh P. S., Metzger D. A., Higuchi R. (1991) - Chelex 100 as a medium for simple
extraction of DNA for PCR-based typing from forensic material, Biotechniques 10,