HAL Id: hal-01408737
https://hal.archives-ouvertes.fr/hal-01408737
Submitted on 5 Dec 2016
HAL is a multi-disciplinary open access
archive for the deposit and dissemination of
sci-entific research documents, whether they are
pub-lished or not. The documents may come from
teaching and research institutions in France or
abroad, or from public or private research centers.
L’archive ouverte pluridisciplinaire HAL, est
destinée au dépôt et à la diffusion de documents
scientifiques de niveau recherche, publiés ou non,
émanant des établissements d’enseignement et de
recherche français ou étrangers, des laboratoires
publics ou privés.
Reducing Invalid Connections with
Microstructure-Driven Tractography
Gabriel Girard, Alessandro Daducci, Laurent Petit, Jean-Philippe Thiran,
Kevin Whittingstall, Rachid Deriche, Demian Wassermann, Maxime
Descoteaux
To cite this version:
Gabriel Girard, Alessandro Daducci, Laurent Petit, Jean-Philippe Thiran, Kevin Whittingstall, et
al.. Reducing Invalid Connections with Microstructure-Driven Tractography. ISMRM workshops:
Breaking the Barriers of Diffusion MRI , Sep 2016, Lisbonne, Portugal. �hal-01408737�
Reducing Invalid Connections with Microstructure-Driven Tractography
Gabriel Girard
1,2,3, Alessandro Daducci
1,3, Laurent Petit
4, Jean-Philippe Thiran
3, Kevin Whittingstall
5,6, Rachid Deriche
2,
Demian Wassermann
2,†, Maxime Descoteaux
1,6,†1 Sherbrooke Connectivity Imaging Lab, Computer Science Department, Université de Sherbrooke, Canada 2 Project Team Athena, INRIA Sophia Antipolis –
Méditerranée, France 3 Signal Processing Lab (LTS5), École Polytechnique Fédérale de Lausanne, Switzerland 4 Groupe d'Imagie Neurofonctionnelle, Institut des Maladies Neurodégénératives - UMR 5293, CNRS, CEA University of Bordeaux, France 5 Department of Diagnostic Radiology, Université de Sherbrooke, Canada
6 Sherbrooke Molecular Imaging Center, Department of Nuclear Medicine and Radiobiology, Université de Sherbrooke, Canada † These authors contributed equally. INTRODUCTION: Diffusion-weighted imaging (DWI) tractography has become the tool of choice to probe the
human brain's white matter (WM) in vivo. However, tractography algorithms produce a large number erroneous/invalid streamlines [1] largely due to complex ambiguous local fiber configurations (e.g. crossing, kissing or fanning). Moreover, the relationship between the resulting streamlines and the underlying WM microstructure characteristics, such as axon diameter, remains poorly understood [2]. The distinctive aspect of our tractography algorithm from previous methods is the active use of microstructure information about fascicles during the tracking. This enables us to solve areas of complex tissue configuration and separate parallel fascicles with different microstructure characteristics, hence improving the overall tractography process.
METHODS: We used the deterministic tractography AxTract [5] to simultaneously trace fascicles and estimate
their axon diameter characteristics. The main hypothesis driving AxTract is that the mean diameter of the axons composing a fascicle varies slowly along its pathway [6]. AxTract locally selects the peak of the fiber Orientation Distribution Function (ODF) that better follows the microstructural information estimated in previous propagation directions. The microstructural information is estimated using the ActiveAx model [3] generalized to multiple fiber populations per voxel [7], implemented in the efficient AMICO framework [4]. AxTract estimates, in each fiber ODF peaks, the mean diameter associated to signal fitted cylinder response functions: the axon diameter index [3,4,7]. The axon diameter index is then used to select the propagation direction. AxTract streamlines are compared to the same deterministic tractography algorithm without using the axon diameter index information, referred as conventional deterministic tractography (CDT). The only difference between AxTract and CDT is thus the selection of the propagation direction at tracking positions with multiple direction: CDT always selects the propagation direction that minimize the curvature of the streamline, AxTract selects the propagation direction with axon diameter index the closest to the axon diameter index associated to the streamline [5].
DATASET: We used Phantomas to generate a kissing configuration between two fascicles and obtained the fascicle
directions at each voxel. For each fascicle direction, the DWIs were independently simulated for a distribution of parallel cylinders diameter, with a fixed distinct mean diameter per fascicle [7]. The synthetic DWIs were generated with the in vivo imaging protocol (details below) using Camino, and then contaminated with Rician noise at signal to noise ratio (SNR) 20. To evaluate reconstructed streamlines, we used the Tractometer [1] connectivity analysis. We report the Valid (VC) and Invalid Connections (IC) for both AxTract and CDT (VC: % of streamlines connecting expected regions of interest , IC: % of streamlines connecting unexpected regions of interest).
We tested our method on the MGH adult diffusion dataset (34 subjects) [8] (552 volumes, b-values up to 10,000s/mm2, δ=12.9ms, Δ=21.8ms, 1.5mm isotropic voxels). We used the provided pre-processed DWIs corrected
for motion and EDDY currents. Fiber ODFs were computed from spherical deconvolution [9] using Dipy on a single b-value shell of 3000s/mm2. T1-weighted 1mm isotropic resolution images were registered to the diffusion
images using ANTs. The brain parcellation was then obtained using FreeSurfer and WM fascicles were obtained using TractQuerier. We report the changes in streamline count as: (countAxTract - countCDT)/ countCDT. T1-weighted
images were also registered to the ICBM 2009a Nonlinear Symmetric Atlas [10] for voxel-based group analysis.
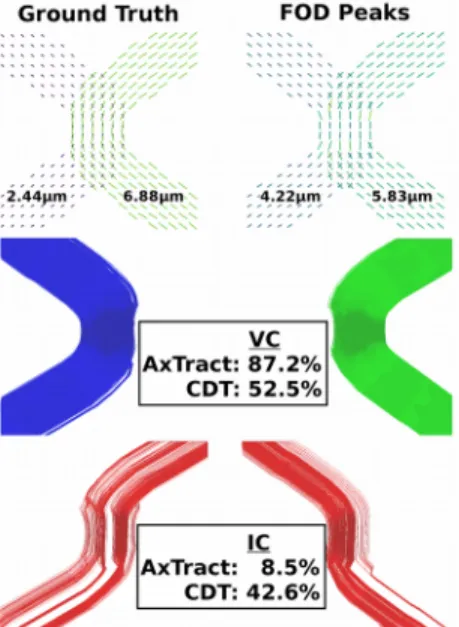
RESULTS AND DISCUSSION: Figure 1 (top row) shows the ground truth directions used to generate the
synthetic data and the peaks extracted from the fiber ODFs scaled by the axon diameter index estimated with
AMICO. Figure 1 (middle and bottom rows) show the streamlines reconstructed using AxTract. VC increases from
52.5% with CDT to 87.2% with AxTract and the IC decreases from 42.6% to 8.5% respectively. This shows that
AxTract can distinguishes fascicles in complex architectures when these have different axon diameters. AxTract
privileges following the direction which minimises the deviation from axon diameter index of the fascicle being traced while the CDT approach is to minimise the directional deviation. In doing so, AxTract is able to better resolve the kissing scenario and decreases the percentage of IC.
The changes in streamline count between AxTract and CDT across five fascicles of 34 healthy subjects are shown in Figure 2. It shows that using the same tractography parameters, only changing the selection of the propagation direction with AxTract, the mean relative changes in streamline count across the 34 subjects increases for most of the selected fascicles, e.g. the CST (left: 11.6%, right:11.6%) and the UF (left: 6.7%, right: 13.0%). This suggests that AxTract has a consistent effect on some of the reported fascicles reconstruction across subjects and possibly overall increasing VC. Further research is needed to validate these changes in the
streamlines distribution in vivo. Figure 3 shows the average occurrence map of
AxTract selecting a different propagation direction than CDT over the 34 subjects. AxTract changed the propagation direction in 38% of tracking steps where multiple
directions were available. Figure 3 suggests this happen more frequently in crossing areas underneath to the cerebral cortex.
AxTract enables the possibility of solving the tracking through complex WM areas
using axon diameters information and reducing invalid connections.
REFERENCES: [1] Coté et al. (2013) MIA, [2] Jones (2010) Imaging Med, [3]
Alexander et al. (2010) Nimg, [4] Daducci et al. (2015) NImg, [5] Girard et al. (2015) IPMI, [6] Aboitiz et al. (1992) Brain Res, [7] Auria et al. (2015) ICIP, [8] Setsompop
et al. (2013) Nimg, [9] Tournier et al. (2007) Nimg, [10] Fonov et al. (2011) Nimg.
Figure 3: Average occurrence map of AxTract selecting a different propagation direction than CDT over the 34 subjects.
Figure 2: Changes (%) in streamline count between AxTract and CDT accross fascicles of 34 subjects. The red square indicates the mean, the
red line indicates the median, the box extends from 1st to 3rd quartile and the wiskers from the 5th to 95th percentile.
Figure 1: Tractometer evaluation of AxTract and CDT on a synthetic kissing dataset (SNR=20).