Publisher’s version / Version de l'éditeur:
Proceedings of SPIE, 7750, pp. 77500A-1-77500A-7, 2010-09-21
READ THESE TERMS AND CONDITIONS CAREFULLY BEFORE USING THIS WEBSITE.
https://nrc-publications.canada.ca/eng/copyright
Vous avez des questions? Nous pouvons vous aider. Pour communiquer directement avec un auteur, consultez la
première page de la revue dans laquelle son article a été publié afin de trouver ses coordonnées. Si vous n’arrivez pas à les repérer, communiquez avec nous à [email protected].
Questions? Contact the NRC Publications Archive team at
[email protected]. If you wish to email the authors directly, please see the first page of the publication for their contact information.
NRC Publications Archive
Archives des publications du CNRC
This publication could be one of several versions: author’s original, accepted manuscript or the publisher’s version. / La version de cette publication peut être l’une des suivantes : la version prépublication de l’auteur, la version acceptée du manuscrit ou la version de l’éditeur.
For the publisher’s version, please access the DOI link below./ Pour consulter la version de l’éditeur, utilisez le lien DOI ci-dessous.
https://doi.org/10.1117/12.872874
Access and use of this website and the material on it are subject to the Terms and Conditions set forth at
Spectral signal processing in swept source optical coherence
tomography
Chang, Shoude; Mao, Youxin; Flueraru, Costel
https://publications-cnrc.canada.ca/fra/droits
L’accès à ce site Web et l’utilisation de son contenu sont assujettis aux conditions présentées dans le site LISEZ CES CONDITIONS ATTENTIVEMENT AVANT D’UTILISER CE SITE WEB.
NRC Publications Record / Notice d'Archives des publications de CNRC:
https://nrc-publications.canada.ca/eng/view/object/?id=f8c8adb9-5a2f-4234-8b92-528e0c650a77 https://publications-cnrc.canada.ca/fra/voir/objet/?id=f8c8adb9-5a2f-4234-8b92-528e0c650a77
SPECTRAL SIGNAL PROCESSING IN SWEPT SOURCE OPTICAL COHERENCE
TOMOGRAPHY
Shoude Chang, Youxin Mao, and Costel Flueraru
Imaging Devices Group, Institute for Microstructural Sciences
National Research Council Canada, Ottawa, Ontario, Canada K1A 0R6
ABSTRACT
OCT (optical coherence tomography) is generally regarded as the 6th imaging modality. This light-based system ideally suits for bio-medical diagnostic imaging applications. Outperforming to the time-domain OCT, Swept-Source OCT (SSOCT) is termed as the second generation OCT, in which, usually, thousand of individual wavelengths are sent into the system in a time sequence. The backscattered or back reflected light from the testing sample is collected by a sensor corresponding to each wavelength. The thousand received signals actually represent the Fourier coefficients in the spectrum domain. However, these coefficients only have real positive values as the sensor can only produce intensity signal. This paper describes the signal processing issues related with this intensity spectrum. Various filters, high-pass, low-pass and band-pass; spectrum decomposition; spectrum combination are discussed and demonstrated. A method for spectral synthesis of multiple light sources is presented.
Key words: optical coherence tomography, swept source OCT, spectral signal processing. 1. INTRODUCTION
Optical coherence tomography (OCT) is an emerging technology for high-resolution cross-sectional imaging of 3D structures. The first OCT system was reported by Fujimoto et al in 1991 [1], and then the OCT technology has been attracting attentions of researchers all around world [2,3].
OCT relies on the interferometric measurement of coherent back scattering variation to sense the surface structure of test samples like biological tissues or other turbid materials. It takes advantage of the short temporal coherence of a broadband light source to achieve precise optical sectioning in the depth dimension.
Time domain OCT system is based on a Michelson interferometer. In time-domain OCT (TD OCT) systems, broadband source is used in interferometer. The coherent gate is then created to separate the tomography at a certain layer. A mechanic scanning device is used to select difference layer at different depth by moving the reference mirror. This scanning procedure determinates the processing speed of the whole system.
As the scanning procedure in TD OCT is actually a procedure of convolution, it can be expressed by
Id ∝ Es ⊗ Er . (1)
Where Es and Er are the electronic fields from source and reference arms, respectively. Its Fourier transform becomes
Id (ω) ∝ ss (ω) • sr (ω) . (2)
Where, ss(ω)= ½ s(ω), sr (ω)= ½ s(ω) sr(ω). sr(ω), ss (ω) are Fourier transform of Es and Er, respectively. s(ω) is the
light source spectrum. Considering the interferometer structure, the signal detected by sensor is given by
Id (ω) = | sr (ω) + ss (ω) • sr (ω) |2 = S(ω) [1+ ss (ω) ] 2 , (3)
Equation (3) is the foundation of Fourier Domain OCT (FDOCT) or Spectral Domain OCT (SDOCT) [4,5], which is illustrated in figure 1.
SDOCT illustrated in Fig. 1 extracts the spectral signal by menas of a grating spectometer and a linear detector-array. The reconstruction of the internal tomography is performed by an inverse Fourier transform of Id(ω). The configuration in Fig. 2 uses
a swept laser as the light source, it is called Swept Source OCT (SSOCT). SDOCT gets all the broadband Ids (ω)
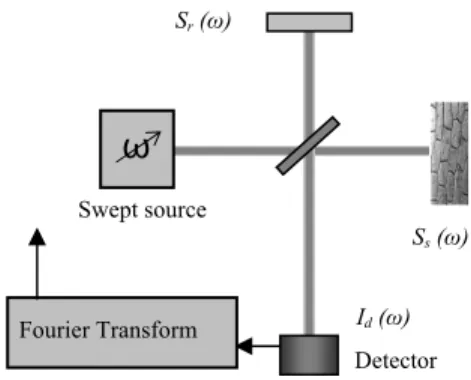
in one shot but collects the signal in series from the linear detector array. However, SSOCT collects the spectral signal in series by changing the wavelength of the light source. Both need an additional inverse Fourier transform, implemented by either hardware or software.
FDOCT and SDOCT have several advantaged over TDOCT. Because of no mechanic scanning, the FDOCT system is significantly faster, 50 to 100 times, than TDOCT. In addition, both FDOCT and SSOCT have better sensitivity and signal noise ratio [6].
2. SSOCT SPECTRAL SIGNAL
In Swept-Source Optical Coherence Tomography (SSOCT), the broadband light source plays an important role. The linewidth and output power determinate the imaging range of an SSOCT system. The bandwidth of the light source places the main barrier for the imaging resolution. At current stage, most commercial swept-sources have a bandwidth about 100 nm corresponding to an axial resolution around 14 μm in air.
In SSOCT, the swept-source stimulates the system by a series of wavelengths in time sequence; a photo detector then collects all the responses as Fourier series components of testing sample. Because the detector is only sensitive to optical energy, it loses the phase information in the reflected/back scattered signal. At any moment, the signal detected by sensor can be written like this:
I (k) = | E(k) H(k) |2 , k=1,2,3,4…N . (4)
Where, E(k) is the kth wavelength sent from source, H(k) represents the overall reflection from testing sample, and I(k) is the signal generated by the sensor. Assuming S(k) = | E(k) |2, power spectrum of the light source, the output of an interferometer based OCT system can be expressed by [6]:
I(k) = S(k) [ H(k) + 1 ]2 . (5) Extending (5), I(k) = S(k) H2 (k) + 2S(k)H(k) + S(k). Taken S(k) as a constant and H2 (k) as low frequency component
that can be ignored, the processed I(k) becomes
Ip(k) = C H(k), (6)
C is a constant. Figure 1 shows I(k) and Ip(k).
Figure 1. Spectral domain OCT Detector array Grating spectrometer Fourier Transform Broadband source Sr (ω) Ss (ω) Id (ω)
Figure 2. Swept-source OCT Swept source Sr (ω) Ss (ω) Detector Id (ω)
ω
Fourier TransformThe reconstruction of the sample in spatial domain (depth z) is performed by an inverse Fourier transform:
h(z) = IFT[ Ip(k) ] . (7)
At any moment, as Equation (6)(7) are the results from one wavelength, h(z) is a flat curve, meaning one Fourier component can not build a structure. However, if all the Ip(k)s with different wavelengths form a sequence,
Is(k) = Σn Ip(k) δ(k-n), n=1, 2, ...N, (8)
the internal structure of the sample can then be extracted by
h(z) = IFT [ Is(k)] = IFT[ Σn C H(k) δ(k-n) ]. (9)
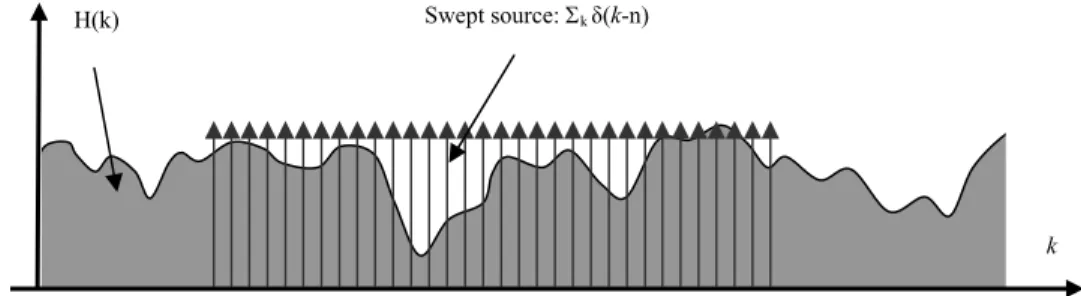
Where, δ(k-n) is used to separate each Fourier series component at a discrete k number, as illustrated in Figure 2.
In Equation (9), each wavelength response H(k) δ(k-n) carries two type of information: 1) structure information of all internal layers corresponding to depth z; 2) spectral information corresponding to wavelength number k. The more wavelengths (bigger N), the finer resolution or richer structure can be reconstructed. N stimulating wavelengths determine the shape of the structure; however, there is no proof that those N wavelengths must be distributed uniformly. Different position of stimulating wavelength may provide different spectral information. For example, M wavelengths can reconstruct N layers. If N layers have different absorption rate corresponding to different wavelength, the change of wavelength can affect the color of layers. In other word, the number of wavelengths defines the number of reconstructed layers; the positions of the wavelengths determine the colors of layers.
Conjugated Ip(k)* S+SH2 Ip(k) I(k)
Figure 3. SSOCT signal
H(k) Swept source: Σk δ(k-n)
k
Wave number Figure 4. Swept source discrete spectrum
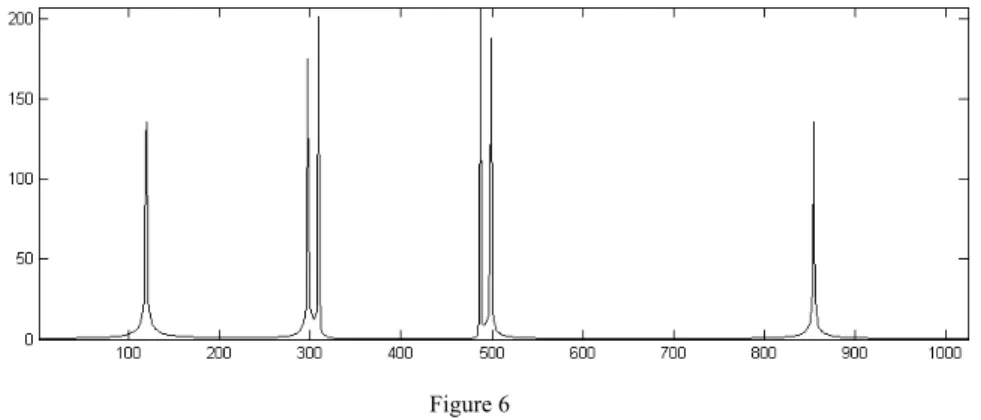
Figure 5 shows the SS-OCT spectral signal simulated from a 3-layer glass slides. The first two slides have a thickness of 1mm. The last one has a thickness of 2mm. All slides have reflective index 1.5. The air gap is 0.1mm. Totally 1024 wavelengths with equal intensity are used as the light source. In the SSOCT spectrum, 1024 wavelength points are presented. Figure 6 shows the reconstructed OCT image. Six impulses indicate the interfaces between slides and air.
3. SSOCT SIGNAL FILTERING
Features of SSOCT spectrum can be described as the following:
• The input is a series of laser impulses. Only one wavelength spears at any moment; • Spectrum is a set of discrete signal ΣN H(k) δ(t-k);
• Spectral variable is wave number k = 2π /ω;
• As the sensor can not detect phase information, directly reconstructed OCT image has a conjugate part (mirror image);
• No DC and low frequency components.
Because of no DC and low frequency components, as shown in S+SH2 in figure 3, SSOCT signal is different to the pattern directly Fourier transformed from the spatial structure. Figure 7 shows the result of direct Fourier transform of the structure shown in figure 6, in which low and high frequency components behave differently to that in figure 5. Lower frequency normally contributes to large area structures and higher frequency is responsible to the small details in spatial structure. Unlike the spectrum in figure 3, the DC and low frequency components as well as high frequency components are closely fused together, so that almost no way to separate them apart.
In SSOCT signal, each wavelength line makes individual contribution to the reconstruction. After inverse Fourier transform, a single wavelength, i.e., a δ function impulse will become a flat curve, which contains no structure of the sample. When multiple wavelengths are used, the meaningful structure appears. The more spectral lines, the more details
Figure 6
will come out. The resolution of the reconstructed image is given by the total number of spectral lines, with less relation of the location of those lines, assuming that the spectrum of sample is constant.
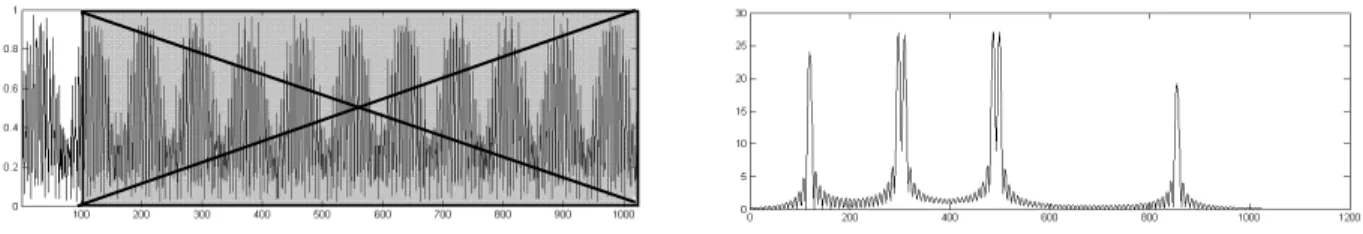
Figure 8 provides a set of reconstructed images of figure 5 after different filtering. Figure 8a and 8b show the reconstructed images after 100 point low-pass, and high-pass filtering, respectively. Figure 8c shows the image after band-pass filtering: only the middle 100 points in figure 5 are taken into the inverse Fourier transform. Figure 8d shows the result from a band-stop filtering. Those images show almost the same reconstructed structure. Because only 10% wavelength components are taken into the reconstruction, those images are much coarser than that shown in Figure 6.
(b) Left: SSOCT signal after low-pass filter. Right: Reconstructed image of left.
(c) Left: SSOCT signal after band-pass filter. Right: Reconstructed image of left.
(d) Left: SSOCT signal after band-stop filter. Right: Reconstructed image of left.
Figure 8. SSOCT signal filtering and reconstruction
4. SSOCT SPECTRAL INTEGRATION
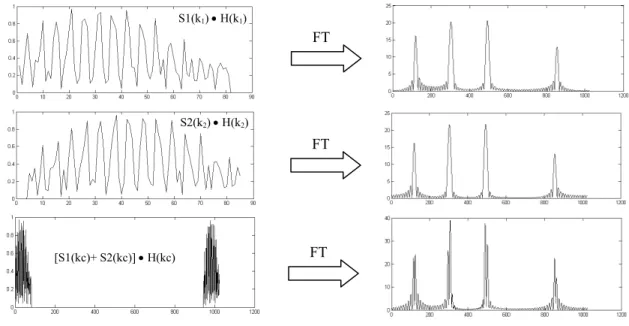
Because SSOCT has a swept wavelength source, there is a time difference between wavelengths sending to the system. In addition, as the sensor is not able to detect phase information, there is no coherence among different wavelengths, especially when time becomes longer. Each wavelength independently makes its contribution to the reconstruction as a Fourier series component. This feature gives SSOCT a possibility to increase the bandwidth by combining multiple swept-sources which have different central wavelengths. Figure 9 shows two swept-sources S1(k) and S2(k) with different parameters: central wavelength (k01, k02); impulse interval (Δk1, Δk2); and impulse intensity (A1, A2). The combined swept source S(k) = S1(k) + S2(k). The combined SS-OCT spectrum is given by
I(kc) = a1 S1(kc) H(kc) + a2 S2(kc) H(kc) . (10)
Where, kc is the new k scale in the combined discrete spectrum, and interval Δkc is the maximal common divisor of Δk1, Δk2. In order to have all the wavelengths in different sources make the same contribution to reconstruction, coefficients a1 a2 are introduced so that a1 A1 = a2 A2.
Figure 10 shows computer simulations of two sources combination. Two SSOCT spectral signals S1(k)H(k) and
S2(k)H(k), each having 80 wavelength points with 960 wave number separation between them, are combined together.
The reconstructed image shows higher spatial resolution than those separately reconstructed from two sources, as shown in Figure 10. Wave number k S1(k) S2(k) A1 k11 k12 N1 k01 Δk1 k21 k22 A2 N2 k02 Δk2 H(k)
Figure 9. SSOCT spectrum integration
Figure 10. SSOCT 2 source spectrum integration S1(k1) • H(k1) [S1(kc)+ S2(kc)] • H(kc) FT S1(k1) • H(k1) FT S2(k2) • H(k2) FT
5. SUMMARY AND DISCUSSION
SS-OCT is based on a series of wavelength impulse responses as Fourier series decomposition. Each impulse response contains two types information for reconstruction: internal structures and spectral feature of the sample. As SSOCT signal contains no DC and low frequency components, each spectral line makes equal contribution to the reconstruction. The more spectral lines in SSCT signal, the more details will be created in the reconstructed image. The linewidth of the spectral line defines the imaging depth, and the total number of spectral lines contained in SSOCT spectrum gives the depth resolution. Because only one wavelength exists at any moment and almost no coherence between the sweeping wavelengths, it is possible to integrate the OCT signals obtained from multiple swept sources to extend the effective bandwidth and eventually enhance the axial resolution the reconstructed OCT image.
REFERENCE
[1] D. Huang, E. A. Swanson, C. P. Lin, J. S. Schman, W. G. Stinson, W. Chang, M. R. Hee, T. Flotte, K. Gregory, C. A. Pullafito, J. G. Fujimoto, “Optical Coherence Tomography,” SCIENCE, 254, 1178-1181 (1991).
[2] A F Fercher1, W Drexler, C K Hitzenberger and T Lasser, “Optical coherence tomography—principles and applications,” Rep. Prog. Phys. 66, 239–303(2003).
[3] E. Wolf, Progress in Optics. Elsevier Science B.V. 2002. Chapter 4, “Optical coherence tomography,” by A. F. Fercher and C. K. Hitzenberger.
[4] M. A. Choma, et al. “Sensitivity advantage of swept source and Fourier domain optical coherence tomography,” Opt. Exp. 11, 2183-2189, ISSN:1094-4087. (2003)
[5] R. Leitgeb, C.K. Hitzenberger & A.F. Fercher. “Performance of Fourier domain vs. time domain optical coherence tomography,” Opt. Exp. 11, 889-894, ISSN:1094-4087. (2003)
[6] J. F. de Boer, et al. “Improved signal-to-noise ratio in spectral-domain compared with time-domain optical coherence tomography,” Opt. Lett. 28, 2067-2069, ISSN: 0146-9592. (2003).