Publisher’s version / Version de l'éditeur:
Vous avez des questions? Nous pouvons vous aider. Pour communiquer directement avec un auteur, consultez la première page de la revue dans laquelle son article a été publié afin de trouver ses coordonnées. Si vous n’arrivez pas à les repérer, communiquez avec nous à PublicationsArchive-ArchivesPublications@nrc-cnrc.gc.ca.
Questions? Contact the NRC Publications Archive team at
PublicationsArchive-ArchivesPublications@nrc-cnrc.gc.ca. If you wish to email the authors directly, please see the first page of the publication for their contact information.
https://publications-cnrc.canada.ca/fra/droits
L’accès à ce site Web et l’utilisation de son contenu sont assujettis aux conditions présentées dans le site LISEZ CES CONDITIONS ATTENTIVEMENT AVANT D’UTILISER CE SITE WEB.
12th Canadian Conference on Building Science and Technology [Proceedings],
pp. 197-210, 2009-05-06
READ THESE TERMS AND CONDITIONS CAREFULLY BEFORE USING THIS WEBSITE. https://nrc-publications.canada.ca/eng/copyright
NRC Publications Archive Record / Notice des Archives des publications du CNRC :
https://nrc-publications.canada.ca/eng/view/object/?id=1f47b3d5-a644-420e-98cd-c967367786fd https://publications-cnrc.canada.ca/fra/voir/objet/?id=1f47b3d5-a644-420e-98cd-c967367786fd
NRC Publications Archive
Archives des publications du CNRC
This publication could be one of several versions: author’s original, accepted manuscript or the publisher’s version. / La version de cette publication peut être l’une des suivantes : la version prépublication de l’auteur, la version acceptée du manuscrit ou la version de l’éditeur.
Access and use of this website and the material on it are subject to the Terms and Conditions set forth at
Field performance of exterior solar shadings for residential windows:
summer results
Laouadi, A.; Galasiu, A. D.; Swinton, M. C.; Armstrong, M. M.; Szadkowski,
F.
http://irc.nrc-cnrc.gc.ca
Field performance of exterior solar shadings
for residential w indow s: Summer results
N R C C - 5 0 8 6 5
L a o u a d i , A . ; G a l a s i u , A . D . ; S w i n t o n , M . C . ;
A r m s t r o n g , M . ; S z a d k o w s k i , F .
M a y 2 0 0 9
A version of this document is published in / Une version de ce document se trouve dans:
12th Canadian Conference on Building Science and Technology, Montréal,
Quebec, May 6-8, 2009, pp. 197-210, (v. 1)
The material in this document is covered by the provisions of the Copyright Act, by Canadian laws, policies, regulations and international agreements. Such provisions serve to identify the information source and, in specific instances, to prohibit reproduction of materials without written permission. For more information visit http://laws.justice.gc.ca/en/showtdm/cs/C-42
Les renseignements dans ce document sont protégés par la Loi sur le droit d'auteur, par les lois, les politiques et les règlements du Canada et des accords internationaux. Ces dispositions permettent d'identifier la source de l'information et, dans certains cas, d'interdire la copie de documents sans permission écrite. Pour obtenir de plus amples renseignements : http://lois.justice.gc.ca/fr/showtdm/cs/C-42
FIELD PERFORMANCE OF EXTERIOR SOLAR SHADINGS FOR
RESIDENTIAL WINDOWS: SUMMER RESULTS
A. Laouadi, A.D. Galasiu, M.C. Swinton, M.M. Armstrong and F. Szadkowski
Institute for Research in Construction, National Research Council Canada, 1200 Montreal Road, Ottawa, Ontario, Canada, K1A 0R6
Fax: +1 613 954 3733 Tel: +1 613 990 6868 Email: aziz.laouadi@nrc-cnrc.gc.ca
ABSTRACT
Recent statistics published by Natural Resources Canada estimates that the energy demand for heating and cooling accounts for about 60% of the total energy use of an average Canadian home. Although the overall demand for cooling energy is much lower than the demand for heating, many populated areas experience a peak demand for electricity on summer afternoons. Exterior window shading devices have the potential to reduce solar overheating in summer and heat losses in winter, and to improve the thermal comfort of the house occupants when seated near windows, compared to interior shadings. This work is part of a project which aims to develop guidelines for effective exterior, mid-pane (inside the window) and interior shading devices in Canadian residences. This paper presents the results of three weeks of summer field measurements of exterior insulating rollshutters installed on the windows of a typical two-storey detached house compared to typical interior Venetian blinds installed in an identical neighboring house.
The shading devices were closed in both houses during both daytime and night-time in order to assess the maximum possible savings in cooling energy on a 24-hour basis. The results showed that the daily total electric energy used by the air-conditioning unit and the circulation fan in the house equipped with rollshutters was 12 to 37% lower than in the house equipped with interior blinds. The savings in daily energy use of the air-conditioning unit alone ranged between 23-72%. The rollshutters also reduced significantly the hourly electricity demand for cooling (50-80%), which represents one of the most important benefits of this window shading strategy by having reduced the demand load on the electricity supply system during high-peak demand hours.
RESUMÉ
Selon des statistiques de Ressources Naturelles Canada, la demande énergétique pour le chauffage et la climatisation représente 60% de la consommation énergétique totale d’une maison au Canada. Même si l’appel de puissance pour la climatisation est inférieure à l’appel de puissance requise pour le chauffage, plusieurs localités voient un appel de puissance de pointe les après-midis d’été. Comparés aux stores intérieurs, les dispositifs extérieures présentent le potentiel de réduire les surchauffes en été et les pertes de chaleur en hiver et d’améliorer le confort thermique des occupants situés proches des fenêtres. Le travail présenté ici fait partie d’un projet visant à développer des lignes directrices pour l’utilisation efficace des dispositifs extérieurs et des stores soit intégrés dans le vitrage ou intérieurs, pour les résidences canadiennes. Cet article présente les résultats de trois semaines de monitorage en été du comportement thermique de deux maisons détachées typiques : le premier équipé de volets roulants extérieurs isolés installés devant les fenêtres et le deuxième équipé de stores vénitiens intérieurs.
Les volets roulants et les stores étaient fermés nuit et jour pour permettre d’évaluer le potentiel maximal d’économie d’énergie reliée à la climatisation sur une base journalière. Les résultats démontrent que la
consommation électrique totale de l’unité de climatisation et du ventilateur était de 12 à 37% moindre dans le cas de la maison avec les volets roulants extérieurs comparée à la maison avec stores intérieurs. Les économies d’énergie pour l’unité de climatisation seule étaient de 23 à 72%. Les volets roulants extérieurs ont aussi réduit de façon significative l’appel de puissance horaire pour la climatisation (50-80%), ce qui représente un des avantages les plus importants des dispositifs extérieurs en ce qu’ils permettent de réduire l’appel de puissance électrique durant les heures de pointe.
INTRODUCTION
In Canada, the energy demand for heating and cooling accounts for 60% of the total energy use of the average home (NRCan, 2006). Although the overall demand for cooling energy is much lower than that for heating, many populated areas experience a peak demand for electricity on summer afternoons. Exterior movable solar shading devices installed on windows, such as insulating rollshutters, may reduce the energy use and peak demand for cooling and improve thermal comfort conditions near windows. Exterior shading devices are common in Europe, where some countries even offer tax incentives for their installation in dwellings (e.g., France, MINEFI 2005). However, in cold climates such as Canada’s, the use of exterior shading devices is very limited compared to the ubiquitous interior shadings. The effect of window exterior shadings compared to window interior shadings on the overall energy use of Canadian houses is not known. Determining this shading effect is important for both the design of new houses, where high performance windows are becoming the standard, as well as for the retrofitting of old houses, which employ conventional windows.
A previous field study conducted at the twin-houses facility of the Canadian Centre for Housing Technology (CCHT) showed that the daytime cooling energy used by the house with interior Venetian blinds covering its south-facing windows was 10-12% lower than that used by the house with uncovered windows (Galasiu et al., 2005). When opaque exterior shadings consisting of white plastic panels were used instead of Venetian blinds, the daytime cooling energy was 70% lower compared to uncovered windows. These experiments also showed that the exterior shades outperformed the interior Venetian blinds by 25% when both were closed during a 24-hour period.
Subsequent summer experiments showed daily cooling energy savings of up to 27% when reflective interior shades made of aluminum foil bubble wrap were used, and the seasonal cooling energy savings were estimated to be 10% when compared with windows covered by interior Venetian blinds with slats horizontal (Manning et al., 2006). These experiments also showed that the reflective internal shades substantially increased the glass internal surface temperature by more than 25ºC when used with high performance windows with low-e coating and argon gas fill. Large temperature differences (~30ºC) were also observed between the glass centre and its edge. Excessive glass temperatures and thermal stresses due to temperature differences between the centre and the edge of the glass are not desirable as the durability of the window components may be jeopardized (glass breakage, spacer seal, gas ex-filtration, etc.) if these components are not designed to withstand high temperatures.
OBJECTIVES
This work is part of a project aiming to develop guidelines for effective window solar shadings of Canadian houses when using:
• movable exterior shading devices;
• mid-pane blinds (blinds in-between the glass layers); • various interior reflective solar shading devices. The project will address the following issues:
• thermal peak loads and energy use for heating and cooling of Canadian houses; • energy costs and paybacks;
• occupant thermal and visual comfort;
• potential risk of condensation and thermal stresses on conventional and high performance windows;
• homeowners use of shading devices, types of controls involved, and how these factors affect the energy demand.
This report presents the results of three weeks of summer energy performance and thermal comfort of exterior operable insulating rollshutters. The main goal of the field measurements was to compare the cooling energy use and the occupant thermal comfort measured in a house equipped with exterior rollshutters versus similar performance metrics measured in a reference house equipped with interior Venetian blinds.
DESCRIPTION OF THE TEST-SITE
The study took place at the Canadian Center for Housing Technology (CCHT) facility located in Ottawa, Ontario, at the Montreal Road campus of the National Research Council Canada. Built in 1998, the facility is jointly operated by the National Research Council Canada (NRC), Natural Resources Canada (NRCan), and Canada Mortgage and Housing Corporation (CMHC). It features two side-by-side twin-houses as shown in Figure 1. The house on the right is used as a baseline (Reference House), while the house on the left is used for testing of advanced technologies (Test House). Both houses are two-storey high, have a total area of 210 m2 and replicate a popular model on the local residential market. They were built by a local builder according to the R-2000 standard, using regular construction technologies for the region.
Each house features 26 high performance double-glass windows with low-e coating, insulated spacer and 95% argon gas concentration, U-value = 1.65 W/m2K, SHGC = 0.72, and a north-facing glazed patio door with a total glass area of 24.14 m2. The windows are distributed as follows: 11 south-facing windows (10.22 m2); 12 north-facing windows (10.97 m2); one west-facing window (1.3 m2) and 2 east-facing windows (1.65 m2).
Both houses are equipped with a standard set of major appliances (stove, dishwasher, washer and dryer) typically found in North American homes. The houses are unoccupied but include a simulated occupancy system that reproduces the daily water draws and electrical loads of a family of four. The internal heat gains from the occupants are also simulated using two 60 W (2 adults) and two 40 W (2 children) incandescent bulbs distributed at various locations in each house. The houses employ high efficiency gas furnaces for heating, continuous flow heat recovery ventilators and programmable thermostats located in the central hallway on the main floor. The set point temperature for cooling is fixed at 24ºC. More details about the CCHT research center are available at: http://www.ccht-cctr.gc.ca/main_e.html.
DESCRIPTION OF THE SHADING DEVICES
For this project all windows of the Reference House were fitted with a mix of common interior horizontal Venetian blinds (on most windows) and vertical blinds (on patio glass door, dining room window and stairwell window). The slats of the Venetian blinds were slightly curved and made of aluminum with the following characteristics: slat spacing = 0.02 m, slat width = 0.025 m, slat visible reflectance = 63%. The vertical blinds were made of fabric with the following characteristics: slat spacing = 0.075 m, slat width =
0.090 m, slat visible reflectance = 71%. All interior blinds were mounted outside the window frames, leaving an open air space between the blinds and the wall incorporating the window frames.
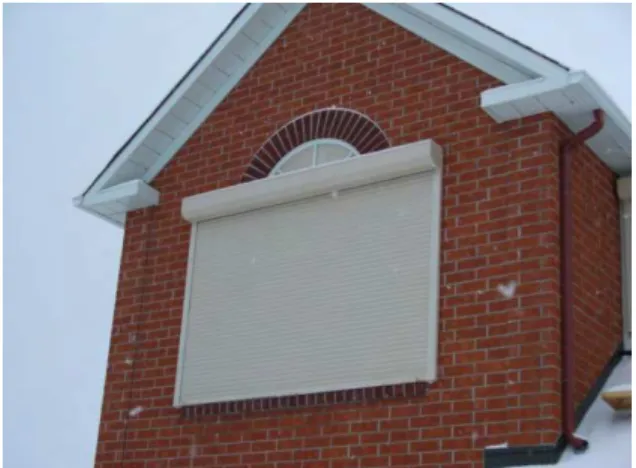
All windows of the Test House, except the east facing windows (which were kept identical to those in the Reference House) were fitted with movable rollshutters. The rollshutters were made of fixed and articulated painted aluminum slats (beige color) with a sandwiched polyurethane insulation and had the following characteristics: slat thickness = 0.006 m (with 0.004 m thick insulation), slat spacing = slat width = 0.038 m, and slat visible reflectance = 56%. The rollshutters were not designed to allow slat positioning and could only be adjusted up and down in the vertical plane of the window using side railings installed on the outside brick walls. A rubber gasket installed between the side railings and the walls sealed the air space between the shutters and windows. The bottom of the shutters was not, however, completely sealed to the window sill, and had a few holes to allow for water drainage. Figure 2 shows a rollshutter installed on the south-facing 2nd floor window in a closed position.
Figure 1 The Twin-House Facility of the Canadian Center for Housing Technology (CCHT); Test House (left); Reference House (right)
Figure 2 Close-up picture of a rollshutter on a south-facing Test House window
MEASUREMENT SETUP
Before the window shading summer experiments, the similarity between the two houses was verified through benchmarking tests conducted over a total of 18 discontinuous days between June 13 and July 27, 2008 with the houses in the same configuration. During the benchmarking tests, the windows in both houses were equipped with interior Venetian blinds with slats in an open horizontal position. The theoretical assumption was that if the houses were completely identical, they would use the same amount of daily energy for cooling. However, in reality, due to small differences between the houses and the impossibility of synchronizing the cooling equipment perfectly, the daily energy use of the two houses was expected to be slightly different. By comparing the houses’ energy performance on multiple days a realistic trend was established to indicate the performance of one house relative to the other. The summer benchmark correlation was used subsequently in the calculation of the energy savings generated by the exterior shading devices investigated in this study.
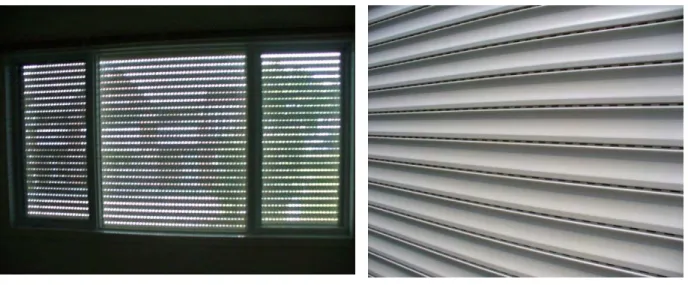
The summer shading measurements were conducted over a period of three weeks, from June 27 to July 21, 2008. The shading devices in both houses were closed at the beginning of the experiments and were left in a closed position until the end of the testing period as shown in Figures 3 and 4. The slats of the rollshutters were loosely closed, leaving the perforations between the slats open for a view of the outdoors when looking outside from the inside of the house as shown in Figures 5 and 6.
Figure 3 North façade of the Reference House (left) and Test House (right) during the summer shading
experiment. Shading devices were closed day and night.
Figure 4 South façade of the Test House (left) and Reference House (right) during the summer shading experiments. Shading devices were closed day and night.
Figure 5 View to outdoors through the perforations of a rollshutter installed in the Test House during the summer experiments
Figure 6 Outdoor close-up picture of a rollshutter during the summer experiments
The following performance indicators were measured in both houses:
AIR TEMPERATURE AND RELATIVE HUMIDITY MEASUREMENTS
As part of the regular instrumentation each house had a thermocouple and a relative humidity sensor located on the ground floor. An exterior thermocouple and a relative humidity sensor were also located on the north side of the Reference House to measure the outdoor conditions.
ELECTRICAL ENERGY AND GAS USE
The electrical energy use of the furnace circulation fan and the furnace gas use were measured in each house on a 5-minute basis by individual electric meters with pulse output at a resolution of 0.6 Wh/pulse
(2.0 Btu/pulse) and 1.4 L/pulse (0.05 ft3/pulse). Additional electric meters measured the energy use of the other electric end-users, including lights and appliances.
SOLAR RADIATION
Horizontal and south-facing vertical pyranometers were used to measure the horizontal and vertical global solar radiation (W/m2).
THERMAL AND AIR MEASUREMENTS NEAR WINDOWS
Conditions important for thermal comfort (air temperature and velocity, globe temperature and relative humidity) were measured at a distance of 1.2 m from the south-facing living room window and were used to calculate the predicted percentage of dissatisfied (PPD) index. This model is widely used and accepted in the design and field assessment of thermal comfort conditions and predicts the mean value of the thermal votes of a large group of people exposed to the same environment (ISO 7730, 1984; ANSI/ASHRAE 55-1992).
Globe temperature probes (for operative temperature measurements), thermocouples (for air temperature measurements) and hot wire anemometers (for air velocity measurements) were installed on a tripod at two occupant positions: seated, 0.6 m from floor, and standing, 1.1 m from floor. A horizontal illuminance meter was also used to measure daylight availability at a height of 0.6 m from the floor. The globe temperature measurements, which incorporated the effect of the transmitted solar radiation, were used to estimate the mean radiant temperature necessary in the calculation of the PPD index. An equivalent mean radiant temperature was defined to take into account this solar effect.
WINDOW AND SHADING TEMPERATURE
The south, west and north-facing windows in each house were equipped with thermocouples, which measured the surface temperature at one exterior location (center of glass), and four interior locations (center of glass, bottom/top edge of glass and sill). The thermocouples were secured to the windows and sill surfaces with conductive epoxy. Additional thermocouples were used for the south-facing windows on the ground floor, which measured the temperature of the interior blind slats, as well as the temperature on the inside and outside surfaces of the exterior rollshutters.
RESULTS
COOLING ENERGY USE
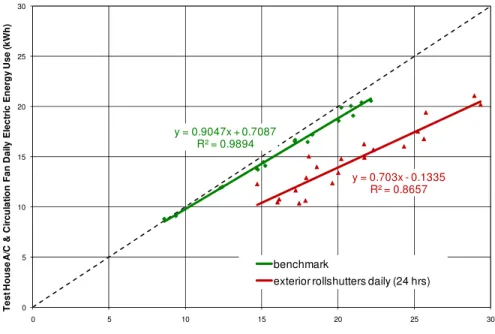
The summer cooling energy data was analyzed using a side-by-side method, which compares the energy use of the Test House versus the energy use of the Reference House. Figure 10 shows the daily electrical energy use of the air-conditioning (A/C) unit and the circulation fan collected during a 18–day summer benchmarking period when the houses were operated in an identical configuration, compared to the daily electrical energy use during the summer window shading measurements. Similarly, Figure 11 shows the daily energy use of the A/C units only (no circulation fans) during the two summer measurement periods.
During the summer benchmarking period, the maximum relative difference in daily electric energy used between the two houses was ~ 9%, and the average difference calculated across the 18-day benchmarking period was ~5%, with the Reference House using slightly more electric energy for cooling (A/C unit plus circulation fan) than the test house (16.6 kWh/day versus 15.7 kWh/day). The daily energy used by the A/C units was 20-30% lower than that required by the circulation fans. On average, the A/C unit of the Reference House used 7.3 kWh/day, whereas the circulation fan in the same house used 9.4
kWh/day. Similarly, the A/C unit of the Test House used 6.4 kWh/day, whereas the circulation fan used 9.3 kWh/day. Note, however, that the circulation fans operated continuously throughout the day regardless of the requirement for cooling, re-circulating the indoor air and fresh outdoor air supplied thorough a Heat Recovery Ventilator.
The energy savings from the rollshutters strategy were calculated to reflect for any given day the difference between the measured and the expected energy use of the Test House relative to the energy use of the Reference House calculated based on the summer benchmark correlation. Because the A/C units and the circulation fans had their own major share in the total daily energy used for cooling, the savings in A/C plus circulation fan energy use are presented separately from the savings in A/C only energy use.
The summer testing period comprised days with various sky conditions (7 clear sky, 3 overcast, 11 mixed partly cloudy/overcast), outdoor temperatures ranging from a minimum of +13ºC during night-time to a maximum +33ºC during daytime, and outdoor relative humidity levels between 32-99%.
Data shows that the rollshutters decreased the total (AC + circulation fan) daily energy use of the Test House on average by ~25±10% compared to the Reference House, and the daily energy used by the A/C unit of the Test House was on average 45% lower than that used by the A/C unit of the Reference House. The maximum difference in A/C daily energy use recorded was 72%, while the lowest difference was about 23%. The fact that the Test House consistently used less electric energy for cooling than the Reference House suggests that the exterior rollshutters were more effective in keeping the heat outside compared to the closed interior blinds.
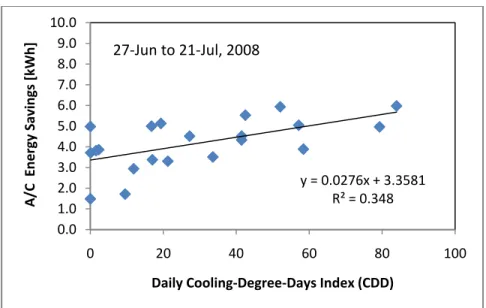
However, as shown in Figure 12 a strong correlation between the Test House daily A/C energy savings and the daily cooling-degree-day index (CDD) was not found. The daily CDD index was used as a measure of how warm each particular day was in terms of how many degrees that day’s hourly average temperatures were above 24°C (the indoor setpoint temperature for cooling). The daily CDD values shown in Figure 12 were calculated as the sum of the hourly CDD values measured for each particular day.
A stronger correlation was found between the Test House A/C daily energy savings and the daily total solar radiation incident on the south-facing façade as shown in Figure 13, indicating that the daily demand for cooling was rather dependent on the solar heat gains acquired through windows than on the outdoor temperature.
y = 0.9047x + 0.7087 R² = 0.9894 y = 0.703x - 0.1335 R² = 0.8657 0 5 10 15 20 25 30 0 5 10 15 20 25 30 Test H ouse A /C & C ir cul at io n Fa n D ai ly El ec tr ic Ener gy U se (k W h )
Reference House A/C & Circulation Fan Daily Electric Energy Use (kWh)
benchmark
exterior rollshutters daily (24 hrs)
Figure 10 Daily electric energy used by the CCHT Houses for cooling (A/C plus circulation fan)
y = 0.9145x - 0.2472 R² = 0.9894 y = 0.7019x - 2.1158 R² = 0.8737 0 5 10 15 20 25 30 0 5 10 15 20 25 30 Te st H o u se A /C D ai ly E le ct ri c E n er g y U se (k W h )
Reference House A/C Daily Electric Energy Use (kWh)
benchmark
exterior rollshutters daily (24 hrs)
y = 0.0276x + 3.3581 R² = 0.348 0.0 1.0 2.0 3.0 4.0 5.0 6.0 7.0 8.0 9.0 10.0 0 20 40 60 80 10 A/C En ergy Savings [kWh] Daily Cooling‐Degree‐Days Index (CDD) 0 27‐Jun to 21‐Jul, 2008
Figure 12 Correlation between the Cooling-Degree-Days Index and the daily savings in electric energy required for cooling (data shown relates to the energy use of the A/C unit of the Test House only; no circulation fan) y = 0.0004x + 1.2481 R² = 0.7931 0.0 1.0 2.0 3.0 4.0 5.0 6.0 7.0 8.0 9.0 10.0 0 2000 4000 6000 8000 10000 12000 14000 A/C En ergy Savings [kWh] Total solar radiation incident on the south‐facing wall [kJ/m^2/day] 27‐Jun to 21‐Jul, 2008
Figure 13 Correlation between the total daily solar radiation incident of the south-facing facade and the daily savings in electric energy required for cooling (data shown relates to the energy use of the A/C unit of the Test House only; no circulation fan)
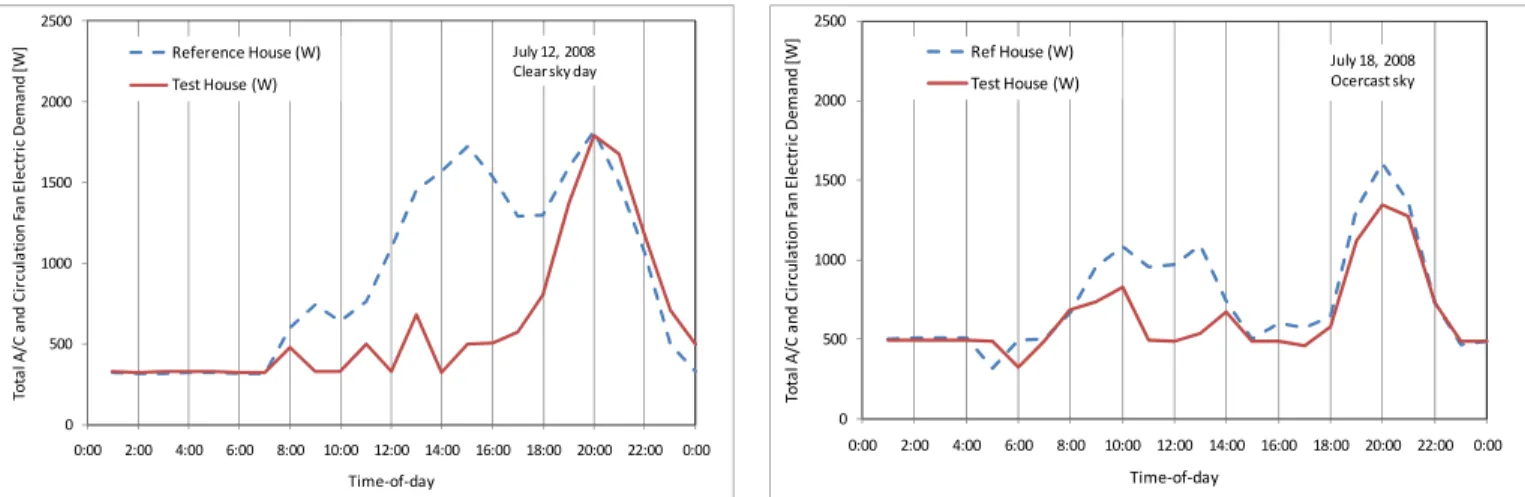
COOLING PEAK LOAD
were still an important 50% under a deeply overcast day. Calculated across the 21 days of the testing period, the daily maximum average reduction in electricity demand was 67%.
Figure 14 shows the hourly electricity demand profiles of the A/C units and circulation fans of the Test and Reference houses on two typical days, one sunny (July 12) and one overcast (July 18). Regardless of the sky condition, data shows that the daily electricity demand was greatly reduced in the house equipped with rollshutters compared to the house equipped with Venetian blinds. The maximum difference (80%) in electricity demand was recorded around 2 PM under a clear sky, while the savings
weekends and holidays. The electricity supply system needs to meet the demand on an instantaneous basis and larger quantities
time-of–use (TOU) pricing throughout the province, a process scheduled to be completed by the end of 2010. The TOU pricing
mand of the house equipped with Venetian blinds. By reducing the electricity demand during these critical times of the
ted occupancy system as shown in Figure 15. As mentioned, in order to obtain a more realistic energy balance of an occupied house, the heat load generated by the These results highlight an important benefit of the rollshutters strategy. Generally, electricity use is not constant throughout the day and the demand is higher on weekdays than during
of electricity need to be generated during the hours when the demand peaks. Particularly, peaks in electricity demand occur during heat-waves in the summer, especially during the mid- to late afternoon hours. In the last few decades, in the province of Ontario the electricity demand has also increased as more air conditioners were installed in both residential and business facilities.
In an effort to shift the load off the electricity supply system during high-demand hours , the Ontario Energy Board started the implementation of smart electricity meters and
structure takes into account the specific season (summer or winter), the specific day (weekday, weekends, holidays), as well as the specific period of the day when the electricity is used, defining these periods as: off-peak hours (low demand), mid-peak hours (moderate demand) and on-peak hours (high demand). All weekdays from May 1 to October 31 are part of the TOU summer pricing structure, with the period from 11am to 5pm being considered on-peak, the periods between 7am to 11am and 5pm to 10pm being mid-peak, and off-peak from 10pm to 7am. The current smart-meter TOU rates for the summer of 2008 are: 2.7/kWh (off-peak), 7.3c/kWh (mid-peak), and 9.3c/kWh (on-peak) (IESO, 2008).
As shown in Figure 14, during the TOU on-peak period, from 11am and 5pm, the electricity demand for cooling in the house equipped with rollshutters was 30 to 60% lower than the electricity de
day, not only the rollshutters strategy showed great potential in taking the strain off of the electricity supply system but would also reduce significantly the price of electricity for an end-user billed according to the smart-meter TOU pricing structure.
The peak in electricity demand for cooling seen on both days in Figure 14 around 8pm coincides with a peak in the internal heat load of the simula
household occupants was simulated through the use of 2x60 W (2 adults) and 2x40 W (2 children) incandescent bulbs distributed throughout the house at various locations and controlled on and off based on a daily schedule. The spike shown around 8pm in Figure 15 (simulating heat-gains from potential house visitors) seems to have affected the cooling requirements during the evening hours to a much higher extent than the daytime outdoor weather conditions and the solar heat gains accumulated through the windows. Note that the thermostat was not programmed based on the occupancy schedule and the cooling setpoint was kept constant at 24°C for the entire duration of the summer experiments. Additionally, the cooling requirements may have also peaked around 8pm due to the accumulated internal gains generated earlier in the evening by the houses’ appliances (e.g. stove, dishwasher, clothes washer, clothes dryer) also scheduled to turn on and off daily at various times after 6pm as shown in Figures 16 to 18.
0 500 1000 1500 2000 2500 0:00 2:00 4:00 6:00 8:00 10:00 12:00 14:00 16:00 18:00 20:00 22:00 0:00 To ta l A/ C an d Ci rc u la ti o n Fa n El e ct ri c De man d [W ] Time‐of‐day Reference House (W) Test House (W) July 12, 2008 Clear sky day 0 500 1000 1500 2000 2500 0:00 2:00 4:00 6:00 8:00 10:00 12:00 14:00 16:00 18:00 20:00 22:00 0:00 To ta l A/ C an d Ci rc u la ti o n Fa n El e ct ri c Dem a n d [W ] Time‐of‐day Ref House (W) Test House (W) July 18, 2008 Ocercast sky
Figure 14 Hourly electric demand profiles of the CCHT houses A/C units and circulation fans under a clear and an overcast sky
Figure 15 Hourly electric demand profiles of the CCHT
houses simulated “human” occupancy. Figure 16 Hourly electric demand profiles of the CCHT houses dishwasher.
Figure 17 Hourly electric demand profiles of the CCHT
clothes dryers. Figure 18 Hourly electric demand profiles of the CCHT houses clothes washers.
0 100 200 300 400 500 600 0:00 4:00 8:00 12:00 16:00 20:00 0:00 S im ul at ed o cc up an cy e le ct ri c de m and [W ] Time-of-day Reference House Test House 12-Jul-08 0 100 200 300 400 500 600 700 800 0:00 4:00 8:00 12:00 16:00 20:00 0:00 S im u la te d dis h w as h e r e le c tr ic d e m an d [ W ] Time-of-day Reference House Test House 12-Jul-08 0 500 1000 1500 2000 2500 3000 0:00 4:00 8:00 12:00 16:00 20:00 0:00 S im ul at ed cl ot h es dr ye r e le ct ri c de m and [ W ] Time-of-day Reference House Test House 12-Jul-08 0 50 100 150 200 250 300 350 400 450 500 0:00 4:00 8:00 12:00 16:00 20:00 0:00 S im u la te d cl o th es w ash er el ect ri c d em an d [W ] Time-of-day Reference House Test House 12-Jul-08
THERMAL AND AIR CONDITIONS NEAR WINDOWS
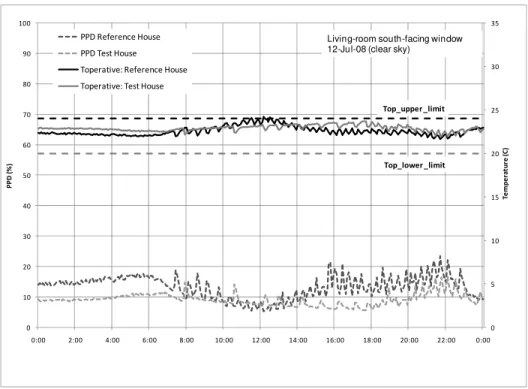
Figure 19 shows on the right hand axis the operative temperatures measured by the globe thermometers at a height of 0.6 m from the floor surface and at a distance of 1.2 m from the living-room south-facing window, along with the calculated PPD indexes (left hand axis) for a clear sunny day (July 12). The Top_lower_limit (20ºC ) and Top_upper limit (24ºC) are the comfort limits of the operative temperature as specified in the ISO 7730 (1984) standard. The PPD indexes were calculated for a sedentary person (household activity level = 1.2 met) wearing typical summer household clothing (clo=0.5). PPD values lower than 10% with a corresponding operative temperatures between 20ºC to 24ºC are considered by standards to be acceptable thermal environments (ISO 7730, 1984).
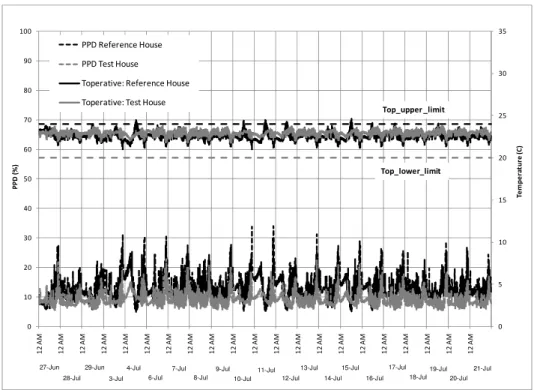
Data shows that during the summer experiments, the thermal comfort conditions near the south-facing living room window in the house equipped with rollshutters were slightly better than those measured in the house equipped with Venetian blinds, especially during night and evening hours. In both houses, the space operative temperatures were always within the comfort limits specified by the ISO 7730 standard and similar results were obtained for all the days in the summer testing period as shown in Figure 20. The PPD index in the Test House was mostly below 10% during both day and night-time, and only reached maximum values of 22% during some evening hours. However, in the Reference House the PPD index was mostly above 10% especially during night-time, reaching a maximum of 34% during the evening hours.
The internal window temperatures were similar in both houses during night-time, while during daytime, the window temperatures were 15-20ºC higher in the Reference House compared to the Test House. The interior temperature of the Venetian blinds were close to the room temperature (23-24ºC) during the night and evening hours, reaching temperatures above 30ºC during daytime.
0 5 10 15 20 25 30 35 0 10 20 30 40 50 60 70 80 90 100 0:00 2:00 4:00 6:00 8:00 10:00 12:00 14:00 16:00 18:00 20:00 22:00 0:00 Te m p e ra tu re (C ) PPD (% ) PPD Reference House PPD Test House Toperative: Reference House Toperative: Test House
Living-room south-facing window 12-Jul-08 (clear sky)
Top_upper _limit
Top_lower _limit
Figure 19 PPD indexes, operative temperature comfort limits and space operative temperatures for a clear sunny day at a height of 0.6 m from the floor surface and at a distance of 1.2 m from the living-room south-facing window
0 5 10 15 20 25 30 35 0 10 20 30 40 50 60 70 80 90 100 12 AM 12 AM 12 AM 12 AM 12 AM 12 AM 12 AM 12 AM 12 AM 12 AM 12 AM 12 AM 12 AM 12 AM 12 AM 12 AM 12 AM 12 AM 12 AM 12 AM 12 AM Te m p e rat u re (C ) PPD (% ) PPD Reference House PPD Test House Toperative: Reference House Toperative: Test House 27-Jun 28-Jul 29-Jun 3-Jul 4-Jul 6-Jul 7-Jul 8-Jul 9-Jul 10-Jul 11-Jul 12-Jul 13-Jul 14-Jul 15-Jul 16-Jul 17-Jul 18-Jul 19-Jul 20-Jul 21-Jul Top_upper _limit Top_lower_limit
Figure 20 PPD indexes, operative temperature comfort limits and space operative temperatures for all days in the summer testing period at a height of 0.6 m from the floor surface and at a distance of 1.2 m from the living-room south-facing window
CONCLUSIONS
This paper presents the results of summer field measurements conducted to assess the relative cooling energy performance of exterior shading devices versus typical interior blinds. Exterior insulating rollshutters and conventional Venetian blinds were installed on the windows of two side-by-side typical Canadian houses and measurements of electric energy use for cooling, as well as window surface temperatures and other conditions important for thermal comfort near windows were collected for three consecutive weeks in the summer.
Results showed that the daily total electric energy used by the air-conditioning unit and the circulation fan in the house equipped with rollshutters was 12-37% lower (average of 26%) than in the house equipped with interior blinds. The savings in daily energy use of the air-conditioning unit alone ranged between 23-72% (average of 45%). The rollshutters also reduced the hourly electricity demand for cooling by 50-80%, which not only diminished the strain on the electricity supply system but would also decrease significantly the price of electricity for an end-user billed according to the time-of-use pricing structure.
However, in spite of the benefits resulting from the use of rollshutters versus interior blinds, caution should be applied in using exterior shading devices in winter conditions where there is a risk of ice build-up that may lead to operating problems. There are no such operational risks in the summer, when the energy and peak-demand benefits are significant. Winter performance results of the rollshutters strategy presented in this paper are available in Laouadi et al., 2008.
REFERENCES
ANSI/ASHRAE Standard 55-1992, Thermal Environmental Conditions for Human Occupancy, Atlanta: American Society of Heating, Refrigeration and Air-Conditioning Engineers, 1992.
Galasiu, A.D.; Reinhart, C.F.; Swinton, M.C.; Manning, M.M. Assessment of Energy Performance of Window Shading Systems at the Canadian Centre for Housing Technology, Research Report, Institute for Research in Construction, National Research Council Canada, RR-196, 2005,
http://irc.nrc-cnrc.gc.ca/pubs/rr/rr196/
IESO, Independent Electricity System Operator,
http://www.ieso.ca/imoweb/siteShared/smart_meters.asp?sid=ic, August 2008.
ISO Standard 7730-1984, Moderate Thermal Environments – Determination of the PMV and PPD Indices and Specification of the Conditions for Thermal Comfort, International Organization for Standardization. Laouadi, A.; Galasiu, A.D.; Swinton, M.C.; Manning, M.M.; Marchand, R.G.; Arsenault, C.D.; Szadkowski, F. Field performance of exterior solar shadings for residential windows: winter results, IBPSA-Canada eSim Conference, Quebec City, May 20-21, 2008, pp. 1-8, ;
http://irc.nrc-cnrc.gc.ca/pubs/fulltext/nrcc50467/
Manning, M.M.; Swinton, M.C.; Ruet, K. Assessment of Reflective Interior Shades at the Canadian Centre for Housing Technology, B-6020, 2007, http://irc.nrc-cnrc.gc.ca/pubs/fulltext/b-6020/.
MINEFI, Document pour remplir la déclaration des revenus de 2005, Ministére de l’économie des Finances et de l’emploi, France, http://www2.finances.gouv.fr/calcul_impot/2006/pdf/form-2041-GR.pdf
Natural Resources Canada (NRCan), Energy Use Data Handbook, 1990 and 1998 to 2004, August 2006.
http://www.oee.nrcan.gc.ca/Publications/statistics/handbook06/pdf/handbook06.pdf
Swinton, M.C.; Moussa, H.; Marchand, R.G. Commissioning twin houses for assessing the performance of energy conserving technologies, Performance of Exterior Envelopes of Whole Buildings VIII Integration of Building Envelopes, 2001, http://irc.nrc-cnrc.gc.ca/pubs/fulltext/nrcc44995.
Tuaycharoen, N., Tregenza, P.R., View and discomfort glare from windows, Lighting Research and Technology, 39(2):185-200, 2007.
ACKNOWLEDGMENT
This work was supported by the Institute for Research in Construction of the National Research Council Canada (NRC-IRC), CETC Buildings Group of Natural Resources Canada (NRCan), Canada Mortgage and Housing Corporation (CMHC), Ontario Power Authority, Hydro Quebec, Gas Metro Quebec, Pilkington USA, Prelco Inc., Talius, and Lutron Electronics Corporation USA. The authors are very grateful for all these contributions and support. Thanks are also due to Ms. Emilie Thibault (NRC-IRC visiting student from France) for her assistance in the field implementation of the project.