Publisher’s version / Version de l'éditeur:
Vous avez des questions? Nous pouvons vous aider. Pour communiquer directement avec un auteur, consultez la
première page de la revue dans laquelle son article a été publié afin de trouver ses coordonnées. Si vous n’arrivez
Questions? Contact the NRC Publications Archive team at
[email protected]. If you wish to email the authors directly, please see the first page of the publication for their contact information.
https://publications-cnrc.canada.ca/fra/droits
L’accès à ce site Web et l’utilisation de son contenu sont assujettis aux conditions présentées dans le site
LISEZ CES CONDITIONS ATTENTIVEMENT AVANT D’UTILISER CE SITE WEB.
Research Report (National Research Council of Canada. Construction), 2015-06
READ THESE TERMS AND CONDITIONS CAREFULLY BEFORE USING THIS WEBSITE.
https://nrc-publications.canada.ca/eng/copyright
NRC Publications Archive Record / Notice des Archives des publications du CNRC : https://nrc-publications.canada.ca/eng/view/object/?id=4e2ffb56-76ee-4fc8-8c83-1a25a57aa5ec https://publications-cnrc.canada.ca/fra/voir/objet/?id=4e2ffb56-76ee-4fc8-8c83-1a25a57aa5ec
NRC Publications Archive
Archives des publications du CNRC
For the publisher’s version, please access the DOI link below./ Pour consulter la version de l’éditeur, utilisez le lien DOI ci-dessous.
https://doi.org/10.4224/21275887
Access and use of this website and the material on it are subject to the Terms and Conditions set forth at
Apparent sound insulation in concrete block buildings
Construction
RR-334
Apparent Sound Insulation
in Concrete Block Buildings
Berndt Zeitler, David Quirt, Stefan Schoenwald, Jeffrey Mahn
Page 2 of 125 Chapter 1: Sound Transmission via Many Paths
Overview
This report presents the results from two substantial experimental studies of sound transmission, together with an explanation of calculation procedures to predict the sound transmission between adjacent spaces in a building whose construction combines concrete block walls with other types of constructions.
Acknowledgements
The research studies on which this report is based were supported by the Canadian Concrete Masonry Producers Association.
Disclaimer
Although it is not repeated at every step of this report, it should be understood that some variation is to be expected in practice due to changing specific design details, poor workmanship, substitution of “generic equivalents” or simply rebuilding the construction.
Despite this caveat, the authors believe that methods and results shown here do provide a good estimate of the apparent sound insulation for the types of constructions presented.
1 Sound Transmission via Many Paths ... 4
1.1 Predicting Sound Transmission in a Building ... 6
1.2 Standard Scenario for Examples in this Report ... 7
1.3 Applying the Concepts of ISO Standards in an ASTM Environment ... 9
1.4 Combining Sound Transmitted via Many Paths ... 11
2 Sound Transmission Measurements for Concrete Block Walls ... 15
2.1 Concrete Block Walls without Gypsum Board Linings ... 18
2.2 Adding Linings on Concrete Block Masonry Walls Constructed with Normal Weight Units ... 22
2.3 Adding Linings on Concrete Block Masonry Walls Constructed with Lightweight Units ... 27
3 Flanking Sound Transmission Measurements with Concrete Block Walls ... 31
3.1 Concrete Block Walls with Wood-Framed Floors and Walls ... 33
3.2 Concrete Block Walls with Lightweight Steel-Framed Floors and Walls ... 40
3.3 Concrete Block Walls with Precast Floors ... 40
4 Predicting Sound Transmission in Buildings ... 41
4.1 Scenarios for Concrete Block Walls with Structural Concrete Floors ... 42
4.1.1 Loadbearing Normal Weight Concrete Block Walls with Concrete Floors ... 46
4.1.2 Non-Loadbearing Normal Weight Concrete Block Walls with Concrete Floors ... 63
4.1.3 Non-Loadbearing Lightweight Concrete Block Walls with Concrete Floors ... 83
4.2 Scenarios for Concrete Block Walls with Wood-Framed Floors and Walls... 101
4.3 Scenarios for Concrete Block Walls with Steel-Framed Floors and Walls ... 113
4.4 Scenarios for Concrete Block Walls with Precast Concrete Floors ... 113
5 Appendices of Sound Transmission Data ... 114
Appendix A1: Concrete Block Walls with and without Linings ... 115
Appendix A2: Concrete Block Walls with Wood-Framed Floors and Walls ... 120
Appendix A3: Concrete Block Walls with Steel-Framed Floors and Walls ... 120
Appendix A4: Concrete Block Walls with Precast Concrete Floors ... 120
6 References ... 121
Page 4 of 125 Chapter 1: Sound Transmission via Many Paths
1 Sound Transmission via Many Paths
The simplest approach to sound transmission between adjacent rooms in buildings considers only the sound transmission through the wall or floor that separates the adjacent spaces. This perspective has been entrenched in North American building codes, which for many decades have considered only the ratings for the individual separating assembly: Sound Transmission Class (STC) or Field Sound Transmission Class (FSTC) for airborne sources or Impact Insulation Class (IIC) for footstep noise.
Implicit in this approach is the simplistic assumption (illustrated in Figure 1.1) that sound is transmitted only through the obvious separating assembly—the separating wall assembly when the rooms are side-by-side, or the floor/ceiling assembly when rooms are one-above-the-other. If the sound insulation is inadequate, this is ascribed to errors in either design of the separating assembly or the workmanship of those who built it, and remediation focuses on that assembly. Unfortunately, this paradigm is still common among designers and builders in North America. In reality, the technical issue is more complex, as illustrated in Figure 1.2.
Figure 1.1: The drawings in Figure 1.1 and 1.2 show
a cross-section through a building with two adjacent rooms. Part of the sound from an airborne source in one unit (represented by red loudspeaker in the drawings, which could include anything from a home theatre to people talking loudly) is transmitted to the adjacent unit. The historic approach, illustrated in Figure 1.1, considers only the direct sound transmission through the separating assembly.
Figure 1.2: In reality, there are many paths for
sound transmission between adjacent rooms, including both direct transmission through the separating assembly and indirect structure-borne paths, a few of which are indicated here. (See Section 1.4 for more detail.) The structure-borne paths usually significantly affect the overall sound transmission.
There is direct transmission of sound through the separating assembly, but as Figure 1.2 shows, that is only part of the story. The airborne sound source excites all the surfaces in the source space and all of these surfaces vibrate in response. Some of this vibrational energy is transmitted as structure-borne sound across the surfaces abutting the separating assembly, through the junctions where these surfaces join the separating assembly and into surfaces of the adjoining space, where a part of the vibrational energy is radiated as sound. This is called flanking sound transmission.
It follows that the sound insulation between adjacent rooms is always worse than the sound insulation provided by just the obvious separating assembly. This is because the occupants of the adjacent room actually hear the combination of sound due to direct transmission through the separating assembly and any leaks, plus sound due to structure-borne flanking transmission involving all the other elements coupled to the separating assembly.
Transmission through wall Airborne Sound Source Separating assembly Transmission through wall Airborne Sound Source Separating assembly Flanking Transmission via ceiling surfaces Transmission through wall Airborne Sound Source Flanking Transmission via floor surfaces Flanking Transmission
via ceiling surfaces Transmission through wall Airborne Sound Source Flanking Transmission via floor surfaces
Of course, this has long been recognized in principle and the fundamental science was largely explained decades ago, with key contributions made by Cremer and Heckl (1), Gerretsen (2,3) and Craik (4), among others. The challenges for being able to predict the structure-borne flanking transmission have been to reduce the complicated calculation process to manageable engineering that yields trustworthy quantitative estimates, and to standardize that process to facilitate its inclusion in a regulatory framework.
For design or regulation, there is a well-established terminology to describe the overall sound transmission including all paths between adjacent rooms. ISO ratings such as the Weighted Apparent Sound Reduction Index (R’w) have been used in many countries for decades, and ASTM has recently
defined the corresponding Apparent Sound Transmission Class (ASTC), which is used in examples in this Report.
While measuring the ASTC rating in a building (following ASTM Standard E336 (5)) is quite straightforward, predicting the ASTC rating due to the set of transmission paths in a building is more complex. However, standardized frameworks for calculating the overall sound transmission have been developed. These calculations use standardized measurements to characterize the sub-assemblies (walls, floors, junctions) as inputs to empirical calculations of the sound insulation between rooms. In 2005, ISO published a calculation method, ISO 15712-1:2005, “Building acoustics — Estimation of acoustic performance of buildings from the performance of elements — Part 1: Airborne sound insulation between rooms” (6). This is one part of a series of standards: Part 2 (7) deals with “impact sound insulation between rooms”, Part 3 (8) deals with “airborne sound insulation against outdoor sound” and Part 4 (9) deals with “transmission of indoor sound to the outside.” The ISO 15712 series was originally prepared by the European Commission for Normalization (Committee CEN/TC 126) as EN 12354:2000 (10). The EN 12354 standards have been used for more than a decade to support performance-based European code systems, and they were subsequently adopted as ISO standards without modification by Technical Committee ISO/TC 43/2.
However, there are two significant impediments to applying the methods of ISO 15712-1:2005 in a North American context:
• ISO 15712-1 provides very reliable estimates for some types of construction, but not for the lightweight framed construction widely used for low-rise and mid-rise buildings in North America. • ISO standards for building acoustics have differences from the ASTM standards used by the
construction industry in North America – both in their terminology and in specific technical requirements for measurement procedures and ratings.
The following sections of this chapter outline a strategy for dealing with these limitations, both explaining how to merge ASTM and ISO test data and procedures, and providing recommendations for adapting the calculation procedures for common types of construction.
This Report was developed in a project established by the National Research Council of Canada to support transition of construction industry practice to using the ASTC rating rather than the STC rating for sound control objectives in the National Building Code of Canada (NBCC). However the potential range of application goes beyond the minimum requirements of the NBCC – the Report also facilitates design to provide enhanced levels of sound insulation, and should be generally applicable to construction in both Canada and the USA.
Page 6 of 125 Chapter 1: Sound Transmission via Many Paths
1.1 Predicting Sound Transmission in a Building
As noted in the previous section, ISO 15712-1:2005 provides reliable estimates of sound transmission for buildings with structural concrete floors and walls of concrete masonry (constructed with normal weight or lightweight units) or concrete, but it is less accurate for other common types of constructions, especially lightweight wood frame and steel frame constructions.
ISO 15712-1:2005 has other limitations, too. For example, in several places (especially for light frame construction) the ISO standard identifies situations where the detailed calculation is not appropriate, but does not provide specific guidance on how to deal with such cases. Many of these limitations can be overcome by using data from laboratory testing made according to the ISO 10848 series of standards (11–14). The four parts of ISO 10848 were developed by working groups of ISO TC 43/2 to deal with measuring flanking transmission for various combinations of construction types and junctions. Because the current (2005) edition of ISO 15712-1 replicates a European standard developed before 2000, it does not reference the more recent standards such as the ISO 10848 series or the ISO 10140 series (15–19) that is replacing the current ISO 140 series referenced in ISO 15712-1.
To work around these limitations, and to provide more guidance to users on how to use this calculation procedure for specific situations, this Report presents an approach suited to each type of construction:
• For types of construction where the calculation procedure of ISO 15712-1 is appropriate, this Report outlines the steps of the standardized calculation process. In order to respect copyright, the Report does not reproduce the equations of ISO 15712-1, but it does indicate which equations apply in each context and provides key adaptations of the ISO expressions;
• For types of construction where the calculation procedure of ISO 15712 is not appropriate, this Report presents an alternative approach which is based on experimental data obtained using the ISO 10848 series of standards for laboratory measurement of flanking transmission. The approach combines the sound power due to direct and flanking transmission in the same way as ISO 15712-1, as described in Section 1.4 of this Report.
The appropriate calculation process to be used depends on the type of wall and floor constructions to be combined with the concrete block walls to form a complete building as well as the details of junctions by which they are connected. For this reason, Chapter 4 is divided into sections which describe the suitability for the combination of concrete block walls with other constructions:
• concrete masonry walls with concrete floors in Chapter 4.1,
• concrete masonry walls with lightweight wood-framed walls and floors in Chapter 4.2, • concrete masonry walls with lightweight steel-framed walls and floors in Chapter 4.3, • concrete masonry walls with precast concrete floors in Chapter 4.4.
In all cases, the masonry walls may be constructed from normal weight or lightweight concrete block masonry units.
1.2 Standard Scenario for Examples in this Report
When dealing with the prediction of sound transmission between adjoining spaces in a building, as described in the previous section, the predicted attenuation for the various paths depends not just on the constructions involved, but also on the size and shape of each of the room surfaces as well as on the sound absorption in the receiving room. The ability to adjust the calculation to fit the dimensions in a specific building or to normalize to different receiving room conditions enables a skilled designer to obtain more accurate predictions.
However, for purposes of this Report where results will be presented for a variety of constructions in Chapter 4, easy and meaningful comparison of results is facilitated by calculating all the examples for a common set of room geometries and dimensions and using a consistent rating (ASTC) to describe the overall system performance. There are many pairs of examples in the following sections where such comparisons are instructive. This is particularly useful where only one part of the construction is changed from one example to another, since the construction change can be unequivocally related to the change in predicted ASTC rating.
Hence a Standard Scenario has been used for all the examples. The Standard Scenario includes:
• two adjacent rooms that are mirror images of each other, with one side of the separating assembly facing each room, and constituting one complete face of each rectangular room;
• pairs of rooms that are either side-by-side (illustrated in Figure 1.3) or one-above-the-other (illustrated in Figure 1.4).
Figure 1.3:
Standard Scenario for “horizontal room pair” case where the pair of rooms are side-by side with a separating wall assembly between the two rooms
Page 8 of 125 Chapter 1: Sound Transmission via Many Paths
between the two rooms
The pertinent dimensions and junction details (as shown in Figures 1.3 and 1.4) are:
• For horizontal room pairs (i.e. rooms are side-by-side) the separating wall is 2.5 m high by 5 m wide, the flanking floor/ceilings are 4 m by 5 m and the flanking walls are 2.5 m high by 4 m wide. • For vertical room pairs (i.e. one room is above the other) the separating floor/ceiling is 4 m by
5 m wide and the flanking walls in both rooms are 2.5 m high.
• In general, it is assumed that the junctions at one side of the room (at the separating wall if rooms are side-by-side) are cross junctions, while one or both of the other two junctions are T-junctions. This enables the examples to illustrate the typical differences between the two common junction cases.
• For a horizontal pair, the separating wall has T-junctions with the flanking walls at both the façade and corridor sides and cross junctions at the floor and ceiling.
• For a vertical pair, the façade wall has a T-junction with the separating floor, but the opposing corridor wall has a cross junction, as do the other two walls.
In a building, cases with cross junctions at separating walls on either side and at the corridor side seem quite common, and deviations from this Standard Scenario, such as pairs where one is an end unit, should tend to give slightly higher ASTC ratings.
Figure 1.4:
Standard Scenario for “vertical room pair” case where one of the pair of rooms is above the other, with a floor/ceiling assembly between the two rooms
1.3 Applying the Concepts of ISO Standards in an ASTM Environment
Although the building acoustics standards developed by ASTM Committee E33 are very similar in concept to the corresponding standards developed by ISO TC 43/2, they do present numerous barriers to using a mix of standards from the two domains due to both differences in terminology and the different technical requirements for some of the measurement procedures and ratings.
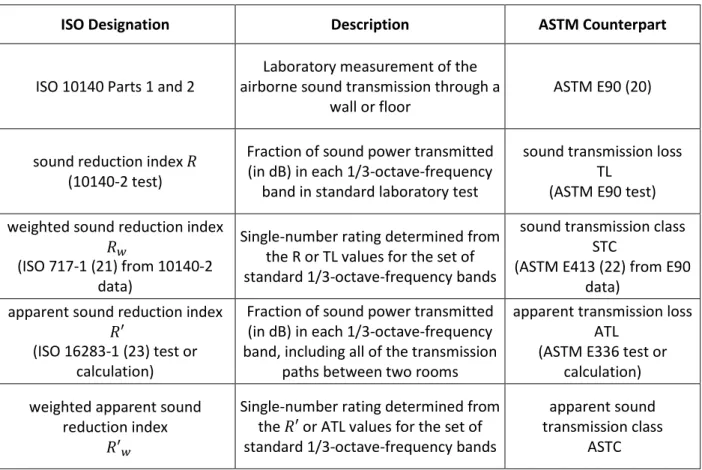
Even though the ASTM standard E336 recognizes the contribution of flanking to the apparent sound transmission, there are no ASTM standards for measuring the structure-borne flanking transmission that often dominates sound transmission between rooms. Nor is there an ASTM counterpart of ISO 15712-1 for predicting the combination of direct and flanking transmission. In the absence of suitable ASTM standards, this Report uses the procedures of ISO 15712-1 and data from the complementary ISO 10848 measurement standards for some constructions, but connects this ISO calculation framework to the ASTM terms and test data which are widely used by the North American construction industry. To facilitate the use of ISO calculation procedures as well as an understanding by a North American audience, this Report both identifies where data from ASTM laboratory tests can reasonably be used in place of their ISO counterparts and presents the results using ASTM terminology (or new terminology for flanking transmission that is consistent with existing ASTM terms). Some obvious counterparts are shown in Table 1.1, and a detailed lexicon of the ISO terms is given in ISO 15712-1:2005.
Table 1.1: Key standards and terms used in ISO 15712-1 for which ASTM has close counterparts
ISO Designation Description ASTM Counterpart
ISO 10140 Parts 1 and 2
Laboratory measurement of the airborne sound transmission through a
wall or floor
ASTM E90 (20)
sound reduction index � (10140-2 test)
Fraction of sound power transmitted (in dB) in each 1/3-octave-frequency
band in standard laboratory test
sound transmission loss TL
(ASTM E90 test) weighted sound reduction index
��
(ISO 717-1 (21) from 10140-2 data)
Single-number rating determined from the R or TL values for the set of standard 1/3-octave-frequency bands
sound transmission class STC
(ASTM E413 (22) from E90 data)
apparent sound reduction index �′
(ISO 16283-1 (23) test or calculation)
Fraction of sound power transmitted (in dB) in each 1/3-octave-frequency band, including all of the transmission
paths between two rooms
apparent transmission loss ATL
(ASTM E336 test or calculation) weighted apparent sound
reduction index �′�
Single-number rating determined from the �′ or ATL values for the set of standard 1/3-octave-frequency bands
apparent sound transmission class
ASTC
Note that for this description, “counterpart” does not imply the ASTM and ISO standards or terms are exactly equivalent, but in most cases they are very similar. The laboratory test procedures used to
Page 10 of 125 Chapter 1: Sound Transmission via Many Paths
measure the airborne sound transmission through wall or floor assemblies – ASTM E90 and its ISO counterpart ISO 10140-2 – are based on essentially the same procedure with minor variants in test requirements. Hence, the measured quantities “airborne sound transmission loss” from the ASTM E90 test and “sound reduction index” from the ISO standards are sufficiently similar so that data from ASTM E90 measurements can be used in place of data from ISO 10140-2 in the calculations of ISO 15712-1 to obtain a sensible answer. Similarly, the simplified calculation of ISO 15712-1 may be performed using STC ratings to predict the ASTC ratings. But, RW and STC are not interchangeable. Neither are R’W and
ASTC because of significant differences in the calculation procedures. The close parallel between “sound reduction index” and “sound transmission loss” also means that results from ISO 15712-1 calculation (normally expressed as R’ values) can confidently be treated as the calculated Apparent Transmission Loss (ATL) values and then processed according to ASTM 413 to calculate the ASTC rating which is the suggested objective for designers or regulators in the North American context.
A glossary of additional new terms is presented in Table 1.2.
Table 1.2: Key terms used in this Report to deal with concepts from ISO 15712-1 and ISO 10848 for
which ASTM has no counterparts
Other Terms used in this Report Description
Structural reverberation time
Structural reverberation time (TS) is a measure indicating the rate of
decay of structural vibration in an assembly and can apply either to a laboratory wall or floor specimen, or to a wall or floor assembly in-situ in a building.
Transmission loss in-situ
Transmission loss in-situ is the counterpart of sound reduction index in-situ (Rsitu) described in ISO 15712 as "the sound reduction index of
an element in the actual field situation". For the detailed calculation of ISO 15712, this depends on structural reverberation time of the element (wall or floor assembly) in the laboratory and in-situ.
Vibration reduction index
Vibration reduction index (Kij) is described in ISO 15712 as
"direction-averaged vibration level difference over a junction, normalised to the junction length and the equivalent sound absorption length to make it an invariant quantity". For practical application, a value of Kij may
be determined using equations in Annex E of ISO 15712-1 or the measurement procedures of ISO 10848.
Junction velocity level difference
Junction velocity level difference (JVLD) is described in ISO 15712 as "junction velocity level difference in-situ between an excited element (wall or floor) and the receiving element (wall or floor)". It is calculated by correcting Kij to allow for edge losses (identified
through structural reverberation times) of the assemblies in-situ.
Flanking transmission loss
Flanking transmission loss (Flanking TL) is the counterpart of flanking sound reduction index (Rij) in ISO 15712. It is a measure of sound
transmission via the flanking path from element i in the source room to element j in the receiving room, normalised like apparent sound transmission loss and ASTC, and is described in detail in Section 1.4. Flanking STC
Flanking STC is the single number rating calculated following the STC-calculation procedure of ASTM E413, using values of the flanking transmission loss for one flanking path as the input data.
The terms in the table have counterparts in ISO 15712-1 (using terminology consistent with measures used in ASTM standards) and pertinent ISO standards such as ISO 15712 and ISO 10848.
In addition, several scientific terms used in ISO-15712 at various stages of the calculation have been used without change. These terms include: radiation efficiency, internal loss factor, total loss factor, equivalent absorption length and transmission factor. The terms are described for this context in the glossary in Annex A of ISO 15712-1.
1.4 Combining Sound Transmitted via Many Paths
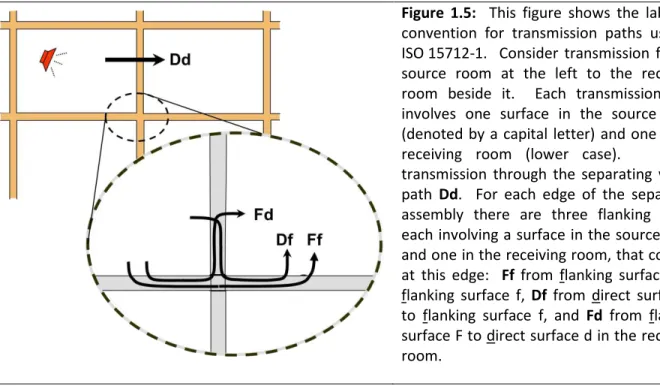
The calculations of ISO 15712-1 must deal with the combination of the sound power transmitted via the direct path as well as a set of flanking paths. To discuss this, it is useful to introduce the convention for labelling the transmission paths that is used in ISO 15712-1, as explained in Figure 1.5.
Figure 1.5: This figure shows the labelling
convention for transmission paths used in ISO 15712-1. Consider transmission from a source room at the left to the receiving room beside it. Each transmission path involves one surface in the source room (denoted by a capital letter) and one in the receiving room (lower case). Direct transmission through the separating wall is path Dd. For each edge of the separating assembly there are three flanking paths, each involving a surface in the source room and one in the receiving room, that connect at this edge: Ff from flanking surface F to flanking surface f, Df from direct surface D to flanking surface f, and Fd from flanking surface F to direct surface d in the receiving room.
Note that the letter “F” or “f” denotes flanking surface, and “D” or “d” denotes the surface for direct transmission, i.e. the surface of the separating assembly. These surfaces may be either wall or floor/ceiling assemblies, as detailed in the following Table 1.3. These labels and their use will become more obvious in the calculation examples in Chapter 4 of this Report.
Page 12 of 125 Chapter 1: Sound Transmission via Many Paths
Table 1.3: Surfaces (D, d, F and f) for flanking paths at each junction, as applied in the examples using
the Standard Scenario presented in Section 1.2 of this Report. Related drawings are shown in Figures 1.3 and 1.4.
Room Pair Surfaces D and d Flanking Surfaces F and f Junction
(Standard Scenario)
Horizontal
(Fig. 1.3) Separating wall
Junction 1: floor F and f Junction 2: façade wall F and f Junction 3: ceiling F and f Junction 4: corridor wall F and f
Cross junction T-junction Cross junction T-junction Vertical
(Fig. 1.4) Separating floor/ceiling
Junction 1: wall F and f
Junction 2: façade wall F and f Junction 3: wall F and f
Junction 4: corridor wall F and f
Cross junction T-junction Cross junction Cross junction
In Canada, building elements are normally tested according to the ASTM E90 [1] standard, and as of the 2015 revision of the NBCC, the building code requirements are given in terms of the Apparent Sound Transmission Class (ASTC) which is determined according to ASTM E413 from the apparent sound transmission loss (ATL) for the set of 1/3 octave bands from 125 to 4000 Hz. Merging this context with the ISO procedures of ISO 15712-1, the terms “direct sound transmission loss” and “flanking sound transmission loss” have been introduced to provide consistency with the ASTM terminology while matching the function of the direct and flanking sound reduction index (as defined in ISO 15712-1), in keeping with the discussion of terms in Section 1.3.
Section 4.1 of ISO 15712-1 defines a process to calculate the apparent sound transmission by combining the sound power transmitted via the direct path with that transmitted via the twelve first-order flanking paths (three paths at each edge of the separating assembly, as illustrated in Figure 1.5). Equation 14 in ISO 15712-1 is recast here with a slightly different grouping of the paths (treating the set of paths at each edge of the separating assembly in turn) to match the presentation approach chosen for the examples in this Report.
The Apparent Sound Transmission Loss (ATL) between two rooms (assuming the room geometry of Section 1.2 and neglecting the sound that by-passes the building structure, e.g. leaks, ducts,…) is the resultant of the direct sound transmission loss (TL��) through the separating wall or floor element and the set of flanking sound transmission loss contributions (TL��, TL��, and TL��) of the three flanking
paths for every junction at the edges of the separating element (as shown in Fig. 1.5) such that:
��� = −10 ∙ log10 �10−0.1∙����+ � �10−0.1∙����+ 10−0.1∙���� + 10−0.1∙����� 4
����=1
� Eq. 1.1 Eq. 1.1 is universally valid for all building systems, and the remaining challenge is to find the right expressions to calculate the path transmission for the chosen building system and situation.
The most suitable method to calculate the values for direct transmission or flanking transmission for each path in Eq. 1.1 depends on the type of wall and floor constructions to be combined with the concrete block walls to form the complete building. For this reason, Chapter 4 (which presents the
calculation methods and examples) is divided into the following sections suitable for the combination of concrete block walls with other constructions:
• concrete masonry walls with concrete floors in Chapter 4.1
• concrete masonry walls with lightweight wood-framed walls and floors in Chapter 4.2 • concrete masonry walls with lightweight steel-framed walls and floors in Chapter 4.3 • concrete masonry walls with precast concrete floors in Chapter 4.4
Each of the flanking sound transmission loss values for a specific path is normalized to nominal room absorption like the apparent sound transmission loss, and can be considered as the ATL that would be observed if only this single path were contributing to the sound transmitted into the receiving room. Normalization of direct and flanking transmission input data to the case where receiving room absorption is numerically equal to the area of the separating assembly (i.e. using the apparent sound transmission loss and the ASTC rating as the measure of system performance) requires suitable corrections in the calculations of ISO 15712-1, or values of flanking transmission loss from laboratory testing according to ISO 10848, so that the set of path transmission loss values can be properly combined or compared. This normalization process is included in the calculation procedures in each section of Chapter 4.
The examples presented in this report use the Simplified Method of ISO 15712-1 to calculate the ATL. The Simplified Method uses the single-number ratings (STC or Flanking STC for each transmission path) as the values for each path transmission loss (����, ����, ���� or ���� ) in Equation 1.1 such that: ���� = −10 log10�10−0.1⋅����� +�4 �10−0.1⋅�����+ 10−0.1⋅�����+ 10−0.1⋅������
����=1 � Eq. 1.2
Where:
(a) In this adaptation of the Simplified Method, the Apparent Sound Transmission Class (ASTC) is substituted for the ATL in Eq. 1.1.
(b) The direct path ����� is obtained from the laboratory measured STC rating of the bare element and the ∆STC changes due to linings on source “D” and/or receiving side “d” of the separating assembly such that:
����� =������+���(����,����) +���(����,����)
2 Eq. 1.3
(c) The flanking STC for each path ����� is calculated such that: �����=���2�+���2�+���+��������,����� +��������
,�����
2 + 10 log10�
��
������ Eq. 1.4
where the indices i and j refer to the coupled flanking elements. Therefore, “i” can either be “D” or “F” and “j” can be “f” or ”d”. The geometric correction factor at the end of Eq. 4.1.3 depends on the surface area of the separating assembly (��), the length of the junction between flanking and separating elements (���) and the reference length �0 = 1 m.
Page 14 of 125 Chapter 1: Sound Transmission via Many Paths
The Simplified Method has been widely used by designers in Europe for many years for calculations based on RW data. The primary advantage of the Simplified Method is the simplicity of the procedure,
which makes it usable by non-specialists, as illustrated by the worked examples in Chapter 4. Although it is less rigorous than the Detailed Method presented in ISO 15712-1 and Guide RR-331 (24), in most cases, the differences between the results of the two methods have been found to be small, and the calculations use approximations that should ensure the results are conservative (lower ASTC values than using the Detailed Method of calculating the ASTC).
Note that this report provides both the data to perform the calculations by the Simplified Method (in tables in Chapters 2 and 3) and the data needed to perform calculations using the Detailed Method (in the Appendices).
The set of path TLs used in Equations 1.1 and 1.2 is less general than the corresponding list of transmission factors in ISO 15712-1 so as to reflect the simplifications due to the Standard Scenario (see Section 1.2 above) and some further simplifications noted in the following cautions.
Cautions and limitations to examples presented in this Report:
This Report was developed to support a proposed transition to ASTC ratings for sound control objectives of the National Building Code of Canada, and simplifications were made in the presentation to meet the specific needs of that application, where sound insulation is addressed only in the context of multi-unit residential buildings. The simplifications include that:
• Transmission around or through the separating assembly, due to leaks at its perimeter or penetrations such as ventilation systems, are assumed to be negligible (and lumped in the rated value for ����
).
• Indirect airborne transmission (for example airborne flanking via an unblocked attic or crawl space) is assumed to be suppressed by normal fire blocking requirements.
However, for adjacent occupancies in a multi-family residential building, these issues should be dealt with by normal good practice for fire and sound control between adjoining dwellings.
If this Report is applied to situations other than the separation between adjacent units in multi-family residential buildings, some of these issues may have to be explicitly addressed in the calculation process. For example, for adjoining rooms within a single office or home, flanking paths such as ventilation ducts or open shared plenum spaces may be an issue. The flanking transmission associated with these additional paths should be determined and included in the calculated ASTC rating. ISO 15712-1 includes specific guidance for such issues.
2 Sound Transmission Measurements for Concrete Block Walls
This chapter presents the results of experimental testing of a series of concrete block walls of several types, including walls with a wide variety of linings covering one or both surfaces of the wall specimen. Testing was conducted according to the ASTM E90 test protocol [1] for direct airborne sound transmission testing of walls or floors, in the NRC’s Wall Sound Transmission Test Facility. The facility conforms to all of the facility requirements of ASTM E90, see more details in Appendix A. Full scale wall assemblies were placed in a testing frame with a test opening 3.66 m wide and 2.44 m high, between two decoupled rooms with volumes of approximately 250 m3 and 140 m3 (designated “large chamber” and “small chamber,” respectively). A concept drawing of the NRC Wall Sound Transmission Facility is shown in Figure 2.1. The facility was equipped with an automated sound and measurement system for data acquisition and post processing. Sound transmission loss was measured in both directions – from the large chamber to the small chamber and vice-versa – and results were averaged to reduce measurement uncertainty due to factors such as calibration errors.
Figure 2.1:
A concept drawing of the Wall Sound Transmission Facility at the NRC. The wall specimen was mounted in the movable test frame between two decoupled reverberant rooms.
The frequency dependent sound transmission loss was measured for all assemblies in 1/3-octave bands over an extended frequency range from 31.5 Hz to 10 kHz, although only a limited subset of these is considered in the calculation of the Sound Transmission Class (STC). Note that:
• The set of transmission loss results from 50 Hz to 5000 Hz is presented in Appendix A1.
• This chapter presents a more compact summary of results in terms of the single-number ratings required for the calculations in Chapter 4 to determine the ASTC rating between adjacent spaces in a building.
Large Chamber
Small Chamber
Page 16 of 125 Chapter 2: Sound Transmission Measurements for Concrete Block Walls
It is common practice, especially in residential buildings, to add finishing surfaces to the basic structural masonry or concrete wall assemblies (for example, gypsum board wall and ceiling surfaces that conceal both the bare concrete surfaces and building services such as electrical wiring, water pipes and ventilation ducts). The finish commonly comprises gypsum board panels, framing used to support them, and often sound absorptive material filling the inter-stud cavities between the gypsum board and the face of the concrete blocks. These elements are described in ISO 15712-1 as “linings” or “liners” or “layers” or “coverings”. The first term - “linings”- is used in this Report.
To characterize the change in the sound transmission loss due to adding a specific lining to a heavy base wall (a concrete block wall in this case), a single number rating called ΔSTC is introduced.
ASTM does not define such a rating, but there is a counterpart, ΔRW in the ISO standards (Annex B of
ISO 140-16) and it is a required input for the Simplified Method of ISO 15712-1 presented in Chapter 4. The procedure used in this Report follows that of ISO 140-16 (25) with the STC calculation substituted for the ISO single-number rating calculation, plus additional Steps 4 and 5 as discussed on the next page. The procedure to calculate ΔSTC values for the Simplified Method of ISO 15712-1 (used in Chapter 4) uses Reference Curve B.1 from ISO 140-16 (shown in Fig. 2.2) – a smoothed sound transmission loss curve typical of a heavy wall of masonry.
Figure 2.2:
Reference curve for the calculation of ΔSTC
Reference Curve B.1 from Annex B of ISO 140-16,
for a “Basic wall with low coincidence frequency”
which is appropriate for heavy masonry walls
f Hz R dB 50 35.3 63 37.3 80 39.4 100 40.0 125 40.0 160 40.0 200 40.0 250 41.0 315 43.5 400 46.1 500 48.5 630 51.0 800 53.6 1000 56.0 1250 58.4 1600 61.1 2000 63.6 2500 65.0 3150 65.0 4000 65.0 5000 65.0
f
Determining the Single Number Rating ΔSTC for Added Linings
The procedure presented here for calculating the ΔSTC is a subset of a more general set of procedures presented in Report RR-331. Values of the ΔSTC calculated from the experimental data in this Report are presented in Tables 2.2.2 and 2.3.2. Readers of this report can simply use the tabulated ΔSTC values without the need to perform the calculations detailed here.
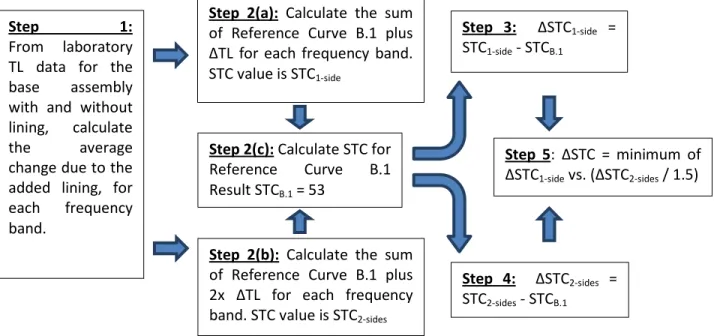
Figure 2.3: Steps to calculate the Single Number Rating ΔSTC for Added Linings (as detailed below)
The sound transmission loss is measured according to ASTM E90 both for a given base wall (such as the bare concrete block wall assemblies in Section 2.1) and for the base wall with an added lining on one side, and/or both sides. The transmission loss data (in 1/3-octave bands) are processed as follows: Step 1. The change in sound transmission loss (ΔTL) due to adding the lining is calculated from the
measurement results (with and without the added lining) for each frequency band, including at least 125 Hz to 4 kHz. This may involve averaging results from several pairs of specimens as detailed in Sections 2.2 and 2.3.
Step 2. (a) Calculate the sum of the TL for the Reference Curve B.1 (in Figure 2.2) plus ΔTL for each frequency band. The STC value for this set of TL values is STC1-side.
Step 3. (b) Calculate the sum of the TL for the Reference Curve B.1 (in Figure 2.2) plus 2 x ΔTL for each frequency band. The STC value for this set of TL values is STC2-sides.
Step 4. (c) Calculate the STC value for Reference Curve B.1 (STCB.1 )
Step 5. Subtract the STC value for Reference Curve B.1 (STCB.1 = 53) from STC1-sideto obtain ΔSTC1-side.
Step 6. Subtract the STC value for Reference Curve B.1 (STCB.1 = 53) from STC2-sidesto obtain ΔSTC2-sides.
Step 7. ΔSTC is the smaller of ΔSTC1-sideor ΔSTC2-sides /1.5 rounded to an integer (e.g. 20/1.5 = 13).
ΔSTC is used only in the simplified calculation procedures presented in Chapter 4. Consideration of the change in STC when there is a lining on both sides of the wall (Step 4) and dividing ΔSTC2-sides by 1.5 in
Step 5 can be understood by considering the use of ΔSTC values in Eq. 4.1.2 and 4.1.3 and in the worked examples in Chapter 4. Selection of the more conservative value (at Step 5) is required to avoid a misleading (over-optimistic) ΔSTC rating in the simplified calculation procedure, as discussed further in Sections 2.2 and 2.3.
Step 2(b): Calculate the sum
of Reference Curve B.1 plus 2x ΔTL for each frequency band. STC value is STC2-sides
Step 1:
From laboratory TL data for the base assembly with and without lining, calculate
the average
change due to the added lining, for each frequency band. Step 3: ΔSTC1-side = STC1-side - STCB.1 Step 4: ΔSTC2-sides = STC2-sides - STCB.1 Step 5: ΔSTC = minimum of ΔSTC1-side vs. (ΔSTC2-sides / 1.5)
Step 2(a): Calculate the sum
of Reference Curve B.1 plus ΔTL for each frequency band. STC value is STC1-side
Step 2(c): Calculate STC for
Reference Curve B.1 Result STCB.1 = 53
Page 18 of 125 Chapter 2: Sound Transmission Measurements for Concrete Block Walls
2.1 Concrete Block Walls without Gypsum Board Linings
The focus of this section is the concrete block masonry wall (concrete masonry block units and mortar) without a lining.
This study included tests on walls constructed of two types of concrete blocks:
• 190 mm normal weight concrete block units, nominally 53% solid (assembly surface weight 238kg/m2) designated here as BLK190(NW). See End Note 1 for more details.
• 140 mm lightweight concrete block units, nominally 58% solid (assembly surface weight 134kg/m2) designated here as BLK140(LW). See End Note 4 for more details.
The TL of each of these walls was measured several times, both with the surfaces of the concrete blocks untreated and with one or both surfaces sealed with appropriate sealer/paint. Sealing the surfaces had negligible effect on the sound transmission for walls of BLK190(NW), as shown in Figure 2.1.1. The cases without painted surfaces have the same STC rating as those with paint on one side or both sides, and the TL curves match within less than 1 dB at all frequencies.
Figure 2.1.1:
Sound transmission loss for walls of normal weight concrete blocks (BLK190(NW)) with or without paint on the surfaces.
The specimen codes in the legend indicate whether the block assemblies are unsealed [blue
squares for BLK190(NW)], or
painted on one side [red diamonds for PAINT_BLK190(NW)], or painted on both sides [green circles for PAINT_BLK190(NW)_PAINT]. Similar coding is used to identify the specimen constructions in subsequent Figures.
The average of the two tests without painted surfaces was used as the reference case for subsequent evaluation of changes in sound transmission due to sealing the surfaces or adding gypsum board linings. The average of the two tests without painted surfaces provides the best reference for the performance of this set of concrete block wall specimens without a lining and it is designated in subsequent discussion and in Fig. 2.2.1 as “2012-Mean BLK190(NW)”.
However, as a basis for estimating the performance of a “typical” concrete block wall of this type, this is just one of the available sources of information, and is inevitably biased by its size and boundary conditions. Another series of tests was performed in 1988 by Warnock using a similar test procedure and specimens assembled from very similar concrete blocks (specimen weight per unit area matched within 1%), but with different specimen size and edge conditions. Results from those tests were published in the NRC report IR-586 (26) and a series of research papers (27–29). The studies by
Warnock provides a good second example and the results from the two studies are compared in Figure 2.1.2.
Figure 2.1.2:
Sound transmission loss for wall specimens of 190 mm normal weight concrete blocks, from two test series in the NRC laboratory.
The two walls have similar STC ratings, but the transmission loss curves differ appreciably at the frequencies from 100 to 400Hz where the results for such walls are most affected by the edge conditions. Each result is a valid result for the conditions of the test specimen, but there is no basis for arguing that either is more representative of the expected performance when the wall is installed in a building. The average from the two studies (as shown in Figure 2.1.3) is proposed as the best estimate for BLK190(NW) for calculating sound insulation in buildings in Chapter 4.
Figure 2.1.3:
Sound transmission loss for wall specimens of 190 mm normal weight concrete blocks, from two test series in the NRC laboratory with different edge conditions.
The mean result is proposed as the best estimate for “typical” BLK190(NW) walls in buildings, and its 1/3-octave-band sound transmission loss data are listed in Table A1.1 in Appendix A1. It is labelled in this report as “NRC-Mean BLK190(NW)”
Page 20 of 125 Chapter 2: Sound Transmission Measurements for Concrete Block Walls
For walls built from lightweight concrete block masonry units, sealing the surfaces with paint resulted in a marked change in the TL results as shown in Figure 2.1.4. In this case, there were three (essentially identical) tests of the wall specimen with unsealed block. The mean of the three TL results for unsealed BLK140(LW) is shown in Figure 2.1.4, for comparison with the quite different results with paint sealing on one side or both sides of the wall.
Figure 2.1.4:
Sound transmission loss for a wall specimen of lightweight concrete blocks BLK140(LW) with and without paint on one or both surfaces.
The specimen codes in the legend indicate whether block assemblies are bare [blue squares for BLK140(NW)], or painted on one
side [red diamonds for
PAINT_BLK140(NW)], or painted on both sides [green circles for PAINT_BLK140(NW)_PAINT].
Adding paint to seal one side increased the STC rating from 35 to 39. The smaller changes due to painting the second side raised the STC rating further to 41. For this hollow lightweight concrete block wall, it was concluded that significant sound power leaks through the porous aggregate-cement matrix unless the blocks are sealed. A similar pattern of improvement was observed when the bare wall was sealed with linings of gypsum board on wood furring as shown in Figure 2.1.5.
Figure 2.1.5:
Sound transmission loss for a wall specimen of lightweight concrete blocks BLK140(LW) when a lining of 16 mm gypsum board on 38 mm wood furring (WFUR38_G16) is added on one or both surfaces of the assembly of unpainted blocks. As in Figure 2.1.4, the change due to adding the lining on the first side is greater than the change when the lining is added on the second side, because adding the first lining also suppresses most of the sound leakage through the blocks.
For both types of surface treatments added to the block assembly (PAINT and WFUR38_G16, as shown in Figures 2.1.4 and 2.1.5, respectively), the added layer serves two functions. First, it provides a surface that effectively blocks air flow and thus increases the TL by suppressing any sound leakage through the lightweight aggregate matrix of the concrete blocks. Second, it also changes the coupling between the sound field in the adjacent room and the concrete block wall assembly – that is, the paint or the gypsum board assembly both function as linings.
Results like those in Figures 2.1.4 and 2.1.5 can be used to separate the effect of suppressing the leakage from the change in TL due only to adding the lining. The smaller changes due to adding a lining on the second side of the wall provide the best estimate of the improvement due to the lining itself, because the sound leakage has already been eliminated by the impervious lining added to the first side. If the change due to adding a lining on the second side is subtracted from the sound transmission loss for the block wall assembly with the same lining on one side, the difference should be a good estimate of the sound transmission loss through the unlined block wall with leakage eliminated.
Figure 2.1.6:
Sound transmission loss for a wall specimen of lightweight concrete blocks BLK140(LW) without the reduction due to leakage through the porous lightweight aggregate. Estimates of the sound transmission loss without leakage were obtained from the changes due to four types of linings, as explained below. The mean of the four estimates (solid black line) is taken as the best estimate for sound transmission without leakage, designated as Base-BLK140(LW).
Four linings (identified in caption of Figure 2.1.6) had valid tests when installed on 1 side and on both sides of the bare block wall assembly. These four sets of data yielded estimates of sound transmission through the lightweight block assembly with sound leakage suppressed; these estimates are presented in Figure 2.1.6. These four estimates of the sound transmission loss for unlined BLK140(LW) with the effect of leakage suppressed are not identical but there is no basis to reject or prefer any of them. Hence the mean is taken as the best estimate, and this is designated as Base-BLK140(LW).
The results are applied and presented as follows:
• Mean 1/3-octave-band sound transmission loss data for the bare unsealed concrete block walls and for the Base-BLK140(LW) wall without leakage, are given in Table A1.1 in Appendix A1. • The estimated sound transmission without leakage is used for the calculations of sound
transmission via direct and flanking paths for calculation of ASTC according to the Simplified Method in Chapter 4, and is also applicable to calculation by the Detailed Method.
• The change in the STC ratings due to the addition of various linings on lightweight block walls is discussed in detail in Section 2.3.
Page 22 of 125 Chapter 2: Sound Transmission Measurements for Concrete Block Walls
2.2 Adding Linings on Concrete Block Masonry Walls Constructed with
Normal Weight Units
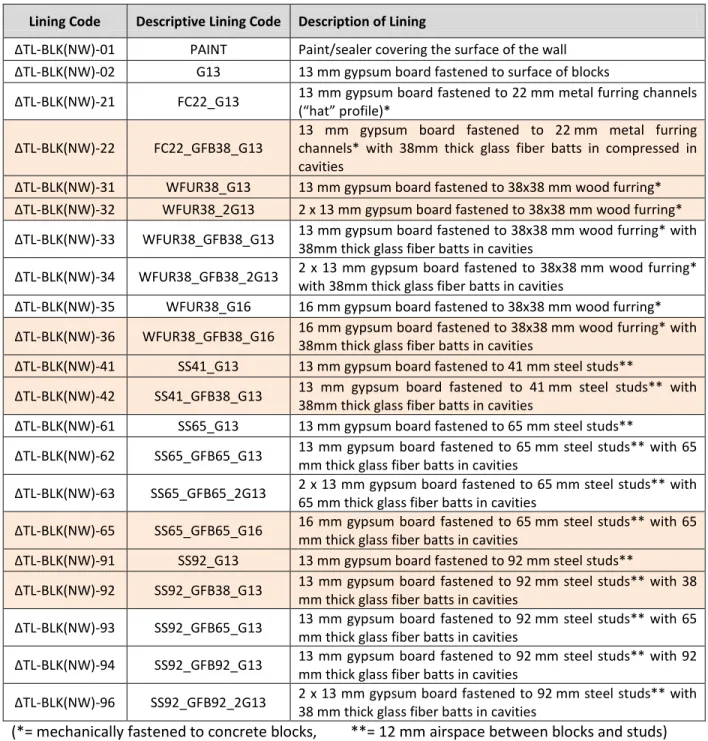
This section presents the results of sound transmission measurements for a series of wall specimens comprising a concrete block wall assembly of normal weight units with an added lining covering one side or both sides. The linings are described in Table 2.2.1.
Table 2.2.1: Linings tested on BLK190(NW) base wall specimen. In all cases, the furring or studs are
spaced 610 mm on center and the faces of the concrete block are not painted except where the lining PAINT is explicitly identified.
Lining Code Descriptive Lining Code Description of Lining
ΔTL-BLK(NW)-01 PAINT Paint/sealer covering the surface of the wall ΔTL-BLK(NW)-02 G13 13 mm gypsum board fastened to surface of blocks
ΔTL-BLK(NW)-21 FC22_G13 13 mm gypsum board fastened to 22 mm metal furring channels (“hat” profile)*
ΔTL-BLK(NW)-22 FC22_GFB38_G13
13 mm gypsum board fastened to 22 mm metal furring channels* with 38mm thick glass fiber batts in compressed in cavities
ΔTL-BLK(NW)-31 WFUR38_G13 13 mm gypsum board fastened to 38x38 mm wood furring* ΔTL-BLK(NW)-32 WFUR38_2G13 2 x 13 mm gypsum board fastened to 38x38 mm wood furring* ΔTL-BLK(NW)-33 WFUR38_GFB38_G13 13 mm gypsum board fastened to 38x38 mm wood furring* with
38mm thick glass fiber batts in cavities
ΔTL-BLK(NW)-34 WFUR38_GFB38_2G13 2 x 13 mm gypsum board fastened to 38x38 mm wood furring* with 38mm thick glass fiber batts in cavities
ΔTL-BLK(NW)-35 WFUR38_G16 16 mm gypsum board fastened to 38x38 mm wood furring* ΔTL-BLK(NW)-36 WFUR38_GFB38_G16 16 mm gypsum board fastened to 38x38 mm wood furring* with
38mm thick glass fiber batts in cavities
ΔTL-BLK(NW)-41 SS41_G13 13 mm gypsum board fastened to 41 mm steel studs**
ΔTL-BLK(NW)-42 SS41_GFB38_G13 13 mm gypsum board fastened to 41 mm steel studs** with 38mm thick glass fiber batts in cavities
ΔTL-BLK(NW)-61 SS65_G13 13 mm gypsum board fastened to 65 mm steel studs**
ΔTL-BLK(NW)-62 SS65_GFB65_G13 13 mm gypsum board fastened to 65 mm steel studs** with 65 mm thick glass fiber batts in cavities
ΔTL-BLK(NW)-63 SS65_GFB65_2G13 2 x 13 mm gypsum board fastened to 65 mm steel studs** with 65 mm thick glass fiber batts in cavities
ΔTL-BLK(NW)-65 SS65_GFB65_G16 16 mm gypsum board fastened to 65 mm steel studs** with 65 mm thick glass fiber batts in cavities
ΔTL-BLK(NW)-91 SS92_G13 13 mm gypsum board fastened to 92 mm steel studs**
ΔTL-BLK(NW)-92 SS92_GFB38_G13 13 mm gypsum board fastened to 92 mm steel studs** with 38 mm thick glass fiber batts in cavities
ΔTL-BLK(NW)-93 SS92_GFB65_G13 13 mm gypsum board fastened to 92 mm steel studs** with 65 mm thick glass fiber batts in cavities
ΔTL-BLK(NW)-94 SS92_GFB92_G13 13 mm gypsum board fastened to 92 mm steel studs** with 92 mm thick glass fiber batts in cavities
ΔTL-BLK(NW)-96 SS92_GFB92_2G13 2 x 13 mm gypsum board fastened to 92 mm steel studs** with 38 mm thick glass fiber batts in cavities
Figure 2.2.1 presents one example of how adding the gypsum board lining on one side or both sides changes the sound transmission loss.
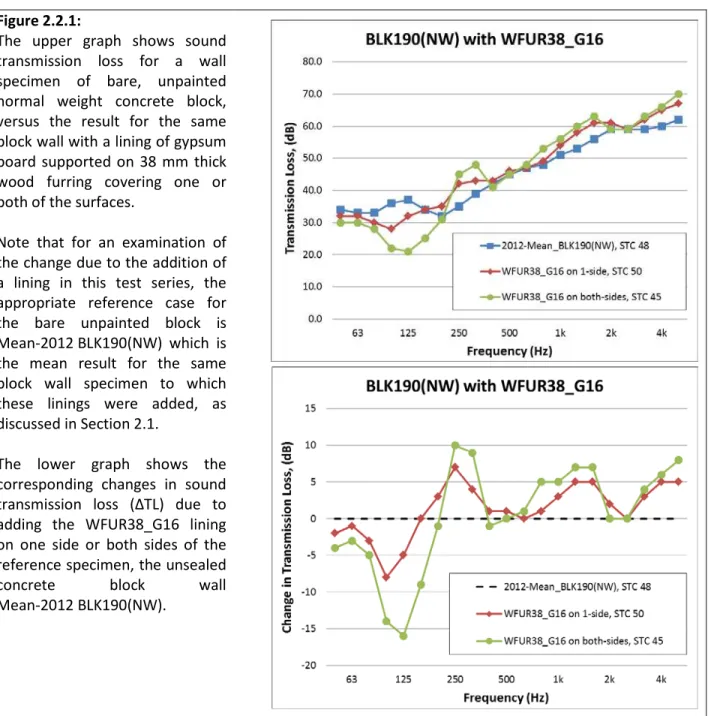
Figure 2.2.1:
The upper graph shows sound transmission loss for a wall specimen of bare, unpainted normal weight concrete block, versus the result for the same block wall with a lining of gypsum board supported on 38 mm thick wood furring covering one or both of the surfaces.
Note that for an examination of the change due to the addition of a lining in this test series, the appropriate reference case for the bare unpainted block is Mean-2012 BLK190(NW) which is the mean result for the same block wall specimen to which these linings were added, as discussed in Section 2.1.
The lower graph shows the corresponding changes in sound transmission loss (ΔTL) due to adding the WFUR38_G16 lining on one side or both sides of the reference specimen, the unsealed concrete block wall Mean-2012 BLK190(NW).
Two features of the changes should be noted:
• The change is not always an improvement. The figure shows that in this case, the change is negative – the TL with the lining is below that for bare BLK190(NW) – at frequencies below about 200 Hz.
• Adding a matching lining on both sides of the wall approximately doubles the change in the TL at each frequency band relative to the change observed for adding a lining to one side of the bare concrete block wall (though measurement uncertainty gives some deviation in individual cases).
Page 24 of 125 Chapter 2: Sound Transmission Measurements for Concrete Block Walls
Despite the change in the TL due to the addition of the lining on the second side, the change in the STC does NOT usually double. This is because negative, low frequency dips like those due to adding this lining have a strong influence on the STC. Although adding this lining on one side increases the STC from 48 to 50, adding the identical lining on both sides reduces the STC to 45. It is this behaviour that forces the conservative process for calculating ΔSTC presented at the beginning of Chapter 2.
A strong low frequency resonance (evident as a dip in the change in the transmission loss in Figure 2.2.1 and 2.2.2 below 200 Hz) limits the STC rating.
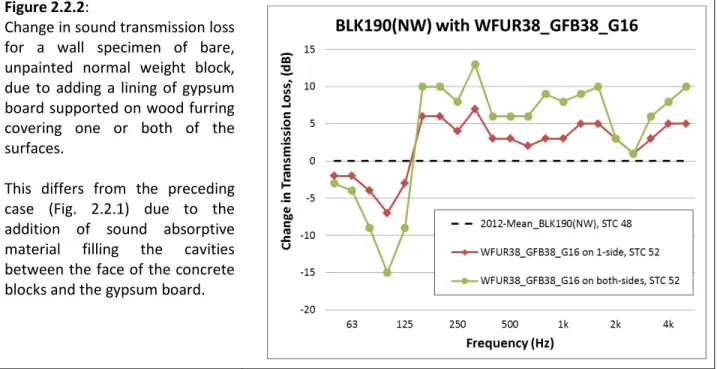
Figure 2.2.2 shows the effect of filling the cavities (spaces between furring elements and between the faces of the concrete block assembly and the gypsum board) with absorptive material. Here again, adding the lining on one side changes the TL relative to that for the bare BLK190(NW) wall, and adding the matching lining on the second side approximately doubles the change of the TL at each frequency.
Figure 2.2.2:
Change in sound transmission loss for a wall specimen of bare, unpainted normal weight block, due to adding a lining of gypsum board supported on wood furring covering one or both of the surfaces.
This differs from the preceding case (Fig. 2.2.1) due to the addition of sound absorptive material filling the cavities between the face of the concrete blocks and the gypsum board.
Again, the change due to adding a lining is not always an improvement. The figure shows that in this case, for frequencies below 160 Hz, the change in the TL is negative – the TL with the lining is below that for bare BLK190(NW) – but the dip has less effect on the STC than the case shown in Fig. 2.2.1. For the case in Figure 2.2.2 of the lining applied to both sides of the wall, the low frequency resonance is shifted to a lower frequency by filling the inter-furring cavities with sound absorptive material. A lining on one side increases the STC rating from 48 to 52. Adding the same type of lining on the second side does not further increase the STC rating despite the generally higher TL above 125 Hz.
Increasing the weight of the gypsum board, increasing the depth of the cavity between the faces of the gypsum board and the concrete block, or adding absorptive material in the cavity, can all shift the low frequency dip below the frequency range (125 Hz to 4000 Hz) that determines the STC rating. For example, it can be seen in Figure 2.2.3 that increasing the cavity depth to about 100 mm by mounting the gypsum board on 92 mm lightweight steel studs shifts the frequency at which the TL becomes negative to frequencies below 100 Hz. With the larger cavity depth, the STC rating increases to 67 with the lining on one side and to 78 with linings on both sides.
Figure 2.2.3:
Change in the sound transmission loss for wall specimen of bare, unpainted normal weight block, due to adding a lining of gypsum board supported on steel studs covering one or both of the surfaces. Sound absorptive material partly fills the inter-stud cavities (65 mm of material in 92 mm stud depth).
As for other graphs in this section, the reference case is the bare, unsealed 2012-Mean for BLK190(NW).
These results show trends very similar to those reported by Warnock (26–29), despite differences between the studies in regard to the specimen materials (different gypsum board and sound absorptive material) and major changes in the test facility.
Calculating ΔTL and ΔSTC Values for the Linings:
The specimens tested in this study demonstrated the change due to adding a given lining in 3 situations: 1. Wall specimens with the lining applied on one side,
2. Wall specimens with the same lining applied on both sides,
3. Wall specimens with the lining applied on one side but a different lining on the other side.
Each type of lining was tested for the first situation with the lining applied on one side (sometimes several tests were performed) and most were tested in one or both of the other situations. For the first situation, the TL for the bare, unsealed BLK190(NW) wall was subtracted from the TL with the added lining. For the second situation, the TL for the bare, unsealed BLK190(NW) wall was subtracted from the TL with added linings on both sides, and the result was divided by 2. For the third situation, the TL for a BLK190(NW) wall with other lining on one side was subtracted from the TL for the wall with the two mismatched linings. Test results significantly compromised by flanking (which limits apparent TL when the specimen TL approaches the facility limit) were eliminated, and a weighted average was used (50% weighting for situation 1 and 50% for the average of situations 2 and 3).
Results are presented and used as follows:
• The averaged 1/3-octave-band changes in sound transmission loss (ΔTL) for each lining applied to the BLK190(NW) concrete block wall test specimens are given in Table A1.2 in Appendix A1. These data are needed for calculation of the ASTC using the Detailed Method, as discussed in RR-331.
• The set of ΔTL data for each lining were used with the standard reference TL curve, as discussed at the beginning of Chapter 2, to determine ΔSTC for each lining when applied to the BLK190(NW) wall specimen. The calculation results are presented in Table 2.2.2 below.
Page 26 of 125 Chapter 2: Sound Transmission Measurements for Concrete Block Walls
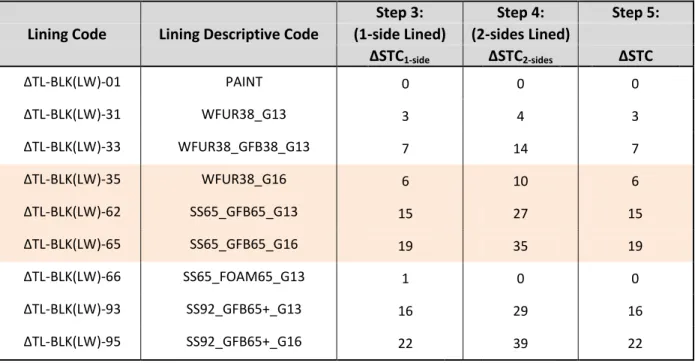
Table 2.2.2: ΔSTC values for linings on BLK190(NW) wall specimens. Note that these are referenced as
data for worked examples in the calculations of Chapter 4.
Lining Code Lining Descriptive Code
Step 3: Step 4: Step 5:
(1-side lined) (2-sides lined)
ΔSTC1-side ΔSTC2-sides ΔSTC ΔTL-BLK(NW)-01 PAINT 0 0 0 ΔTL-BLK(NW)-02 G13 -1 -4 -3 ΔTL-BLK(NW)-21 FC25_G13 0 -1 -1 ΔTL-BLK(NW)-22 FC25_GFB38_G13 3 3 2 ΔTL-BLK(NW)-31 WFUR38_G13 1 -1 -1 ΔTL-BLK(NW)-32 WFUR38_2G13 2 1 1 ΔTL-BLK(NW)-33 WFUR38_GFB38_G13 4 6 4 ΔTL-BLK(NW)-34 WFUR38_GFB38_2G13 5 8 5 ΔTL-BLK(NW)-35 WFUR38_G16 1 -3 -2 ΔTL-BLK(NW)-36 WFUR38_GFB38_G16 4 3 2 ΔTL-BLK(NW)-41 SS41_G13 4 0 0 ΔTL-BLK(NW)-42 SS41_GFB38_G13 9 15 9 ΔTL-BLK(NW)-61 SS65_G13 7 3 2 ΔTL-BLK(NW)-62 SS65_GFB65_G13 19 33 19 ΔTL-BLK(NW)-63 SS65_GFB65_2G13 22 43 22 ΔTL-BLK(NW)-65 SS65_GFB65_G16 21 39 21 ΔTL-BLK(NW)-91 SS92_G13 9 7 5 ΔTL-BLK(NW)-92 SS92_GFB38_G13 17 25 17 ΔTL-BLK(NW)-93 SS92_GFB65_G13 18 31 18 ΔTL-BLK(NW)-94 SS92_GFB92_G13 18 31 18 ΔTL-BLK(NW)-96 SS92_GFB92_2G13 22 43 22 NOTES:
1. Headings “Step 3”, “Step 4” and “Step 5” refer to steps in the calculation procedure in Figure 2.3. 2. All supporting furring or studs are spaced 610 mm on center.
3. The ΔSTC values are based on measurements on wall specimens with unsealed concrete block. However, because of the low porosity of the normal weight aggregate, the results should also be applicable if the face(s) of a BLK190(NW) wall are painted/sealed.
4. The values of ΔSTC in Table 2.2.2 should be appropriate for all walls constructed with blocks of normal weight aggregate, including blocks with different thickness or over 53%-solid content. Note that if there are negative values of ΔTL within the frequency range that determines the STC rating (as in Figures 2.2.1 and 2.2.2) then adding the lining on the second side may give a combined change ΔSTC2-sides only slightly exceeding (or even below) ΔSTC1-side. This tends to occur if inter-furring cavities
are not largely-filled with absorptive material and/or if the cavity depth is less than 40 mm. In those cases, Steps 4 and 5 of the procedure ensure a value of ΔSTC suitable for the calculations in Chapter 4 with both sides lined.
2.3 Adding Linings on Concrete Block Masonry Walls Constructed with
Lightweight Units
For concrete block walls constructed with lightweight units4, the change in the TL due to adding a given lining is quite different from the corresponding results for walls constructed with normal weight units1. This study included a variety of gypsum board linings applied to one or both sides of the BLK140(LW) base wall. Most of these linings match one of the linings applied to the normal weight block walls described in the preceding Section.
Table 2.3.1: Linings tested on BLK140(LW) base wall. In all cases, the furring or studs are spaced
610 mm on center and the faces of the concrete block are not painted with sealer except where the lining PAINT is explicitly identified.
Lining Code Lining Descriptive Code Description of Lining
ΔTL-BLK(LW)-01 PAINT Paint/sealer covering the surface of the wall ΔTL-BLK(LW)-31 WFUR38_G13 13 mm gypsum board fastened to 38x38 mm wood
furring*
ΔTL-BLK(LW)-33 WFUR38_GFB38_G13 13 mm gypsum board fastened to 38x38 mm wood furring* with 38mm thick glass fiber batts in cavities ΔTL-BLK(LW)-35 WFUR38_G16 16 mm gypsum board fastened to 38x38 mm wood
furring*
ΔTL-BLK(LW)-62 SS65_GFB65_G13 13 mm gypsum board fastened to 65 mm steel studs** with 65 mm thick glass fiber batts in cavities ΔTL-BLK(LW)-65 SS65_GFB65_G16 16 mm gypsum board fastened to 65 mm steel
studs** with 65 mm thick glass fiber batts in cavities ΔTL-BLK(LW)-66 SS65_FOAM65_G13 13 mm gypsum board fastened to 65 mm steel
studs** with spray polyurethane foam filling cavities ΔTL-BLK(LW)-93 SS92_GFB65+_G13
13 mm gypsum board fastened to 92 mm steel studs** with 65 mm or thicker glass fiber batts in cavities
ΔTL-BLK(LW)-95 SS92_GFB65+_G16
16 mm gypsum board fastened to 92 mm steel studs** with 65 mm or thicker glass fiber batts in cavities
(*= mechanically fastened to concrete blocks, **= 12 mm airspace between blocks and studs) Note that the Lining Codes are subsequently referenced in the worked examples in Chapter 4.
The sound transmission through Base-BLK140(LW) (i.e. the estimate without leakage through the lightweight block wall, as described in Section 2.1) was used as the reference for all of the calculations of the changes due to adding linings to walls of lightweight concrete blocks. This is obviously the appropriate case for flanking paths (since different walls are involved in the source and receiving room, so leakage through one cannot affect the other) and is also appropriate for direct transmission if the separating wall is sealed with paint or a gypsum board lining.
Page 28 of 125 Chapter 2: Sound Transmission Measurements for Concrete Block Walls
Figure 2.3.1 shows the effect of adding the ‘WFUR38_G16” lining to one side or both sides of the lightweight block wall, using Base-BLK140(LW) as the reference case without a lining. Note that adding the lining on one side results in a change in the TL which is very similar to the effect of adding the matching lining on the second side. This mimics the behaviour observed for linings added to normal weight block walls and confirms the selection of Base-BLK140(LW) as a suitable reference curve.
Figure 2.3.1:
The upper graph shows sound transmission loss for a wall specimen of unpainted lightweight concrete block with a lining of 16 mm gypsum board supported on wood furring covering one or both of the surfaces.
Note that for examination of the change due to the addition of the lining in this test series, the appropriate reference case for the unsealed block is Base-BLK140(LW) with the effect of leakage removed.
The lower graph compares the
changes in the sound
transmission loss (ΔTL) due to adding the WFUR38_G16 lining to
light-weight concrete block
specimens versus adding the same lining to normal weight blocks. In both cases the values of ΔTL are mean values for all specimens tested with this lining.
Unlike the changes for the same lining applied to bare BLK190(NW) shown in the previous section in Figure 2.2.1 and in the lower graph of Figure 2.3.1, the changes in the TL observed in the upper graph of Figure 2.3.1 when the lining is added to unsealed lightweight block are consistently positive in the frequency range above 100 Hz. The lower graph provides a comparison between the changes due to