HAL Id: hal-01270152
https://hal.archives-ouvertes.fr/hal-01270152
Submitted on 14 Jan 2021
HAL is a multi-disciplinary open access archive for the deposit and dissemination of sci-entific research documents, whether they are pub-lished or not. The documents may come from teaching and research institutions in France or abroad, or from public or private research centers.
L’archive ouverte pluridisciplinaire HAL, est destinée au dépôt et à la diffusion de documents scientifiques de niveau recherche, publiés ou non, émanant des établissements d’enseignement et de recherche français ou étrangers, des laboratoires publics ou privés.
High repetition rate femtosecond laser irradiation of
fused silica studied by Raman spectroscopy
Nadezda Varkentina, Marc Dussauze, Arnaud Royon, Marc Ramme, Yannick
Petit, Lionel Canioni
To cite this version:
Nadezda Varkentina, Marc Dussauze, Arnaud Royon, Marc Ramme, Yannick Petit, et al.. High repetition rate femtosecond laser irradiation of fused silica studied by Raman spectroscopy. Optical Materials Express, OSA pub, 2016, 6 (1), pp.79-90. �10.1364/OME.6.000079�. �hal-01270152�
High repetition rate femtosecond laser
irradiation of fused silica studied by Raman
spectroscopy
Nadezda Varkentina,1,* Marc Dussauze,2 Arnaud Royon,1 Marc Ramme,1 Yannick
Petit,1,3 and Lionel Canioni1
1Univ. Bordeaux, LOMA, UMR 5798, F-33400 Talence, France, CNRS, LOMA, UMR 5798, F-33400 Talence,
France
2 Univ. Bordeaux, ISM, UMR 5255, F-33400 Talence, France, CNRS, ISM, UMR 5255, F-33400 Talence, France 3CNRS, ICMCB, UPR 9048, F-33608 Pessac, France, Univ. Bordeaux, ICMCB, UPR 9048, F-33400 Pessac, France
* nadezda.varkentina@institutoptique.fr
Abstract: In this article, we have focused our attention on the femtosecond
laser irradiation of fused silica to study the mechanisms of micro-cavities and nanofibers formation. The nanofibers formed have small diameters and are extremely long, with a typical aspect ratio of 1000. Structural rearrangements and density variation have been studied by micro-Raman spectroscopy as a function of the irradiation parameters. 3D spatial characterizations of structural reorganizations and molecular oxygen production have given insights on high-temperature and high-pressure silica transformations by high repetition rate femtosecond laser irradiation. ©2015 Optical Society of America
OCIS codes: (160.6030) Silica; (320.2250) Femtosecond phenomena; (300.6450)
Spectroscopy, Raman; (350.3390) Laser materials processing; (350.3450) Laser-induced chemistry; (350.5400) Plasmas.
References and links
1. R. R. Gattass and E. Mazur, “Femtosecond laser micromachining in transparent materials,” Nat. Photonics 2(4), 219–225 (2008).
2. M. Lenzner, J. Krüger, S. Sartania, Z. Cheng, Ch. Spielmann, G. Mourou, W. Kautek, and F. Krausz, “Femtosecond optical breakdown in dielectrics,” Phys. Rev. Lett. 80(18), 4076–4079 (1998). 3. N. Sanner, O. Utèza, B. Bussière, G. Coustillier, A. Leray, T. Itina, and M. Sentis, “Measurement of
femtosecond laser-induced damage and ablation thresholds in dielectrics,” Appl. Phys., A Mater. Sci. Process.
94(4), 889–897 (2009).
4. L. Sudrie, M. Franco, B. Prade, and A. Mysyrowicz, “Study of damage in fused silica induced by ultra-short IR laser pulses,” Opt. Commun. 191(3-6), 333–339 (2001).
5. Y. Shimotsuma, P. G. Kazansky, J. Qiu, and K. Hirao, “Self-organized nanogratings in glass irradiated by ultrashort light pulses,” Phys. Rev. Lett. 91(24), 247405 (2003).
6. N. Glezer and E. Mazur, “Ultrafast-laser driven micro-explosions in transparent materials,” Appl. Phys. Lett.
71(7), 882–884 (1997).
7. A. Vailionis, E. G. Gamaly, V. Mizeikis, W. Yang, A. V. Rode, and S. Juodkazis, “Evidence of superdense aluminium synthesized by ultrafast microexplosion,” Nat. Commun. 2, 445–451 (2011).
8. S. Juodkazis, H. Misawa, O. A. Louchev, and K. Kitamura, “Femtosecond laser ablation of chalcogenide glass: explosive formation of nano-fibres against thermo-capillary growth of micro-spheres,” Nanotechnology 17(19), 4802–4805 (2006).
9. K. Venkatakrishnan, D. Vipparty, and B. Tan, “Nanofibre fabrication by femtosecond laser ablation of silica glass,” Opt. Express 19(17), 15770–15776 (2011).
10. M. Sivakumar, K. Venkatakrishnan, and B. Tan, “Synthesis of glass nanofibers using femtosecond laser radiation under ambient condition,” Nanoscale Res. Lett. 4(11), 1263–1266 (2009).
11. L. Bressel, D. de Ligny, C. Sonneville, V. Martinez, V. Mizeikis, R. Buividas, and S. Juodkazis, “Femtosecond laser induced density changes in GeO2 and SiO2 glasses: fictive temperature effect,” Opt. Mater. Express 1(4),
605–613 (2011) (Invited).
12. K. Mishchik, C. D’Amico, P. K. Velpula, C. Mauclair, A. Boukenter, Y. Ouerdane, and R. Stoian, “Ultrafast laser induced electronic and structural modifications in bulk fused silica,” J. Appl. Phys. 114(13), 133502 (2013). 13. J. Burgin, C. Guillon, P. Langot, F. Vallée, B. Hehlen, and M. Foret, “Vibrational modes and local order in
permanently densified silica glasses: femtosecond and Raman spectroscopy study,” Phys. Rev. B 78(18), 184203
#246147 Received 20 Jul 2015; revised 19 Oct 2015; accepted 19 Oct 2015; published 9 Dec 2015 © 2015 OSA 1 Jan 2016 | Vol. 6, No. 1 | DOI:10.1364/OME.6.000079 | OPTICAL MATERIALS EXPRESS 79
(2008).
14. A. Rahmani, M. Benoit, and C. Benoit, “Signature of small rings in the Raman spectra of normal and compressed amorphous silica: A combined classical and ab initio study,” Phys. Rev. B 68(18), 184202 (2003).
15. M. Lancry, B. Poumellec, J. Canning, K. Cook, J.-C. Poulin, and F. Brisset, “Ultrafast nanoporous silica formation driven by femtosecond laser irradiation,” Laser Photonics Rev. 3(11), 1–10 (2013).
16. L. Bressel, D. de Ligny, E. G. Gamaly, A. Rode, and S. Juodkazis, “Observation of O2 inside voids formed in
GeO2 glass by tightly-focused fs-laser pulses,” Opt. Mater. Express 1(6), 1150–1158 (2011).
17. F. L. Galeener and A. E. Geissberger, “Vibrational dynamics in 30Si-substituted vitreous SiO
2,” Phys. Rev. B
27(10), 6199–6204 (1983).
18. M. Dussauze, V. Rodriguez, A. Lipovskii, M. Petrov, C. Smith, K. Richardson, T. Cardinal, E. Fargin, and E. I. Kamitsos, “How does thermal poling affect the structure of soda-lime glass?” J. Phys. Chem. C 114(29), 12754– 12759 (2010).
19. A. Pasquarello and R. Car, “Identification of Raman defect lines as signatures of ring structures in vitreous silica,” Phys. Rev. Lett. 80(23), 5145–5147 (1998).
20. F. L. Galeener and G. Lucovsky, “Longitudinal optical vibrations in glasses: GeO2 and SiO2,” Phys. Rev. Lett.
37(22), 1474–1478 (1976).
21. A. Lehmann, L. Schumann, and K. Hübner, “Optical phonons in amorphous silicon oxides. I. Calculation of the density of states and interpretation of LO–TO splittings of amorphous SiO2,” Phys. Status Solidi (B) 117(2),
689–698 (1983).
22. K. Nakamoto, in Infrared and Raman Spectra of Inorganic and Coordination Compounds. Part B. Applications
in Coordination, Organometallic, and Bioinorganic Chemistry, 6th edition (John Wiley & Sons Inc., 2009).
23. K. Awazu and H. Kawazoe, “Strained Si–O–Si bonds in amorphous SiO2 materials: a family member of active
centers in radio, photo, and chemical responses,” J. Appl. Phys. 94(10), 6243–6262 (2003).
24. R. A. Barrio, F. L. Galeener, E. Martínez, and R. J. Elliott, “Regular ring dynamics in AX2 tetrahedral glasses,” Phys. Rev. B Condens. Matter 48(21), 15672–15689 (1993).
25. R. Salh, Silicon Nanocluster in Silicon Dioxide: Cathodoluminescence, Energy Dispersive X-ray Analysis,
Infrared Spectroscopy Studies, in Crystalline Silicon - Properties and Uses, Sukumar Basu, eds. (InTech, 2011),
pp. 173.
26. H. Sugiura, R. Ikeda, K. Kondo, and T. Yamadaya, “Densified silica glass after shock compression,” J. Appl. Phys. 80, 5145–5147 (1996).
27. R. J. Hemley, H. K. Mao, P. M. Bell, and B. O. Mysen, “Raman spectroscopy of SiO2 glass at high pressure,”
Phys. Rev. Lett. 57(6), 747–750 (1986).
28. B. Champagnon, C. Martinet, C. Coussa, and T. Deschamps, “Polyamorphism: path to new high-density glasses at ambient conditions,” J. Non-Crystal. Solids 353, 4208–4211 (2007).
29. J.-F. Lin, H. Fukui, D. Prendergast, T. Okuchi, Y. Q. Cai, N. Hiraoka, C.-S. Yoo, A. Trave, P. Eng, M. Y. Hu, and P. Chow, “Electronic bonding transition in compressed SiO2 glass,” Phys. Rev. B 75(1), 012201 (2007).
30. F. Yuan and L. Huang, “Brittle to ductile transition in densified silica glass,” Sci. Rep. 4, 5035–5043 (2014). 31. N. Shimodaira, K. Saito, N. Hiramitsu, S. Matsushita, and A. J. Ikushima, “Effects of fictive temperature and
halogen doping on the boson peak in silica glass,” Phys. Rev. B 71(2), 024209 (2005).
32. A. E. Geissberger and F. L. Galeener, “Raman studies of vitreous SiO2 versus fictive temperature,” Phys. Rev. B
28(6), 3266–3271 (1983).
33. R. Le Parc, B. Champagnon, Ph. Guenot, and S. Dubois, “Thermal annealing and density fluctuations in silica glass,” J. Non-Crystal. Solids 293–295, 366–369 (2001).
34. C. Fiori and R. A. B. Devine, “Evidence for a wide continuum of polymorphs in a-SiO2.,” Phys. Rev. B Condens.
Matter 33(4), 2972–2974 (1986).
35. M. Shimizu, M. Sakakura, M. Ohnishi, M. Yamaji, Y. Shimotsuma, K. Hirao, and K. Miura, “Three-dimensional temperature distribution and modification mechanism in glass during ultrafast laser irradiation at high repetition rates,” Opt. Express 20(2), 934–940 (2012).
36. M. Sakakura, M. Terazima, Y. Shimotsuma, K. Miura, and K. Hirao, “Elastic and thermal dynamics in femtosecond laser-induced structural change inside glasses studied by the transient lens method,” Las. Chem. 2010, Article ID 148268, 1–15 (2010).
37. A. Ben-Yakar, A. Harkin, J. Ashmore, R. L. Byer, and H. A. Stone, “Thermal and fluid processes of a thin melt zone during femtosecond laser ablation of glass: the formation of rims by single laser pulses,” J. Phys. D Appl. Phys. 40(5), 1447–1459 (2007).
38. E. G. Gamaly and A. V. Rode, “Physics of ultra-short laser interaction with matter: From phonon excitation to ultimate transformations,” Prog. Quantum Electron. 37(5), 215–323 (2013).
39. H. J. Melosh, “A hydrocode equation of state for SiO2,” Meteorit. Planet. Sci. 42(12), 2079–2098 (2007).
40. L. Skuja, “Defect studies in vitreous silica and related materials: optically active oxygen-deficiency-related centers in amorphous silicon dioxide,” J. Non-Crystal. Solids 239, 16–48 (1998).
41. S. Juodkazis, S. Kohara, Y. Ohishi, N. Hirao, A. Vailionis, V. Mizeikis, A. Saito, and A. Rode, “Structural changes in femtosecond laser modified regions inside fused silica,” J. Opt. 12(12), 124007 (2010). 42. N. P. Bansal and R. H. Doremus, in Handbook of Glass Properties (Academic Press, Inc., 1986).
43. A. Royon, Y. Petit, G. Papon, M. Richardson, and L. Canioni, “Femtosecond laser induced photochemistry in tailored materials,” Opt. Mater. Express 1(5), 866–882 (2011) (invited).
#246147 Received 20 Jul 2015; revised 19 Oct 2015; accepted 19 Oct 2015; published 9 Dec 2015 © 2015 OSA 1 Jan 2016 | Vol. 6, No. 1 | DOI:10.1364/OME.6.000079 | OPTICAL MATERIALS EXPRESS 80
1. Introduction
Tightly focused femtosecond pulses with energies of a few hundreds of nanojoules have become a key tool to modify the physical and chemical properties of materials in three dimensions at a sub-micrometer scale [1]. These physico-chemical modifications depend on the laser parameters, the material composition and the focusing conditions, that are at the surface or within the bulk. Among many glasses, fused silica has certainly been the most studied due to its relatively simple composition and excellent optical quality. When exposed to femtosecond pulses focused at the surface, fused silica undergoes breakdown, which is surface damage and/or material removal, so-called ablation [2, 3]. When exposed to femtosecond pulses focused deeply inside the bulk (typically more than tens of micrometers below the surface, depending on the focusing conditions), fused silica exhibits three different response regimes. At low irradiance (type 1), local densification and color centers are created leading to an isotropic refractive index change ∆n [4]. At intermediate irradiances (type 2), nanogratings are formed, giving rise to an anisotropic ∆n and form birefringence [5]. At high irradiance (type 3), voids with a low refractive index core and a high refractive index shell are formed [6].
Moreover the group of A. Vailionis et al. had demonstrated conditions relevant to warm dense matter within strongly focused femtosecond laser pulses with energy of hundreds of nJ at low repetition rate [7]. Under such extreme conditions of temperature and pressure A. Vailionis et al. had also demonstrated a new phase of ultra-dense aluminum issued from sapphire [7].
At high repetition rate, K. Venkatakrishnan et al. [9] demonstrated formation of extremely high aspect ratio fused silica nanofibers. When multiple femtosecond pulses are focused inside fused silica at a distance comprised between 10 and 40 µm below the surface (depending on the focusing conditions), nanofibers are formed, emerging from the shell of a micro-cavity [9]. These nanofibers have diameters that can be as low as 20 nm and as long as a few hundreds of microns. The formation mechanisms of these nanofibers are currently unclear. It seems however obvious that extreme temperature and pressure conditions relevant to warm dense matter are involved in the process of nano-jet formation, resulting in their formation. The formation of nanofibers in explosion regimes had been also shown by S. Juodkazis et al. in chalcogenide glass [8].
To get more insights in the formation of nanofibers, Sivakumar et al. [10] had already performed an averaged Raman spectroscopy on the irradiated zone containing such nanofibers. He observed structural modifications after femtosecond laser irradiation. Nevertheless, this study is lacking spatial resolution and systematic mapping of the irradiated zone.
In this article, we describe Raman mapping of femtosecond laser-induced micro-cavities performed in sub-surface micro-explosion regime. Examination of three-dimensional Raman spectra mapping of the micro-cavities, enables to observe the material density change and structural reorganization as a function of the writing incident irradiance and number of pulses. It allows a description of this particular irradiation mechanisms taking into account glass structure transformation, high pressure effects, viscosity changes and focus dynamic due to pulse after pulse accumulation effects.
2. Sample description, experimental details and methodology
2.1. Direct laser writing setup and methodology
The experimental test-bench for bulk micro-structuring consists of a laser system (Yb:KGW commercial laser Amplitude Systemes, t-pulse 200, 10 MHz) with a pulse duration of 390 fs at an operating wavelength of 1030 nm. The collimated laser beam having a diameter of 4 mm is focused below the sample surface at a depth of 20 µm, using a microscope objective (Mitutoyo Plan Apo NIR HR, NA = 0.7, 100 × ). A CCD camera coupled to a white light #246147 Received 20 Jul 2015; revised 19 Oct 2015; accepted 19 Oct 2015; published 9 Dec 2015 © 2015 OSA 1 Jan 2016 | Vol. 6, No. 1 | DOI:10.1364/OME.6.000079 | OPTICAL MATERIALS EXPRESS 81
source is installed for laser beam positioning and diagnostics. The sample is displaced in three (x, y, z) dimensions by motorized translation stages (XMS-50 stages in xy and VP-25-XL in z, Micro-Contrôle). An acousto-optic modulator ensures the precise adjustment of the incident energy and number of pulses. All the experiments have been performed at ambient temperature and atmospheric pressure.
The sample is a high purity synthetic fused silica glass (SUPRASIL by Heraeus, impurities are < 0.065 ppm, total bubble cross section within the volume is ≤ 0.015 mm2/100 cm3). The number of pulses in a given spot area is varied from 104 to 108 pulses, and the irradiance is changed from 0.08 to 5.9 TW.cm−2. The threshold of the material modification is 2.6 TW.cm−2 per pulse in the accumulative regime. In this study, the threshold of a laser induced material modification is defined by its observation with an optical microscope.
Figure 1(a) shows the optical microscopy image of the femtosecond direct laser writing 20 microns beneath the surface where the irradiance and number of pulses have been varied.
Fig. 1. (a) Optical microscopy image of the experiment zone. The dashed-line rectangle shows the zone where surface nanofibers are formed. (b, c) SEM image of a laser-induced dome-shaped structure at the glass surface, due to sub-surface irradiation, resulting from the elastic-plastic deformation, respectively without and with the dome piercing (with no nanofiber formation, here). (d) SEM image of nanofibers at the surface of the crater corresponding to the bold-line rectangle in (a). Experimental conditions: 10 MHz laser @ 1030 nm, NA = 0.7, incident energy per pulse 5.7 TW.cm−2, 107 pulses. (e) Zoom showing winded nanofibers.
Within the investigated irradiation parameter range, micro-cavities can be formed. The optical microscopy image in Fig. 1(a) demonstrates the zone, where the micro-cavities are systematically formed (the region without any modifications is not shown in this figure). We can distinguish three different zones in Fig. 1(a). The first, for an incident irradince of 4.1 to 4.5 TW.cm−2 per pulse, a small zone corresponding to the cavity in the center and a large affected zone surrounding the cavity. The second, for the incident irradince range 4.8 - 5.2 TW.cm−2 per pulse, where a bigger cavity is formed and the affected zone is smaller than in
#246147 Received 20 Jul 2015; revised 19 Oct 2015; accepted 19 Oct 2015; published 9 Dec 2015 © 2015 OSA 1 Jan 2016 | Vol. 6, No. 1 | DOI:10.1364/OME.6.000079 | OPTICAL MATERIALS EXPRESS 82
the first case. The third, for irradiances higher than 5.2 TW.cm−2 cavities and nanofibers are formed.
In our irradiation conditions, systematic observation of the irradiated spots by scanning electron microscopy (SEM) show the elastic-plastic deformation of the surface for such high repetition rate sub-surface irradiation, with the formation of dome-shaped structures, as seen in Fig. 1(b). For some cases, these domes can get partially opened (see Fig. 1(c)).
Moreover, SEM images show that nanofibers are only generated for irradiance above 5.0 TW.cm−2 per pulse and in the range of 104 to 108 pulses. Figure 1(d) presents an example of SEM images with nanofibers exiting a micro-cavity formed with 5.7 TW.cm−2 and 107 pulses, while Fig. 1(e) shows a zoom of winded nanofibers.
The surface of the crater shown in Fig. 1(d) is smooth with the exception of some debris. The length of the nanofibers can be as long as hundreds of microns, while their diameter can be as small as 20 nm, leading to aspect ratios of several thousands.
2.2. Micro-Raman spectroscopy setup and methodology
Raman non-polarized spectroscopic measurements have been performed using a confocal micro-Raman spectrometer (LabRAM HR from HORIBA Jobin Yvon), with a typical spectral resolution of 1 cm−1. The incoming Ar-laser excitation (514 nm) is focused via a 100 × (NA = 0.9) microscope objective. The mapping have been performed with a spatial increment of 1.5 µm in the x and y directions and of 3 µm in the z direction.
Raman spectroscopy is a powerful tool for the methodical and detailed examination of material modifications. In particular, Raman spectroscopy in fused silica has been shown to be useful to investigate density changes [11–13], as well as phase transitions [14] and chemical changes [15, 16]. To study the Raman signature of the irradiated volume, a normalization procedure taking into account the beam propagation in depth of the sample has been employed. It simply consists in the normalization of each spectrum with respect to the full spectrum integrated area of the pristine material measured at the same depth. Note, that the z scale in this publication is not corrected for the refractive index. All z-scale presented in this study corresponds to the displacement of the translation stage. In the 3D Raman mapping, the Ar laser beam was going along the positive z-direction (from top to bottom) of the sample for all figures of the paper. We have also performed imaging along the opposite direction (not shown here), to be sure if the Raman signal is not perturbed while the laser beam is passing through highly constrained zones and oxygen dioxide especially close to the sample surface. We have not seen any difference when imaging in 3D the cavities along the negative z-direction (from bottom to top). We can thus conclude that there are no significant artifacts appearing when beam goes through some modified regions.
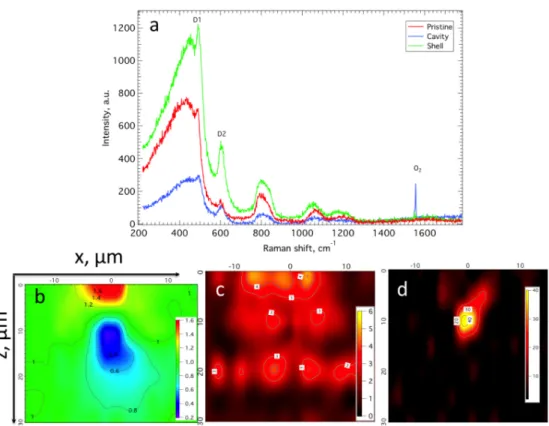
As an example, Fig. 2(a) shows the Raman spectra of a pristine fused silica as well as two typical spectra measured within the laser-exposed area.
#246147 Received 20 Jul 2015; revised 19 Oct 2015; accepted 19 Oct 2015; published 9 Dec 2015 © 2015 OSA 1 Jan 2016 | Vol. 6, No. 1 | DOI:10.1364/OME.6.000079 | OPTICAL MATERIALS EXPRESS 83
Fig. 2. (a) Raman spectra for three different cases: pristine fused silica, the shell and the cavity of a laser-exposed area (irradiance of 4.5 TW.cm−2, 108 pulses). (b) Mapping of the Global
Integrated Raman Intensity (GIRI) retrieved by integrating the spectral region from 220 to 700 cm−1. (c) Mapping of the D2 peak retrieved by integrating the spectral region from 575 to 700
cm−1. (d) Molecular oxygen distribution (peak at 1550 cm−1) inside the cavity. The surface
corresponds to the position z = 0.
The spectral assignments of fused silica Raman bands can be summarized as follow: the broadband centered at around 440 cm−1 has been attributed to coupled stretching-bending vibration of Si–O–Si bridges [17, 18]. The two sharp contributions at 490 cm−1 and 606 cm−1 have been attributed to the symmetric stretching vibrations (“breathing mode”) in four- and three- member rings of SiO4 tetrahedra (called respectively D1 and D2) [17–19]. At 805 cm−1, the peak is attributed to the local bending and stretching of Si–O–Si bridges [13, 17]. The two smaller contributions at 1064 and 1200 cm−1 are attributed to Si–O asymmetric stretching [20, 21].
The spectral variations observed in Fig. 2(a) concern, first, the global Raman intensity which can show within the irradiated volume either 60% increase or 80% decrease. One can also notice an increase of D1 and D2 peaks relatively to the main broadband at 440 cm−1, independently of the Raman signal intensity. The third appearing feature is the spectral line centered close to 1550 cm−1, which corresponds to the symmetric stretching of molecular dioxygen [22].
An example of three Raman images of a micro-cavity is shown in Fig. 2(b)-2(d). The first map is the integration of the spectral region from 220 to 700 cm−1 normalized to the Raman response of a pristine glass measured at the same depth. We further call it the Global Integrated Raman Intensity (GIRI) (see Fig. 2(b)). In Fig. 2(c), the second map depicts the proportion of three member rings in the silica network, by mapping the integration of the D2 peak (575 to 700 cm−1) normalized to the integration of the Global Integrated Raman Intensity (220 to 700 cm−1). The last image (Fig. 2(d)) presents molecular oxygen distribution within #246147 Received 20 Jul 2015; revised 19 Oct 2015; accepted 19 Oct 2015; published 9 Dec 2015 © 2015 OSA 1 Jan 2016 | Vol. 6, No. 1 | DOI:10.1364/OME.6.000079 | OPTICAL MATERIALS EXPRESS 84
the irradiated volume. Indeed, we have chosen three different types of Raman mapping according to the following reasons: GIRI variation reflects density changes but also the Raman scattering cross section variations upon structural modification. It gives direct information of the density of states in material and allows drawing a trend for the material density changes. In our case GIRI is normalized, thus, when the value of GIRI is lower than the material density has decreased. On the contrary, when the value of GIRI has increased the density of the material should increase. Thus the global Raman intensity allows localization of the expected cavity. We can further locate molecular oxygen within the cavity [15]. In addition, an increase of the number of small rings within the silica glass structure (D1 and D2 Raman peaks) has been correlated to both pressure effects and changes in fictive temperature [23–34]. Such spectral changes could inform us about the laser induced constrains and the thermal history of the glass after femtosecond laser irradiation in conditions relevant to warm dense matter.
3. Results
Hereafter we concentrate on the description of the fused silica modification with the emphasis on the conditions of the nanofiber formation in the multishot cumulative regime. The methodology proposed in section 2.2 is further applied to study the subsequent steps of the material modification. Figure 3 presents the Raman mapping of modifications for the same incident irradiance (4.5 TW.cm−2 per pulse) and different number of pulses (from 104 to 108). The modifications in GIRI are shown in Fig. 3(a), 3(d), 3(g).
Fig. 3. Raman mapping of the modifications for irradiance of 4.5 TW.cm−2 and different
number of pulses. Columns 2, 3, and 4 are the Global Integrated Raman Intensity (GIRI), the D2 peak and the molecular oxygen peak (1550 cm−1), respectively, and lines 2, 3, and 4
correspond to 104, 106, and 108 pulses, respectively. All images are in µm. Zero in the left axis
corresponds to the surface. Femtosecond laser beam profile is present by red dotted curves.
#246147 Received 20 Jul 2015; revised 19 Oct 2015; accepted 19 Oct 2015; published 9 Dec 2015 © 2015 OSA 1 Jan 2016 | Vol. 6, No. 1 | DOI:10.1364/OME.6.000079 | OPTICAL MATERIALS EXPRESS 85
One can see that there exist two different areas: the first, where GIRI increases and, the second, where GIRI decreases. For 104 pulses we distinguish the cavity with GIRI of 0.6 and two lobes at the sides of the cavity where GIRI has increased up to 1.2. For higher number of incident pulses (106 and 108), the sub-surface cavity increase in volume; and GIRI decreases and reaches 0.4 from the initial value and even 0.2 in the central part. The increase of GIRI is now situated on the top of the cavity and reaches the value of 1.6. The volume of the cavity and of GIRI modifications increases with number of pulses.
Figure 3(b), 3(e), 3(h) depicts the locations where modifications of the D2 peak relative intensity have been observed. For 104 pulses, the highest changes are observed in the center of the irradiated volume. When the number of incident pulses increase, the glass volume showing changes of the D2 peak relative intensity increases. For 106 and 108 pulses, the highest value of the D2 peak is situated just above the cavity. The relative increase of small rings within the glass network is finally distributed in a much bigger volume for the highest number of pulses (108). If we further compare GIRI and “D2 peak” images in Fig. 3, the relative increase of the D2 peak intensity is observed over all the volume where the GIRI has been modified. For 106 and 108 laser pulses, the highest increase of the D2 peak relative intensity is correlated with the augmentation of the GIRI up to 1.6 in the upper part of the irradiated volume.
The molecular oxygen spectral line (1550 cm−1) is identified in the irradiated zone (see Fig. 3(c), 3(f), 3(i)). The highest oxygen concentration is observed for 104 pulses and irradiance of 4.5 TW.cm−2. When the pulse number increases, the concentration of molecular oxygen is decreased by a factor 10. It is worth to note, that dioxygen is situated in the upper part of the cavity and its position does not change from 104 to 108 pulses (see Fig. 3(c), 3(f), 3(i)). In this case there is no surface nanofibers but the formation of a subsurface cavity.
Figure 4 presents the Raman mapping of the modifications for different incident irradiance (from 3.0 to 5.9 TW.cm−2 per pulse) and 104 pulses per site. For irradiance just slightly above the material modification threshold (e.g. 3.0 TW.cm−2 per pulse), only a small decrease of the GIRI signal (0.9) can be distinguished (see Fig. 4(a)) which is correlated in space with an increase of the D2 peak relative intensity (see Fig. 4(b)). When the incident irradiance increases, we can identify both a GIRI decrease in the center and appearance of two higher density lobes with GIRI increasing up to 1.2 (see Fig. 4(d)). The “D2 peak” map is similar as in the 3.0 TW.cm−2 per pulse case (see Fig. 4(e)). One can distinguish the molecular oxygen appearing for the irradiance of 4.5 TW.cm−2 per pulse. Once we increase the incident irradiance the nanofibers are formed (see Fig. 1 and Fig. 4(g), 4(h), 4(i)). Raman micro-spectroscopy does not provide spatial resolution to investigate the nanofibers more in detail.
#246147 Received 20 Jul 2015; revised 19 Oct 2015; accepted 19 Oct 2015; published 9 Dec 2015 © 2015 OSA 1 Jan 2016 | Vol. 6, No. 1 | DOI:10.1364/OME.6.000079 | OPTICAL MATERIALS EXPRESS 86
Fig. 4. Raman mapping of the modifications for 104 pulses and different pulse irradiances.
Columns 2, 3, and 4 are the GIRI, the D2 peak and the molecular oxygen peak (1550 cm−1),
respectively, and lines 2, 3, and 4 correspond to 3.0 TW.cm−2, 4.5 TW.cm−2, 5.9 TW.cm−2 pulse
irradiances, respectively. All images are in µm. Zero in the left axis corresponds to the surface. Femtosecond laser beam profile is present by red dotted curves.
The zone showing a GIRI decrease is much larger than for 4.5 TW.cm−2 per pulse. The high value of GIRI is composed of two lobes forming the glass surface above the irradiated volume. This has not been observed for other irradiances and number of pulses. The local piercing of the cavity can be observed as a minimum of GIRI between these two red regions (highly increased GIRI). However, it appears less dense than the cavity in the volume certainly because of the pierced zone size which is below the micrometer and thus at the limit of our Raman microscope spatial resolution. In this case, we observe the highest increase of the D2 peak relative intensity; at least three times higher than for the other irradiation conditions. Molecular oxygen is no more present in the cavity (see Fig. 4(i)).
4. Discussion
When exposed to femtosecond pulses with a high energy density fused silica undergoes an optical breakdown. In the material bulk, voids with a low index core and a high index shell are formed [7, 35]. The formation of such voids is due to a sequence of processes occurring at different time scales. Within the first picosecond, photo-ionization via electron tunneling or multiphoton ionization and electron avalanche followed by electron-lattice energy transfer takes place. This result in a typical heating up to thousands of Kelvin for nano-joule energy focused down to several microns. After one hundred of picosecond, thermodynamic and hydrodynamic processes gradually start [6, 7, 35–38]. Moreover, for high repetition laser systems (> 1MHz), the time between two subsequent pulses is low as compared to duration of heat diffusion in the material. This leads to a local heat accumulation. We have estimated a
#246147 Received 20 Jul 2015; revised 19 Oct 2015; accepted 19 Oct 2015; published 9 Dec 2015 © 2015 OSA 1 Jan 2016 | Vol. 6, No. 1 | DOI:10.1364/OME.6.000079 | OPTICAL MATERIALS EXPRESS 87
temperature in a range 3500 to 6000 K from in situ black-body like emission measurement of plasma during femtosecond irradiation (not shown here). For such condition SiO2 is expected to be above melting and vaporization point, which imposes consequently high-pressure (in the order of GPa) conditions due to the confinement [39].
In the configuration where the laser beam is focused just beneath the surface, the material is considered as semi-infinite, since a low amount of matter is present above the focusing voxel. The heat diffusion leads to a decrease of the rigidity (viscosity) of the surrounding material, but in a stronger way between the voxel and the surface. As the temperature increases during the laser exposure, the pressure exerted by the melted material on the edges of the cavity leads to the breaking at different places of the matter between the melted material and the surface. These preferential sites where the material breaks present certainly a higher amount of defects such as color centers. As a consequence, on these sites, the temperature and the pressure are higher. Similarly as a fluid under pressure, the ejected melted material forms a jet, which undergoes a quenching more or less rapid, depending on the jet diameter. Because of the high repetition rate of the laser, the material is kept heated, enabling the weaving of a high length fiber.
Figure 5 sketches the evolution of silica modification under sub-surface laser irradiation in cumulative regime.
Fig. 5. Caption description: illustration of the evolution of silica under laser irradiation for an increasing number of pulses, including normal-density (grey color), high-density (orange shell) and low-density (white core) areas. (a) Pristine material with the initial focused beam. (b) Creation of a low-density volume at the focusing position (depth z = 0), surrounded by an over-densed shell, embedding laser-induced strains (grid). (c) Translation of the focusing position z in the forward direction, leading to a translation of the low-density area. Note that the previously induced low-density area at the initial focus point has typically retrieved its initial density, while it highly keeps the memory of the laser modification and accumulated strain. Such specific silica with expansion and recompression history seems to be where most of the molecular O2 appears. (d) On-going process of moving focus in the forward direction, and the
associated effects of both local densities and local strains, with additional elastic-plastic deformations that lead to the formation of a dome at the surface. (e) On-going process of moving focus in the forward direction, with partial destruction of the dome at the surface leading to the complete release of the produced molecular oxygen.
Laser beam waist position and homogeneous pristine fused silica is drawn in Fig. 5(a). The first step is the creation of a low-density volume at the focusing position. As observed for 104 pulses and irradiances of 3.0 and 4.5 TW.cm−2, laser modifications are strongly localized and, similarly to bulk interaction, there is a small influence of surface effects (Fig. 4(a) and sketched in Fig. 5(b)). An excess of material has been pulled off from the center to the periphery, thus creating a densified zone surrounding the central low-density one. In these conditions, i.e. at the early stage of the cavity formation, the maximum of molecular O2 has #246147 Received 20 Jul 2015; revised 19 Oct 2015; accepted 19 Oct 2015; published 9 Dec 2015 © 2015 OSA 1 Jan 2016 | Vol. 6, No. 1 | DOI:10.1364/OME.6.000079 | OPTICAL MATERIALS EXPRESS 88
been observed. As reported by Lancry et al., the presence of molecular oxygen in the low-density part of the cavity denotes the occurrence of soft Coulomb explosions as part of the photoionization processes. Coulomb nano-explosion is believed to generate nanoporous silica under femtosecond irradiation [15]. In the early phase of the thermodynamic process, oxygen dissociation from the silica network takes place due to the spatial charge separation [7, 16, 40]. Juodkazis et al. [41] via synchrotron X-ray diffraction demonstrated the separation between O–O and Si–Si pairs in a single shot experiment. Indeed, according to Lancry et al. [15], there exist two types of molecular oxygen. The first is free and is detected at 1556 cm−1. The second is dissolved within the glassy network and is peaked at 1549 cm−1, which is the case in our experiments. Such an effect of charge separation and of the detection of molecular oxygen may be a very general behavior during the modification of oxide glass networks, but also during the sub-sequent physico-chemical relaxations, since it has also been demonstrated in germanium glass [16].
From pulse to pulse, the laser focus is starting to move forward due to optical defocusing of the void thus causing the translation of the low-density zone in the same direction (Fig. 5(c)). It is worth to mention, that the previously laser-induced low-density area at the initial focus point has retrieved its initial density. Nevertheless, as observed on the Raman mapping showing the increase of D2 rings in the glass network, it still conserves the expansion and recompression history of the laser modification and further induced constrains and accumulated strain. Molecular O2 remains in this particular zone, its location does not move from the low-density volume but its concentration decrease.
Further translation of the focus position in the forward direction leads to a translation of the low-density area in the same direction. This effect associated with local densities and local strains and amplified with additional elastic-plastic deformations conducts to the formation of a dome at the surface (Fig. 5(d)). The lifting up of the surface is certainly caused by a sub-surface softening or melting and the effect of pressure induced by the cavity expansion, which creates a surface dome, formed of densified silica [42]. The high densification of the surface is confirmed by the 60% increase of Raman signal observed in this dome. As mentioned above such an increase should be linked to a combined effect of a density and Raman cross section augmentations. It is then difficult to determine accurately the real density changes. Nevertheless, the increase of Raman signal observed is sufficiently important to certify that the augmentation of density at the surface is significant.
If the incident irradiance increases above 5.0 TW.cm−2, the dome is finally pierced. Indeed, high energy density per femtosecond laser pulse allows reaching critical temperature and pressure condition for which the micro-explosion cannot be confined. The cavity expansion almost reaches the surface. The densified silica surface shell is pierced, this situation coincide with the observations of nanofibers.
One should note that for all irradiated spots with irradiance lower than 5.0 TW.cm−2, the increase of D2 Raman peak relative intensity remain almost constant independently to the irradiation parameters, only the affected volume change. However, for irradiation conditions for which nanofibers are formed, Raman data shows that the quantity of three and four member rings in the glass network is three times more important than for the other irradiation condition. In our set of experiment, only the final state of the material is characterized. Indeed, accumulated transient changes during laser exposure result in a final permanent state of the material, when the laser exposure is stopped. The study of the final state of the material modified by multiple laser pulses (104 – 107) can be seen an instant picture (stroboscopic images) of the transitional material state for the total irradiation by 108 pulses at the same irradiance. Thus, structural modifications observed can be interpreted as plastic deformations in SiO2 induced under temperature and pressure constraints. The gap observed in the structural changes when comparing irradiance below and above 5.0 TW.cm−2 (in our focalization conditions) tends to prove that a threshold may exist which affects considerably
#246147 Received 20 Jul 2015; revised 19 Oct 2015; accepted 19 Oct 2015; published 9 Dec 2015 © 2015 OSA 1 Jan 2016 | Vol. 6, No. 1 | DOI:10.1364/OME.6.000079 | OPTICAL MATERIALS EXPRESS 89
the laser induced pressure. This could correspond to the first order transition to warm dense matter.
5. Conclusion
The present study showed that femtosecond laser-induced sub-surface modifications in fused silica could lead to the generation of nanofibers in the sub-surface micro-explosion regime. Such fibers were formed thanks to the cumulative behavior of the high repetition rate regime, since the resulting extreme local pressure of the shock wave led to the local piercing of the low-viscosity modified material and to the ejection of nanofibers with small diameters very high aspect ratios. Furthermore, structural modifications and cumulative effects were investigated by means of confocal Raman spectroscopy. In this framework, we evidenced the formation of molecular oxygen in low-density areas of the cavity, which could be attributed to the formation of highly-constrained nanoporous silica glass. Such behavior resulted from the spatial charge separation of oxygen and the glass network cations (namely the silicon atoms, here in Silica) in the laser-induced out-of-equilibrium plasma. This may be a general sequence of phenomena in oxide glasses, being at the origin of the physic-chemical modifications and relaxations of the matrix network. Additionally, we have observed a moving focus effect by increasing the number of cumulated pulses, which contributes to the formation of a dome at the surface and the potential piercing of the surface. It mostly lead to the local inscription of the history of glass modifications, with an initially high-constrained and low-density focus voxel being followed by a subsequent modification with a highly-constrained but re-densified volume (close to the initial glass density).
The detailed analysis of correlation between the Raman measurements and the structural modifications led to a better understanding of the glass modification history, to achieve better conditions for the formation of nanofibers in a high repetition rate cumulative regime of high-pressure elastic-plastic sub-surface micro-explosions.
Finally, such observations should be extended to impurity-doped silica as with rare-earth ions or transition elements as noble metal [43]. This opens interesting perspectives from both fundamental and applicative point of views, with the understanding of the physic-chemical influence of the introduced defects and with the potential optimization of the creation of nanofibers. Indeed, addressing tailored glass matrices may give access to nanofibers with additional fluorescence optical properties for augmented sensing applications.
Acknowledgments
Financial support from the projects “FELINS” and “ARCHIVE & FORGET”, Region Aquitaine are gratefully acknowledged. This study has been carried out also with financial support from the French State, managed by the French National Research Agency (ANR) in the frame of “the Investments for the future” Programme IdEx Bordeaux – LAPHIA (ANR-10-IDEX-03-02). The authors also thank the CREMEM for the SEM images.
#246147 Received 20 Jul 2015; revised 19 Oct 2015; accepted 19 Oct 2015; published 9 Dec 2015 © 2015 OSA 1 Jan 2016 | Vol. 6, No. 1 | DOI:10.1364/OME.6.000079 | OPTICAL MATERIALS EXPRESS 90