Publisher’s version / Version de l'éditeur:
Vous avez des questions? Nous pouvons vous aider. Pour communiquer directement avec un auteur, consultez la première page de la revue dans laquelle son article a été publié afin de trouver ses coordonnées. Si vous n’arrivez pas à les repérer, communiquez avec nous à PublicationsArchive-ArchivesPublications@nrc-cnrc.gc.ca.
Questions? Contact the NRC Publications Archive team at
PublicationsArchive-ArchivesPublications@nrc-cnrc.gc.ca. If you wish to email the authors directly, please see the first page of the publication for their contact information.
https://publications-cnrc.canada.ca/fra/droits
L’accès à ce site Web et l’utilisation de son contenu sont assujettis aux conditions présentées dans le site LISEZ CES CONDITIONS ATTENTIVEMENT AVANT D’UTILISER CE SITE WEB.
Journal of Materials Science, 14, pp. 1681-1693, 1979
READ THESE TERMS AND CONDITIONS CAREFULLY BEFORE USING THIS WEBSITE. https://nrc-publications.canada.ca/eng/copyright
NRC Publications Archive Record / Notice des Archives des publications du CNRC : https://nrc-publications.canada.ca/eng/view/object/?id=2ba6ac3d-8077-419d-a632-f959fcb6935f https://publications-cnrc.canada.ca/fra/voir/objet/?id=2ba6ac3d-8077-419d-a632-f959fcb6935f
NRC Publications Archive
Archives des publications du CNRC
This publication could be one of several versions: author’s original, accepted manuscript or the publisher’s version. / La version de cette publication peut être l’une des suivantes : la version prépublication de l’auteur, la version acceptée du manuscrit ou la version de l’éditeur.
Access and use of this website and the material on it are subject to the Terms and Conditions set forth at
Partial replacement of cement by fly ash in autoclaved products :
theory and practice
7595
National Research Conseil national Council Canada de recherches Canada
0,870
op.
2PARTIAL REPLACEMENT OF CEMENT BY
FLY
ASH
IN
AUTOCLAVED PRODUCTS THEORY AND PRACTICE
;-.
7-77by J. J. Beaudoin and RF. Feldman
Reprinted from
Journal of Materials Science
VoL 14, 1979 p. 1681
-
1693DBR D i d
Paper No. 870
ion of Building Research
Neuf d i f f 6 r e n t e s s o r t e s d e c e n d r e s v o l a n t e s o n t 6 t 6 u t i l i s 6 e s dans une 6 t u d e d e m6langes ciment-cendres v o l a n t e s t r a i t 6 s 2
l ' a u t o c l a v e ( 2 1 6 ' ~ ) . Les m6langes c o n t e n a i e n t 50 pour c e n t d e c e n d r e v o l a n t e ( p a r p o i d s ) . Des B c h a h t i l l o n s de p z t e o n t 6 t 6 pr6parEs pour chaque s o r t e de c e n d r e v o l a n t e dans d e s p r o p o r t i o n s e a u - s o l i d e de 0.22 B 0.45 e t les r e l a t i o n s p r o p r i 6 t 6 m 6 c a n i q u e - p o r o s i t 6 o n t 6 t 6 de'terrnin6es. L e s p r o d u i t s t r a i t 6 s 5 l ' a u t o c l a v e s o n t c a r a c t 6 r i s 6 s a u moyen de p l u s i e u r s t e c h n i q u e s . Des c o r r 6 l a t i o n s l i n 6 a i r e s avec un terme de composition, C/(S+A)-kF, s o n t obtenues pour l e s l o g a r i t h m e s d e s v a l e u r s de module d 1 6 1 a s t i c i t 6 e t d e micro- duret.5 pour une p o r o s i t 6 z.5ro. Une c o r r 6 l a t i o n l i n 6 a i r e e n t r e l e module d ' 6 l a s t i c i t 6 d u s o l i d e poreux e t l e terme decomposi- t i o n , 2-C/(S +A)-kF e s t Ggalement obtenue pour chaque r a p p o r t e a u - s o l i d e . Des c o r r 6 l a t i o n s e n t r e l a m i c r o d u r e t 6 du s o l i d e poreux e t l e terme d e composition, 2-C/(S+A) s o n t s i g n a l 6 e s ( c o u r b e d i f f e r e n t e pour chaque r a p p o r t e a u - s o l i d e ) . ~ ' i m p r 6 - g n a t i o n d e s p r o d u i t s poreux e n t r a i n e un a c c r o i s s e m e n t d e s v a l e u r s du module d 1 6 1 a s t i e i t 6 e t de l a m i c r o d u r e t 6 , e t f o u r n i t u n a u t r e moyen d 1 6 v a l u e r l e s v a l e u r s de c e s p r o p r i E t 6 s pour une p o r o s i t 6 z 6 r o .
J O U R N A L O F M A T E R I A L S S C I E N C E 1 4 ( 1 9 7 9 ) 1 6 8 1 - 1 6 9 3
Partial replacement of cement
by
fly ash in
autoclaved products
-
theory and practice
3 . . 3" *
I -'
J. J. BEAUDOIN, R. F. F E L D M A N
Materials Research, Division of Building Research, National Research Council of Canada,
Ottawa K I A 0 R6, Canada
Nine different fly ashes have been used in a study of autoclaved (216" C) cement-fly ash mixtures containing 50% fly ash (by weight). Paste samples for each fly ash were prepared at water-solid ratios of 0.22 to 0.45 and mechanical property-porosity relations were determined. The autoclaved products were characterized by several techniques. Linear
correlations with a composition term, C/(S
+
A) - k F, were obtained for logarithms ofzero-porosity modulus of elasticity and microhardness values. A linear correlation for
modulus of elasticity of the porous solid and the composition term, 2 - C/(S
+
A)-
kF,was also obtained for each water-solid ratio. Correlations for microhardness of the
porous solid with a composition term, 2 - C/(S
+
A) are reported, a different curve foreach water-solid ratio. Impregnation of the porous products resulted in increased values for modulus of elasticity and microhardness and provided an alternate means of
estimating zero-porosity values of these properties.
1. Introduction
Energy conservation in the building industry is a world-wide concern. As one response to the challenge, engineers and scientists are exploring ways of producing building materials with a mini- mum of energy input, and interest in the use of waste material such as fly ash as a partial replace- ment for Portland cement.in concrete products,
although not new, is growing [I-31
.
There is advantage in adding fly ash to concrete products cured at normal atmospheric conditions or in the autoclave at high temperatures and pressures. In the autoclave, high-pressure steam curing without the addition of finely divided silica produces generally weak, porous bodies consisting of dense, crystalline hydrated material, usually
uC,S hydrate [4]. An optimum amount of finely
divided silica promotes the formation of tober- morite and poorly crystallized CSH(I), generally giving maximum strength. Using fly ash as a source of silica in autoclaved materials may be expected to result in the formation of hydrated products
similar to those formed by adding pure silica [5].
As fly ash is more complex than silica, however,
and contains CaO, A1203, F e 2 0 3 and other impurities, its composition is dependent on the source and operational conditions at each power plant and it is of practical importance to evaluate the effect of composition on the mechanical properties of building products.
In order to predict the properties of autoclaved cement-fly ash mixtures, an understanding is essential of the hydration reactions and of the products formed and their mechanical properties. This can be achieved by studying the modulus of
elasticity (or microhardness)-porosity relations
and correlating zero-porosity values of modulus of elasticity and microhardness with the chemical composition of several fly ash-cement mixtures.
Previous studies of autoclaved Portland cement- silica mixtures have shown that where weak porous matrices are formed (because they consist mainly of dense crystalline products), high strength can be obtained by impregnating these
bodies with sulphur [6]. It was the object of this
study to gain an understanding of the reactions that occur when autoclaving different fly ash- cement mixtures and to develop equations by
TABLE I Chemical analysis of fly ash and portland cement
Fly SiO, Al,O, MgO F e 2 0 , CaO N,O K 2 0 Loss Other C/(S
+
A)*ash on (mole ign. ratio) 1 51.54 25.08 0.16 10.58 4.81 0.49 2.39 4.08 0.87 0.769 2 39.78 22.30 0.27 9.12 16.58 1.61 1.16 1.25 7.93 1.057 3 40.86 21.62 0.28 6.26 22.44 0.53 0.79 0.65 6.57 1.123 4 34.22 19.58 1.16 16.99 7.00 0.51 1.67 18.15 0.72 1.027 5 45.86 25.62 1.29 18.09 7.35 0.55 1.95 0.00 0.00 0.852 6 44.66 22.74 3.31 4.20 14.27 1.68 0.98 0.37 7.79 0.962 7 55.27 22.59 0.94 3.85 12.14 0.34 1.04 0.52 3.31 0.830 8 40.21 19.42 0.38 13.05 3.50 0.61 1.37 13.09 8.37 0.901 9 45.35 20.85 0.42 17.84 3.87 0.59 1.47 1.04 8.57 0.839 PC 20.66 6.22 1.28 2.16 64.45 0.08 1.30 - 3.85 -
*
Includes both fly ash and cement constituentswhich the mechanical properties of any auto- Samples containing fly ash no. 3 cracked during claved fly ash-cement mixture may be predicted. autoclaqng. It was therefore necessary to auto- The potential use of such products impregnated clave fly ash 3 by itself, followed by drying and with sulphur was an additional area of investi- sieving through 100-mesh screen prior to mixing
gation. with cement. The test series using fly ash 3 was
prepared in this manner.
2.
Experimental details2.1. Materials
2.2.2.
Chemical analysis(1) Normal type I Portland cement was used for Chemical analysis was performed by Atomic all mixes; the chemical analysis is presented in Absorption Spectrophotometry using a Perkin-
Table I. Elmer 403 AAS.
(2) Fly ash. Fly ash samples were obtained
from nine different locations; chemical analysis is
2.2.3.
Helium diffusion measurements presented in Table I. The calculated C/(S+
A)* A set of samples having approximately the same mole ratio for each cement-fly ash mixture porosity (32.5%) was chosen for each fly ash for (50150 by weight) is also included in Table I. All helium diffusion measurements. The apparatus and C/(S+
A) mole ratios referred to in this work are procedure for helium diffusion measurements havefor the total cement plus fly ash mixture. been described in detail in previous papers [7,8]
.
(3) Sulphur. Reagent-grade sulphur containing Small spaces or "pores" into which helium does
3 ppm H2 S. not instantaneously flow are, in the first instance, regarded as part of the solid. Subsequent intake of
2.2.
Methods helium with time was recorded. Samples were2.2.1.
Hydration conditioned at 11% r h . prior to diffusion measure-Samples were prepared for autoclaving at water- ments. solid ratios of 0.22, 0.26, 0.30, 0.35, 0.40 and
0.45. The solids for all mixes contained 50%
2.2.4.
Sulphur impregnationPortland cement and 50% fly ash. At each water- Samples used for helium diffusion studies were solid ratio, nine sets of samples were prepared, also used for sulphur impregnation work. Three each utilizing a different fly ash. Mixes were cast discs from each set of samples were impregnated in cube moulds, three cubes for each preparation, using the technique described previously [6]. and moist-cured for 24 h. After demoulding, Modulus of elasticity and microhardness measure- samples were autoclaved at 2 16' C, 2.04 MPa ments were also made on these samples.
pressure, for 3 h . A 32mm core was obtained I
from the cube samples for each preparation. Ten
2.2.5.
Differential scanning calorimeter discs, 1.27 mm thick, were sliced from each core (Dsc)for measurement of modulus of elasticity and Differential thermograms of the samples were
microhardness. obtained by a differential scanning calorimeter - I
*
In cement nomenclature C = CaO, A = Al, 0 , , F = Fe,O,, S = SiO,, and H = H,O.(DSC) supplied as a module to the DuPont 990 thermal analysis system. The heating rate was
20" C min-'
.
Differential temperature was registered at a sensitivity of 0.02 m~ in.-''
Thermograms were obtained in air and in eac4
experiment 20 mg sample was subjected to analysis'.I 2.2.6.Surfacearea
Surface area was obtained with N, as the absorbate by a Numinco-Orr surface-area pore volume analyser. Each sample was dried at 1 lo0 C for 3 h prior to analysis.
2.2.7. X-ray diffraction ( X R D )
X-ray powder photographs were obtained with a Philips camera using a CuKa! source. Relative intensities of the lines were obtained by densi- tometer traces of the powder photographs.
2.2.8. Scanning electron miscroscope (SEM)
Microstructural examination was conducted on fractured pieces of the specimens by means of a Cambridge Stereoscan Mark 2A.
2.2.9. Helium comparison p ycnometry
Porosity was determined using a helium comparison pycnometer. The application of this technique to the hydrated Portland cement system is described elsewhere [9]
.
Solid volume is measured, enabling determination of porosity using the apparent volume calculated from sample geometry. The problem of rehydration encountered when waterdiameter discs 1.3 mm thick, at least three discs for each set of samples. The procedure involves measuring the deflection of a specimen loaded at its centre and supported at three points on the circumference of a circle 2.5 cm diameter [lo]
.
ALeitz microhardness testing machine with a Vickers indenter was used for microhardness measurements, which were made on the discs used for modulus of elasticity measurements and were carried out at 1 1 % r.h. Five hardness measure- ments were made on each disc and three discs were tested for each set of samples.
3.
ResultsThe results will be presented in three sections. The first is concerned with basic physico-mechanical properties of the autoclaved cement-fly ash mixtures and the correlation between these properties and composition of the fly ash and cement. In the second section, the mechanical properties are presented in terms of water-solid ratio as well as a term dependent on composition of the cement-fly ash mixture. In the third section, data are presented illustrating the potential of autoclaved cement-fly ash mixtures for use in
impregnated systems.
3.1. Physico-mechanical properties
3.1. 1. Mechanical property-porosity
relations
The data for all preparations (nine fly ashes) obey the general relation
I Is used as the displacement medium is avoided.
i
Using 1 1% r h. as datum avoids excessive decom- H, E = (Ho ,Eo) ~ X P ( - ~ H , E * P ) position of the hydrates. where H,E refer to microhardness and modulus ofelasticity and p is porosity. The results of linear
2.2.10. Modulus of elasticity and regression analysis are recorded in Table 11.
microhardness Regression lines of log microhardness and modulus
Modulus of elasticity was measured on 3.2 cm of elasticity versus porosity are given in Figs. 1 and
1
TABLE I1 Regression analysis of microhardness and modulus of elasticity versus porosity relationsFly H = H , exp ( - - b H - p ) E = E , exp (- b E - p )
ash
Ho b~ r Eo b~ r
(MPa X lo-' ) (%) (MPa X l o - ) ) (%I
1 60.68 0.028 83.5 26.82 0.015 75.8 2 151.70 0.069 98.3 36.82 0.031 94.5 I 3 342.80 0.061 91.0 53.00 0.035 90.2 I 4 100.00 0.05 1 95.9 25.30 0.026 86.6 5 83.18 0.035 89.3 31.77 0.024 96.6 6 206.55 0.065 97.1 50.15 0.035 97.0 7 66.53 0.034 90.7 43.85 0.033 95.5 8 100.90 0.062 92.7 35.16 0.028 73.3 9 84.34 0.062 90.6 44.67 0.054 91.9 1683
I I I 1 I I 1 N U M B E R S R E F E R T O F L Y A S H P R E P A R A I ' O N S
_._________
e 4 * 6 7 e q * 5 k-
1.633 I I I I J I 1The total helium intake increases with decrease in solid density, as can be seen in Fig. 4; and there is a linear dependence between the logarithm of zero porosity microhardness, Ho , and solid density (Fig. 5). The logarithm of zero porosity micro- hardness also depends linearly on C/(S
+
A) - kF (k = 1.60) (Fig. 6).The logarithm of zero-porosity modulus of elasticity, E o , depends linearly on C/(S
+
A) - kF and the best correlation is obtained with k = 8.00 (Fig. 7). The plot point representing fly ash no. 9 did not appear to conform to the data and was not included in the regression analysis.Equations obtained by regression analysis for the lines plotted in Figs. 3 to 7 are given in Table
Figure 3 Composition term, C/(S
+
A) -kF, versus solid density of autoclaved cement-fly ash mixtures.
3.1.3.
Characterization of hydrated products3.1.3.1. Differential thermal analysis. DSC traces
are presented in Fig. 8, all exhibiting a small quartz peak at 550' C. A small endotherm at
470" C resulting from decomposition of Ca(OH)2
is present for preparations 1, 3, 6 and 7. An endotherm at approximately 100' C, preparations
1, 2 , 4 , 8 and 9, may be due to decomposition of
C-S-H gel.
3.1.3.2. SEM. Scanning electron micrographs for the nine autoclaved cement-fly ash mixtures are presented in Fig. 9. They are generally represen- tative of the microstructure throughout each sample. Preparations 3, 4, 7 and 8 contain fibrous
Figure 4 Total helium intake versus solid
density of autoclaved cement-fly ash mix- tures.
N U M B E R S R E F E R T O F L Y A S H P R E P A R A T I O N S
T A B L E IV Regression analysis for curves plotted in Figs. 3 to 7
Equation Correlation Figure
coefficient , r (%) 1 c / ( s + A) - k F = 0.134 exp (+ 0.7753) 83.0 3 k = 1.60 2 He = 1738 exp (-2.593) 89.2 4 (2.23 < 6 < 2.70) 3 Ho = 0.052 exp (3.226) 90.4 5 4 HO = 3.95 exP (3.89 [C/(S X A) - kF]] 89.4 6 k = 1.60 5 Eo = 18.12 exp {1.10 [C/(S
+
A) - k F ] ) 84.0 7 k = 8.00 5 0 0-
II I I I I I Figure 5 Zero-porosity microhardness
0
d 4 0 0
-
- versus solid density of autoclavedX
rn N U M B E R S R E F E R T O 1 cement-fly ash mixtures.
2
300 - F L Y A S H P R E P A R A T I O N S 0 I * 2 0 0 m VI u Z D PI 4 I 0 oc 100-
u I s o-
/.,*
/'
8-
I
-
7 0 - 7 0-
C-
m 6 0 - 0 / * I *1 50-
0. o 4 0 - DI w N 3 0 , I I I I I I I 2 . 0 2.1 2.2 2.3 2.4 2.5 2.6 2.7 2.8-
'= a o o - N U M B E R S R E F E R T O x F L Y A S H P R E P A R A T I O N S rn 2 3 0 0-
d I m' 2 0 0 - Ln w Z D PI 4 I 8 U I00 - 0 PI 7 0 0 0. 6 0 I( = 1.40 0 1 5 0 N 4 0 I 1 t I 0.70 0.80 0.90 1.00 1.10 1 , 2 0 C COMPOSITION TERM, - - kF S + A 7 0 p 7' I I I 0 N O T I N C L U D E D I N 6 0.
R E G R E S S I O N A N A L Y S I S n 2 d W 5 0 -K
0 C m 2 4 0 - 8 m 3 2 3 D $ 30 - ?= - L n k = 8.00 8 0 a N U M B E R S R E F E R T O 0 rz F L Y A S H P R E P A R A T I O N Sz
20 I I I 0. 20 0.40 0.60 0.80 1.00 C COMPOSITION TERM,-
- kF S + AFigure 6 Zero-porosity microhardness versus composition Figure 7 Zero-porosity modulus of elasticity versus com- term, C/(S
+
A) - kF. position term, C/(S+
A) - kF.N U M B E R S R E F E R T O material. These fibres are generally flat, elongated F L Y A S H P R E P A R A T I O N S plates having Ca/Si ratios of 0.8 to 1.00, as deter-
mined by energy dispersive XRD. Preparation 3
has predominantly the morphology presented in the micrograph and a significant number of sites
1 rncal sec-' have Ca/Si ratios of 1.4 to 2.2, suggesting that
high lime products such as aC2 SH are present. The remaining preparations have surface textures that appear to be largely amorphous. The smooth areas
in preparations 6 and 7 represent C-S-H material
- not Ca(OH), - with Ca/Si ratios up to 2.0.
3.1.2.3. XRD. X-ray diffraction densitometer traces are plotted in Fig. 10, where tobermorite
~ ~ I I I I I may easily be detected from the lines of this ~ ~ I ~ ~ I
0 5 0 1 0 0 1 5 0 2 0 0 2 5 0 3 0 0 350 4 0 0 4 5 0 5 0 0 5 5 0 600
T E M P E R A T U R E . " C phase - 1 1.33, 3.09, 2.94
a
and others. Relativelyintense diffractions attributed by Sauman [5] to
Figure 8 DSC traces of autoclaved cement-fly ash the hydrogarnet and
mixtures. by lines of the remaining components 5.37, 5.01,
-
+I
-
has a significantly reduced intensity. Preparations-
N U M B E R S R E F E R T O 2 and 3 have the highest densities, 2.46 and F L Y A S H P R E P A R A T I O N S 2.76 g cm-3 ; this is indicative of high-density
xonotlite. aC2S hydrate - lines at 2.42, 2.62 and others - contributes significantly to high-density
values. Remaining lines for aC2 S hydrate overlap with lines for other phases.
Sauman [5] has argued that the hydro- garnet phase in autoclaved cement-fly ash mixtures probably has the general composition C3 A1 -,,F,S,H, -2, due to Fe-ions in the fly ash
glass.
3.2. Practical evaluation: effect of water-
solids ratio and composition on mechanical properties
Modulus of elasticity and microhardness data are plotted against C/(S + A ) in Figs. 11 and 12. In
, each there is a family of curves, each curve
representing a different water-solid ratio, the lowest water-solid ratio curve having highest values of modulus of elasticity or microhardness. Each curve has at least two maxima and two minima. It is noteworthy that plot points (Fig. 11) for fly ashes 4, 5 , 8 and 9 correspond to minimum
Figure 10 X R D densitometer traces of autoclaved positions and have maximum F e 2 0 3 contents. In
cement-fly ash mixtures.
Fig. 12 (microhardness), plot points having maxi- mum positions are for fly ashes 5 and 6. Fly ash 5 4.37, 2.75, 2.52, 2.18, 2.00 8 are also visible. has highest Fe, 0, content, and fly ash 6 a very Unreacted quartz is present in all samples. No low one. It is apparent that Fe203 content has a significant quantities of still uncombined Ca(OH)2 direct effect on modulus of elasticity values. The were detected. Xonotlite may be present, as the effect on microhardness will be discussed later. lines at 3.09 and 2.00
A
are strong in preparations Linear correlations were obtained between 2 and 3, although the 11.3A
line for tobermorite modulus of elasticity and a composition term30 I I I I I I 1 I ", 0 x 2 5 -
-
a H +-
L 1 0 --
0 in 3 2 3 a 5 - 0 B 1 N U M B E R S R E F E R T O-
F L Y A S H P R E P A R A T I O N SFigure 11 Modulus of elasticity o I 1 I I I I 1 I
versus composition term C/(S
+
A) 0. 7 5 0. 8 0 0. 85 0 . 9 0 0 9 5 1 00 1 , 0 5 1 10 1. 1 5 L 20 for autoclaved cement-fly ash mix- Ctures. C O M P O S I T I O N T E R M . - S ' A 1688
60 I e I I I I I I Figure 12 Microhardness versus
-
;. 55 I*., composition terms C/(S
+
A) for0 /
'.
-
-
50 - W 1 S autoclaved cement-fly ash mix-x 'k
-
<--.
a. 2 2 tures. m 4 5-
1
4 0 - 30 00.35 A 0 . 4 0-
" l o-
N U M B E R S R E F E R T O 5-
F L Y A S H P R E P A R A T I O N S-
C C O M P O S I T I O N T E R M ,-
S + A[2 - C/(S
+
A) - kF] ; the regression lines are medium Fez O3 content. The maximum is associ-plotted in Fig. 13 for each water-solid ratio. The ated with fly ash 6 for w/s = 0.22 and with fly ash significance of the composition term will be 5 for the other w/s ratios. Fly ash 6 has low discussed at length later. Equations obtained from Fe203 content and fly ash 5 has high F e z 0 3 linear regression analysis are tabulated in Table V. content. These observations will be discussed later. The value of k = 4.80 is the value that gives the
best correlation for the data analysed.
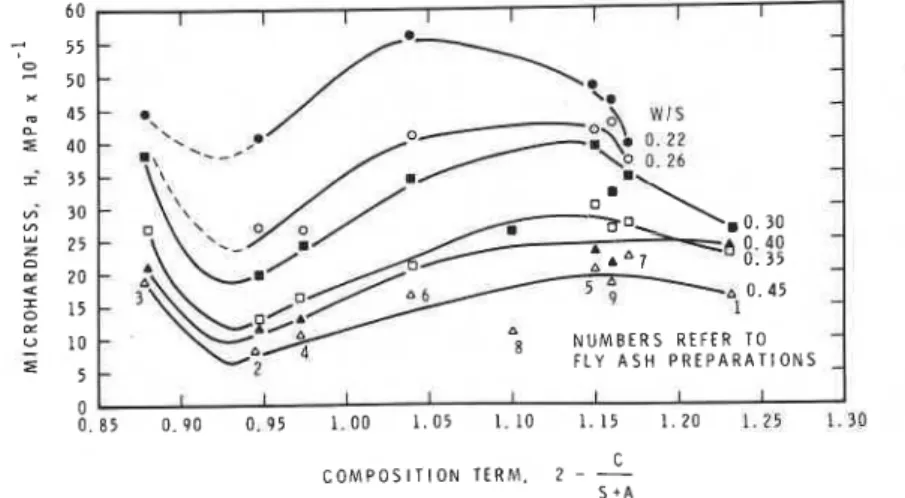
Microhardness is plotted against [2
-
C/(S+
A)]in Fig. 14. The addition of i: kF to the composition term did not significantly affect the nature of the relation. There is a separate curve for each water- solid ratio, with microhardness values for the lowest w/s ratio being the highest. The curves exhibit a minimum at [ 2
-
C/(S+
A)]"
0.93; then microhardness increases to a maximum for,
2 - C/(S+
A) between 1.04 and 1 .lo. The mini-I mum is associated with fly ash 2, which has
T A B L E V Regression analysis of modulus of elasticity versus composition term
w/s Regression equation Correl. coeff., r (%) N U M B E R S R E F E R T O F L Y A S H P R E P A R A T ! O N S I C C O M P O S I T I O N TERM. 2 -
-
- kFI
S ' AFigure 13 Modulus of elasticity versus composition term, 2 - C/(S
+
A)-
kF, for autoclaved cement-fly ash mixtures.3.3. Impregnated systems
3.3.1.
Sulphur impregnationIt has been shown that a mixing rule can be used to determine the modulus of elasticity of a sulphur- impregnated porous body and that the impregnated body behaves like a homogeneous two-phase composite [ 6 ] . The equation for the composite, derived from Reuss's model is
where E, is the modulus of the composite, V 1 and
V2 the volume fraction of the matrix and impreg-
nant, respectively, and Eo, and Eo2 the moduli of the bulk non-porous matrix material and impreg- nant, respectively. Values for
Eel
(Table II), obtained by extrapolation of the log modulus of elasticity versus porosity relations, were used to calculate Ec from Equation 1 . Eo2 for sulphur is13.9 x lo 3 MPa [1 1]
.
The values of Ec calculated from Equation 1 compare favourably with the measured values of Ec and the results are recorded in Table VI. The ratio of modulus of eelasticity of the composite to modulus of elasticity of the unimpregnated porous body Ec/Eu (Table VI) is1.15 for fly ash 1 preparations and increases to 2.51 for the fly ash 4 preparation. Increases in
microhardness ratio Hc/Hu are also tabulated in Table VI and range from 1.49 to 3.92, with one value as high as 5.5 1.
4.
DiscussionMechanical property-porosity relations obtained for each fly ash indicate that there is no unique relation for autoclaved cement-fly ash mixtures. Correlations were obtained for zero-porosity modulus of elasticity, Eo , or microhardness, Ho , of the non-porous matrix and density or a compo- sition term, C/(S
+
A) - kF. To understand thesignificance of the composition term it will be necessary to comment briefly on the general state of existing knowledge of the lime-silica reaction under autoclaved conditions.
On the basis of SEM, DSC and XRD evidence it appears that the fly ash has nearly all reacted. There was only a small amount of Ca(OH)2 detected and no residual fly ash particles were observed. It is assumed, therefore, that under the present autoclave test conditions the reactivity of the fly ash at room temperature is not of major importance.
T A B L E VI Modulus of elasticity and microhardness measurements for sulphur-impregnated fly ash prep- arations
Fly ash E, (MPa X EcIEu H,/H,
Eqn. 1 Measured 1 23.82 22.25 1.15 3.09 2 26.78 30.27 2.11 3.92 3 33.85 30.50 1.83 1.49 4 21.05 23.68 2.51 3.11 5 24.78 24.39 1.64 2.53 6 30.79 24.60 1.56 2.42 7 30.39 24.58 2.15 3.01 8 26.22 24.94 1.70 5.51 9 29.06 27.22 1.57 3.39
Helium diffusion experiments showed that helium intake decreased as the density of the hydrated product increased, indicating that less helium was able to enter the structure. Zero- porosity modulus of elasticity and microhardness increase as density of the hydrated product increases, probably due in part to the change in structure indicated by the helium measurements.
In the second section, mechanical properties of the porous bodies were correlated with a compo- sition term, [2 - C/(S
+
A)-
kF].
This too, will be elaborated on subsequently, for it is necessary to comment first on lime-silica reactions under autoclave conditions.In the third section, data demonstrating the potential use of autoclaved cement-fly ash mixtures for sulphur-impregnated systems was presented. This too will be discussed further.
4.1. Lime-silica reaction
The initial reaction on the silica surface yields a lime-rich, poorly crystallized mineral similar to C-S-H(I1). When the overall Ca/Si ratio is low (below 1.0), this reaction proceeds until all the lime is used. The following sequence of reactions will eventually take place, C-S-H(I1) + C-S-H
(I) -+ tobermorite + xonotlite. When the overall
Ca/Si ratio is greater than 1 .O, the C-S-H (11) crystallizes to other lime-dch silicates, the most common being aC2 S hydrate.
4.2. Composition terms
Much work has revealed that at normal water- cement ratios, bodies formed with large quantities of aC2S hydrate (CIS = 2) have relatively high porosities; the aC2S hydrate bonds poorly and these bodies have low strength. Considering this,
a term to correlate with strength of porous bodies
would be 2 - CIS. The capacity of the alumina to
combine with some CaO and thus effectively reduce the available CaO for reaction with Si02
led to consideration of the parameter 2 - C/(S
+
A). It is recognized that alumina may enter the lattice of the tobermorite type compounds and affect their properties, and together with other impurities, even affect crystallinity. In this work the quantities, C, S, A, F were taken as the total composition of the cement plus fly ash. Thus if there is any proportion of any constituent not available for reaction this approximation will be in error. The observation that the minima for
modulus of elasticity versus C/(S
+
A) corre-sponded to fly ashes having maximum Fe203 content, and that maxima corresponded to fly ashes having minimum Fez O3 contents, suggests that F e 2 0 3 was detrimental to high values of modulus of elasticity and that a better correlation
would be obtained with the term 2 - C/(S
+
A)-
kF. Correlation of modulus of elasticity with this term yields straight lines with greatly improved correlation coefficients, confirming the detrimental nature of the iron.
and Ho increased as CIS of the hydrated product increased. In this study, Eo and Ho increased as
the term C/(S
+
A) - kF increased. It is apparentthat Fe203 has a detrimental effect on the strength of the solid phase, and that the constant k is significantly larger for the curve correlating Eo
with composition (k = 8.00 for Eo curve and k =
1.60 for Ho curve). It is suggested that the presence of Fe203 in the polycrystalline solid phase influences the effect that grain boundaries and dislocations have on the mechanical properties of the solid; the influence of F e 2 0 3 is apparently much greater for modulus of elasticity than for microhardness. Fe203 may not alter or modify significantly the failure processes associated with existing crack tips or flaws and hence not signifi- cantly affect microhardness measurement involving failure processes. The measurement, however, of modulus of elasticity, which does not involve a failure process, may receive a contribution due to the compressibility of Fez 03.
4.4. E, H, w/s ratio and composition
Modulus of elasticity and microhardness data
were plotted against [2 - C/(S
+
A) - kF].
Formodulus of elasticity measurements the value of
k = 4.80 gave the best linear correlation at each
water-solid ratio. The effect of Fe203 on
modulus of elasticity was apparently detrimental.
The value of k = 0.0 for microhardness results
indicated that Fez O3 had little effect on micro- hardness of the porous bodies. The shape of the microhardness curves (Fig. 14) is probably affected by the relative contributions of zero-porosity microhardness, H o , of the solid phase and strength of the interparticle bonds. The role that these
4.3. E,, H, and composition
Zero-porosity modulus of elasticity, Eo , and
microhardness, H, , of . high-density crystalline
minerals such as aC2 S hydrate are high, although porous bodies composed mainly of these minerals have very low modulus of elasticity and micro- hardness values. Elimination of porosity consider- ably reduces the contribution of interparticle bond to strength of the body. Previous studies of auto- claved cement-silica systems indicated that Eo
.,
N U M B E R S R E F F R F L Y A S H P R E P A R C C O M P O S I T I O N T E R M . 2 --
S + AFigure 14 Microhardness versus composition term 2 - C/(S
+
A) for autoclaved cement-fly ash mixtures.factors play in determining strength of porous bodies is not well understood.
Previous comments on effect of Fez O3 are also applicable.
4.5. Sulphur impregnation
In a previous study, autoclaved cement-silica mixtures with highest values of Eo and Ho were superior matrices for sulphur-impregnated system [6]
.
In the present studies the autoclaved products, when impregnated with sulphur, formed two-phase composites having increased values of modulus of elasticity and microhardness. The Reuss' mixture rule provided reasonable estimates of the elastic moduli of the sulphur-impregnated composites.Increases in the ratios E J E , and HJHU also depend on Eo and Ho as well as on the properties of the unimpregnated porous body, Eu and H,. The results of this study indicate that, in general, autoclaved cement-fly ash preparations are potentially superior (to room-temperature hydrated cement systems) as binders in sulphbr-impregnated cementitious systems in terms of mechanical behaviour. This is principally due to the higher Eo and Ho values for these systems. It was observed that factors that affect the magnitude of Eo and
Ho for autoclaved cement-fly ash mixtures are as
follows: C/(S
+
A) mole ratio, Fe203 content and density of the hydrated product. Density values depend on phases present in the hydrated product; it has been concluded that an optimum mixture of dense crystalline phases and less dense, poorly crystallized phases exists, giving maximum strength [4, 121. Fly ash preparation 3, which has the highest C/(S+
A) mole ratio, highest product density (2.76 g ~ m - ~ ) and greatest values of Eo and H o , appears to have the best potential as a matrix for a sulphur-impregnated building material. It should be pointed out that for unimpregnated systems, those preparations that have high values of Eo and Ho may have low values of E and H a t a given porosity. This suggests that when impreg- nation is not being considered, fly ash 9, for example, would be preferable because equal strengths at lower porosities and probably less permeable concrete are obtained in practice.Factors affecting the durability of sulphur- impregnated porous bodies have been investigated [13] ; all the systems studied were permeable to water and other vapours, whether large increases in mechanical properties were achieved on impreg- nation or not. Matrices with specific surface areas
of approximately 20mZ g-' or less, however, performed well (small expansion with little or no cracking) when exposed to water or other vapours. The specific surface areas of the nine fly ash preparations in this study range from 17.0 to 25.5 m2 g-'
.
Their durability on exposure to water is a subject for further study.5. Conclusions
(1) Modulus of elasticity of porous autoclaved cement-fly ash mixtures, using nine different fly ashes, can be predicted by a relation that depends on w/s ratio and C, S, A and F content and varies directly with the composition term 12 -C/(S
+
A) - kF] .
(2) Microhardness of porous autoclaved cement-fly ash mixtures depends on w/s ratio and the C, S and A content. The F content appears to have little effect on microhardness measurements. A continuous relation exists between microhard- ness and the composition term [2 - C/(S
+
A)].
(3) Zero-porosity modulus of elasticity, Eo
,
and microhardness, Ho , of autoclaved cement-fly ash mixtures depend on C, S, A and F content of the mixture. The logarithms ofEo and Ho vary directly with the composition term C/(S+
A) - kF, which in itself is dependent on the density of the hydrated product. The value of k is much larger for the Eo relation than for the Ho relation, indicating that F has a significant effect on Eo and a minor effect on H o .(4) Modulus of elasticity and microhardness of autoclaved cement-fly ash mixtures increase when the mixtures are impregnated with sulphur.
(5) Autoclaved cement-fly ash mixtures having high zero-porisity modulus of elasticity and micro- hardness have potentially the most suitable matrix for sulphur impregnation.
(6) Chemical analysis of fly ash can serve as a means of providing data enabling the practitioner to predict the strength of autoclaved cement-fly ash mixtures.
Acknowlegements
The authors wish to thank J. J. Wood for his fine work in performing most of the experiments; and G. M. Polomark who carried out the chemical analysis. Thanks are also due to T. G. Clendenning and M. T. Loughborough of Ontario Hydro for providing the fly ash samples and for helpful discussions. This paper is a contribution from the Division of Building Research, National Research
Council of Canada, and is published with the approval of the Director of the Division.
References
1. E. E. BERRY, CANMET Report 76-25 (1976) p. 60.
2. R. C. VALORE, Laboratory evaluation of fly ash and other pozzolans for use in concrete products, Proceedings, Second Ash Utilization Symposium, Pittsburgh (US Department of the Interior, Washing- ton DC, 1970) p. 171.
3. F. MASSAZZA, I1 Cemento 1 (1976) 3.
4. J. J . BEAUDOIN and R. F. FELDMAN, Cem. Concr. Res. 5 (1975) 103.
5. Z. SAUMAN, Study of reactions between'Ca0 or 3CaO-SiO, and 0-2CaO.Si0, and power station fly ashes under hydrothermal conditions, Fifth Inter- national Symposium on the Chemistry of Cement, Tokyo, Paper IV-17 (Cement Association of Japan, Tokyo, 1968) p. 122.
6. R. F. FELDMAN and J . J. BEAUDOIN, Structure and properties of porous cement systems and their
modification by irnpregnants, Proceedings, Con- ferencv on Hydraulic Cement Pastes: Their Structure and Properties, Sheffield (Cement and Concrete Association, Wexham Springs, Slough, 1976) p. 150. 7. R. F. FELDMAN, Cern. Concr. Res. 4 (1973) 1.
8. Idem, ibid. 1 (1971) 285.
9. Idem, Cement Technol. 3 (1972) 5.
10. P. I. SEREDA, R. F. FELDMAN and E. G. SWENSON, Effect of sorbed water on some mechan- ical properties of hydrated portland cement pastes and compacts, Highway Research Board, Washington, Special Report 9 0 (1966) p. 58.
11. J. J. BEAUDOIN and P. J. SEREDA, Powder Technol. 13 (1976) 49.
12. J . M. CRENNAN,S. A. S. EL-HEMALY and H. F. W. TAYLOR, Cern. Concr. Res. 7 (1977) 493.
13. R. F. FELDMAN and J . J . BEAUDOIN, ibid. 8 (1978) 273.
This publication is being distributed by the Division of Building R e s e a r c h of the National R e s e a r c h Council of Canada. I t should not b e reproduced i n whole o r i n p a r t without p e r m i s s i o n of the original publisher. The Di- vision would be glad to b e of a s s i s t a n c e in obtaining s u c h p e r m i s s i o n .
Publicatione of the Division m a y b e obtained by m a i l - ing the a p p r o p r i a t e r e m i t t a n c e ( a Bank, E x p r e s s , o r P o s t Office Money Order. o r a cheque, m a d e payable to the R e c e i v e r G e n e r a l of Canada, c r e d i t NRC) to the National R e s e a r c h Council of Canada, Ottawa. KIA OR6. Stamps a r e not acceptable.
A l i s t of a l l publications of the Division i s available and m a y be obtained f r o m the Publications Section, Division of Building R e s e a r c h , National R e s e a r c h Council of Canada, Ottawa. KIA OR 6.