Publisher’s version / Version de l'éditeur:
ASHRAE Journal, 5, 12, pp. 65-73, 1963-12
READ THESE TERMS AND CONDITIONS CAREFULLY BEFORE USING THIS WEBSITE. https://nrc-publications.canada.ca/eng/copyright
Vous avez des questions? Nous pouvons vous aider. Pour communiquer directement avec un auteur, consultez la
première page de la revue dans laquelle son article a été publié afin de trouver ses coordonnées. Si vous n’arrivez pas à les repérer, communiquez avec nous à [email protected].
Questions? Contact the NRC Publications Archive team at
[email protected]. If you wish to email the authors directly, please see the first page of the publication for their contact information.
NRC Publications Archive
Archives des publications du CNRC
This publication could be one of several versions: author’s original, accepted manuscript or the publisher’s version. / La version de cette publication peut être l’une des suivantes : la version prépublication de l’auteur, la version acceptée du manuscrit ou la version de l’éditeur.
Access and use of this website and the material on it are subject to the Terms and Conditions set forth at
Air leakage and pressure measurements on two occupied houses
Tamura, G. T.; Wilson, A. G.
https://publications-cnrc.canada.ca/fra/droits
L’accès à ce site Web et l’utilisation de son contenu sont assujettis aux conditions présentées dans le site LISEZ CES CONDITIONS ATTENTIVEMENT AVANT D’UTILISER CE SITE WEB.
NRC Publications Record / Notice d'Archives des publications de CNRC:
https://nrc-publications.canada.ca/eng/view/object/?id=44df4246-48ad-4c22-a7b8-c121d79a39b2 https://publications-cnrc.canada.ca/fra/voir/objet/?id=44df4246-48ad-4c22-a7b8-c121d79a39b2S e r TH1 N 2 l r 2 no.
207
c . 2BLDG
NATIONAL RESEARCH COUNCIL
;$&$$!+(;-$$@
CANADADIVISION OF BUILDING RESEARCH
Air leakage and pressure measurements
on two occupied houses
BY
G. T . TAMURA AND A. G. WILSON
Reprinted from V o l 5, No. 12, December 1963, pp 65-73, of the A S H R A E Journal, b y permis-
sion. of the American Society of Heating, Refrigerating arzd Air-Conditioning Engineers, IRG.
F-
-2
{r;
c'--
-
.c"
RESEARCH PAPER NO. 207 OF THE
DIVISION OF BUILDING RESEARCH
PRICE 25 CENTS
OTTAWA
This publication is being distributed by the Division of Building Researc of the National Research Council. I t should not b e reproduced, in whole or part, without permission of the original publisher. The Division woulcl be gla to be of4 assistance in obtaining such permission.
Publications of the Division of Builcling Research lnay b e obtained by mailing the appropriate remittance, (a Bank, Express, or Post Office Money Order or a cheque made payable at par in Ottawa, to the Receiver General of Canada, credit National Research Council) to the National Research Council, Ottawa. Stamps are not acceptable.
A coupon system has been illtrocluced to make payments for publications relatively simple. Coupons are available in denominations of 5, 25 and 50 cents, and may be obtainecl by making a remitt'ance as indicated above. These coupons may be used for the purchase of all National Research Council public a t' lons including specifications of the Canadian G o v e ~ ~ l m e n t Specifications Board.
G.
T . TAMURA A.G.
WILSON Member ASHRAEAir
leakage and pressure measurements
on two occupied houses
Air leakage is an important item in the heat balance of most houses. It is also the usual source of fresh air and air for combustion. Exfiltrating air is the major means by which moisture is lost from a house during the winter and greatly influences the relative humidity that is maintained; it can also be a major cause of con- densation problems if the moisture which it carries is de~osited within walls. windows or roof construction. Air leakage measurements using the tracer gas tech- nique' were carried out on two occupied one-story houses located in Ottawa, Canada, from the winter of 1960-61, through the summer. to the winter of 1961-62. Similar u
measurements2~ 3 1 4 7 5 . have been reported recently, but the amount of such information applicable to North American building practice is still quite limited. It is, therefore, desirable to extend the available information on house air leakage characteristics.
In these present studies an attempt was made to relate the measured air leakage to weather conditions and to furnace operation. The measured values are also compared with those calculated by ASHRAE Guide And Data Book procedures. In addition, some measurements were made of the differences in Dressure across the walls of the houses and the data related to wind velocity and direction for both summer and winter co~~ditions. These records, together with pressure clifferences measured across the ceiling, indicate the pattern of air leakage.
-. --- -
G. T . Tnn~rrra is Research Officer, Br~ilding Services Section, Di- visior~ of Rrril(1ing Research, National Research Cor~ncil, O t t a ~ o a ,
Cnnadn. A. G. lyilsorr is Head, Briilding Seruices Section, Diui- sion of Building Research, National Research Council, Ottama, Cnnnda. This paper lras been jor presrntcrtion at the
A S I l R A E Serr~iannual J.leeting, Neao Orleans, La., Jan. 27-29, 1964.
DESCRIPTION OF HOUSES
Both houses were constructed by project builders ancl are located in built-up areas. Plan views of the two houses are given in Figs. 1 and 2. Both are one-story, five-room houses of insulated wood-frame construction with full basement. Inside finish is plasterboard in house No. 1 and plaster in house No. 2. Attics are vented. Openable windows in house No. 1 are double horizontal sliding sashless units and those in house No. 2 are double-hung vertical sliding units, with storm sash in winter. House No. 2 has louvred openings with hinged, weatherstripped covers beneath fixed double windows in the living-dining room. In both houses basement windows are hinged, with storm sash. Both houses are heated by forced warm-air heating systems with high pressure gun-type oil burners; house No. 2
has a solid-fuel fireplace in the living room. Prior to the summer tests a detached garage was constructed adjacent to the west wall of house No. 2. The plan area, based on inside dimensions, is 830 sq ft for house No. 1
and 1076 sq ft for house No. 2. The net volume. in- cluding basement and allowing 10% for furnishings and partitions, is 11,900 cu ft for house No. 1 and 15,300 cu ft for house No. 2.
Distribution of window and door cracks is shown in Table I. Actual crack lengths have been adjusted
LO give the length equivalent to that of average fit
double-hung wood-sash, weatherstripped ~vinclows based on the leakage factors in the Table. These factors are consistent in general with those given in the ASHRAE Guicle And Data Book, with some adjustments based on judgment. The leakage factor for the sashless wirldows
ing both winters; during the second winter adhesive tape was applied around the exterior perimeter of all storm sashes on the first floor and to the interior perimeter of all the basement windows. The results of air infiltration
calculations by the crack method given in the ASHRAE
BASLMENT
Guide And Data Book are also shown in TableI
fora wind velocity of 10 mph. These are simply values of total air flow through one-half of the total equivalent crack based on a leakage factor of 13 cu ft per ft of crack. The values are expressed in terms of air changes per hr, based on the combined volume of first floor and basement.
METHOD AND INSTRUMENTATION
Ventilation rates were determined from measurements with a katharometer of the rate of change of concen- tration of helium gas discharged in the house. The relationship between the concentration of the tracer
gas and ventilation rate is expressed by:
v t? - t,
k = infiltration rate v = volume of enclosure
R
=
air change ratec
=
tracer gas concentration t=
timeThe katharometer used was similar to the one designed by the National Bureau of Standards'. A continuous sample of helium-air mixture was drawn with a small diaphragm pump through a drying bottle containing calcium chloride and then to the katharometer. The imbalance of the katharometer bridge circuit caused by the changes in the helium concentration was recorded
on a millivolt recorder.
FlqST
F L O O q
In the house trials, helium was injected into the
supply plenum of the forced warm-air heating system.
STATIC
P q E ' S s U q LT A P
The circulating blower operated continuously during X T H E R M O C O U P L E /each test. A sample of helium-air mixture was drawn Fig. 1 Ilouse
No.
1 from the return air plenum to the katharometer, theoutput of which was recorded. Air circulation rates
provided by the furnaces were equivalent to about six connected through the window frames at the same level air changes per hr, which were large in relation to the to plastics tubing which was brought to a central loca- rates of air infiltration measured. tion in the basement. Pressure taps were also installed Doors to all rooms and basement were open and it to measure the pressure difference across the ceiling and is assumed, therefore, that a fairly uniform concentration chimney draft. A cup anemometer was located 25 ft of helium was obtained in the houses throughout each from ground level above one side of the house to record test and that the concentration in the return plenum was wind speed and direction. House No. 2 was similarly a properly weighted average of the whole house con- instrumented, but the height of the pressure taps through centration. Circulation of air by the furnace blower exterior walls varied from 2 to 5 ft above the first floor did not influence air infiltration as no significant pres- level and the anemometer was located 24 ft from the sure difference between rooms was possible with all ground and 30 ft to the rear of the house.
spaces freely interconnected. The pressures were measured with a diaphragm, To measure the pressure differences across the ex- strain-gauge-type, pressure transducer. The voltage out- terior walls of house No. 1, pressure taps of $-in. cop- put from the pressure transducer was recorded on a per tubing were mounted flush with the outside surface 16-point millivolt recorder. Plastics tubing from each of
the
walls, 4 ft above the first floor level. These were pressure tap was connected to a 12-point pressureFIRST
FLOoq 4 STATIC P S E S S U ~ L T A PX THESMOCOUPLL
Fig. 2 Hoz~se No. 2
The airport is located in a flat open area, 6 miles south- west of house No. 1 and
5
miles southwest of house No. 2. The ratio of the wind velocity at the houses t that at the airport averaged 0.65 for house No. 1 an 0.56 for house No. 2 over a wide range of win conditions.AIR LEAKAGE TEST RESULTS
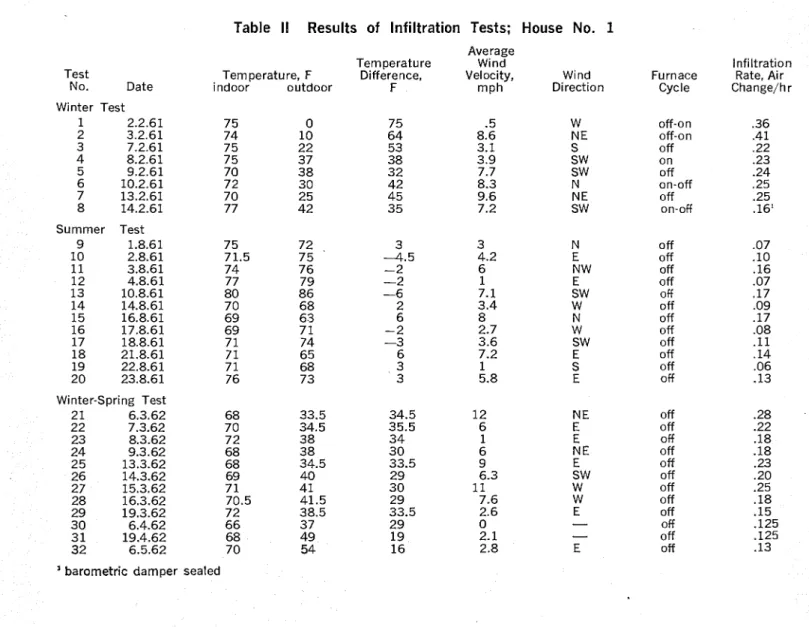
Results of the air leakage tests conducted in both houses are given in Tables I1 and 111. The hourly air change rates quoted are based on the net volume of the houses including the basement. During the two winters, measured ventilation rates for house No. 1
varied from 0.25 to 0.41 air changes per h r ; this compares with rates of 0.37 to 0.63 air changes for house No. 2 during the first winter, and 0.33 to 0.57 air changes during the second winter with the openable windows taped. During the summer, measured air change rates varied from 0.07 to 0.16 for house No. 1
and 0.11 to 0.23 for house No. 2.
Figs. 3 and 4 show the relationship between ventila- tion rate and wind speed for both houses for the summer condition. Assuming a flow exponent of
y2
Table I Equivalent Crack Length and Calculated Air Leakage House No. 1 Length of crack, ft N S - E W
-
-
-
First floor . . . . 38.7-
126.0 155.9 Basement . . .-
-
32.6-
38.7 158.6 155.9 Overall Total-353.2 ftTotal crack length to net volume ratio-0.030 ft/ft" House No. 2 (winter storni sash on openable window)
Length of crack, ft
N S E W
- - -
-
First floor . . . . 73.3 24.3 92.0 109.3 switch controlled by a selector switch in the millivolt . . .
-
34.0-
85.0-
51.0 recorder. Two wind speed readings were recorded 107.324.3
177.0 160.3Overall Tota1468.9 ft
during a recorder cycle with each reading representing Total crack length to net volume ratio-0.031 ft/ft3
the integrated wind Over the Overall total crack length for house No. 2 as above with
cycle. The time interval for each recorder cycle was windows t a ~ e d is 313.0 ft and with no storm-sash on 3.84 min. openable window (summer window arrangement) is
Because of the probability of a zero shift in the 567.3 ft. pressure transducer, the zero pressure difference output Air Change Rates
and the output with the calibration resistor in the trans- House No. 1 0.20 air change per h r ducer bridge circuit were also recorded during each
cycle. A shaft encoder was attached to he slide wire a-storm sash on openable window -0.20 air change per h r shaft of the millivolt recorder which, in conjunction with b-as above with windows t a ~ e d
a punched paper tape recorder and its attendant con- -0.13 air change per h r c-storm sash removed -0.24 air change per h r
trol unit, gave all records in three digit binary form
on a punched paper tape. The paper tape was processed Note:: 1. sponding length of average double-hung wood- Equivalent crack length given in terms of corre- through a digital computer to obtain the actual pres- sash weatherstripped window with assumed air sure and wind speed readings. leakage of 60 cfh per f t at a pressure difference of 0.3 in. of water (equivalent to 25 mph velocity All wind velocities referred to in this paper are head). Other air leakage values assumed as those measured on site, approximately 2 5 ft above follows:
ground. The wind speed is 'affected boih by the height cfh Average double-hung wood sash window -100 at which it is measured and the surrounding terrain. A s above with storm sash
-
60 Both houses are located in residential districts. House A s above with storm sash taped-
45 No. 1 is located at the edge of a housing area with its Casement window with storm sash A s above with window taped -120-
45 south wall facing a wooded region. The records of Double horizontal sliding sashless window-120 the average hourly wind speed obtained at the two Fixed window-
30 houses were compared with those recorded at the Up- 2. Weatherstripped door with storm door Air change rates based on wind speed of 10 mph -120 lands Airport with an anemometer 25 ft above ground. and one-half total equivalent crack length.for the cracks in the enclosure, a linear relationship is obtained. The increase in air change rate for each mph of wind is 0.017 for house No. 1 ancl 0.020 for house No. 2. No effect of wind direction is evident from the limited records. As observed by o t h e r s h a n apparent ventilation rate was obtained with no wind and only small temperature differences. This amounted to 0.04 and 0.06 air changes per hr for houses 1 and 2, respectively. I t is thought that this was due in part to the small temperature differences that occurred during most tests as well as to loss of helium by diffusion through cracks in walls and ceiling.
I n Fig. 5 the ventilation rates obtained for house No. 1 during calm periods with the furnace off are
.30 a. 3 0 I cr .20 W a w u z a I .I0 U (r
a
0plotted against the square root of the temperature dif- ference in order to indicate the influence of house stack effect. The air leakage increased by 0.024 air changes per h r for each increment in the square root of the temperature difference. Inside to outside temperature differences in these tests did not exceed 35
F,
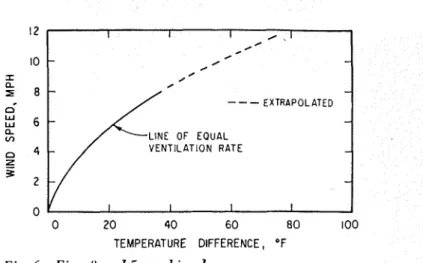
so that the temperature rise in the chimney flue due to prior furnace operation would b e small. Figs. 3 and 5 have been combined in Fig. 6 to compare the effect on ven- tilation rate of wind and house stack effect with each acting independently. For example, an inside-to-outside temperature difference of 32F
induces the same total rate of air change as that due to wincl a tZ
mph. Insuf-ficient data prohibited such compa~ison for house 2.
Table II Results of Infiltration Tests; House No. 1
Averaee
0 2 4 6 8 10 12 0 0 2 4 6 8 10 12
WIND SPEED, MPH WIND SPEED, MPH
Fig. 3 Ventilation rate, wind speed for House No. 1 Fig. 4 Ventilation rate, zoind speed for House No. 2
I I I I 1
TEMPERATURE DIFFERENCE BETWEEN INSIDE AND OUTSIDE AIR - 4 5 TO 6'F
/ / /
-
/ / / - sw\ / /
______J__
- - E * . w H/:
I I I I I . .Temperature
WindY-
Infiltration Test Temperature, F Difference, Velocity, Wind Furnace Rate, AirNo. Date indoor outdoor F m ~h Direction Cycle Change/h r
.30 cr 3 0 I .20 a w o z a I u .I0 cr a Winter Test W off-on .36 N E off-on .41 S off .22 SW on .23 S W off .24 N on-off .25 N E off .25 S W on-off .16' Summer Test off off off off off off off off off Winter-Spring Test 21 6.3.62 68 22 7.3.62 70 off off off off off off off off off off off off
12 I 1 I
.
0 , I.
lo
-
.
/.
-
0 / 0-
--
-
EXTRAPOLATED-
LINE OF EQUAL VENTILATION RATE-
-
I I I I I I I IWIND SPEED LESS THAN 3 MPH, FURNACE OFF - -
-
1 2 ( TEMPERATURE 3 4 DIFFERENCE 1'' OF 0 20 40 60 80 I00Fig. 5 Ventilatiora rates, House No. I , with furnace
o f in calm period TEMPERATURE DIFFERENCE, O F
Fig. 6 F i g .
S
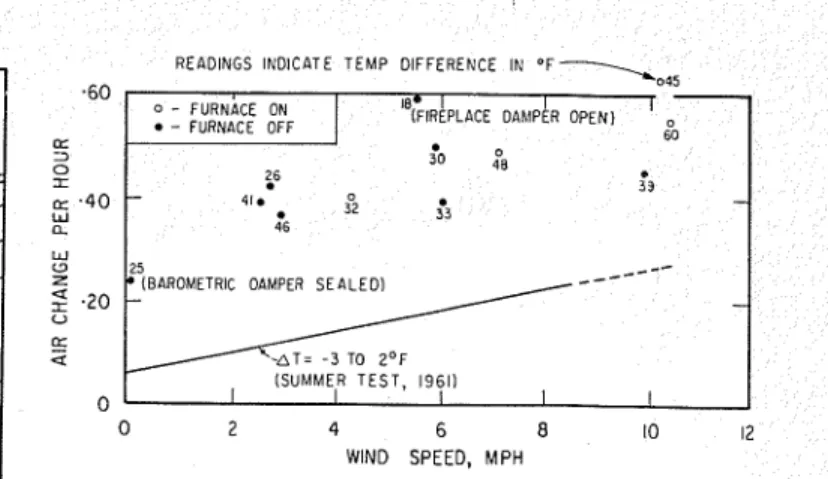
and 5 cornbinedThe combined effect of wind speed and tempera- ture difference for house No. 1 is shown in Fig. 7.
Ventilation rates obtained during periods with inside- to-outside air temperature differences of 29 to 35 F and with the furnace off are plotted against the wind speed. The intersection with the Y-axis is based on Fig. 5
and indicates a ventilation rate for stack effect alone, at this temperature difference, of 0.16 air changes per hr. From the curve for the summer test, reproduced from Fig. 3, this air change would be induced by wind effect alone at 7.5 mph. The combined wind and stack effect at this wind velocity is 0.21 air changes, or 0.65 of the sum of the ventilation rates due to wind and stack effect acting independently.
In establishing ihe curve of air change rate for a temperature difference of 70 F, it was assumed that this ratio of 0.65 is constant for house No. 1 for any com- bination of wind and temperature difference in Fig. 6. This assumption would appear to be valid, provided that the exponents of flow for the various cracks and open- ings in the building remain constant, since t h e pattern of air flow will be similar for all such conditions. It is seen in Fig. 6 that a temperature difference of 70
F
is equivalent to a wind velocity of 11.2 mph. I n Fig. 7the air change rate at these combined conditions is 65% of the sum of the separate wind and temperature effects; the intersection with the Y-axis is obtained b y extra- polating Fig.
5.
At [he higher wind speeds the effectTable Ill Results of Infiltration Tests; House No. 2
Temperature Test Temperature, F Difference,
No. Date indoor outdoor F
Average Wind Velocity, mph l nfiltration Rate, Air Change/hr .37 .63 .42 .49 .55 .39 .50 .40 .24' .39 .45 .59? .25 .23 .20 .12 .I45 .11 .06 -21' .49 .39 .57 .42 .45 .46 .45 .33 .46 .45 Wind
Direction Furnace Cycle Winter-Spring Test
-
on-off off on-off on-off-on off off off-on-off off off off off off Summer Test 14 30.6.61 75 75 0 15 4.7.61 71 74 -3 off off off off off off off Winter Test-Window Sealed21 3.1.62 71 25 46 22 4.1.62 71 0 71 on-off-on off-on-off on-off-on off-on-off on-off-on off-on-off off-on-off off-on-off off-on-off off-on-off
'
barometric damper sealed'
fireplace damper open_____---
- - 4 5 TO 6°F UMMER TEST, 19611 I I I 1 II
0 2 4 6 8 10 12 WlND SPEED, MPHI . 7 Vc~rztilatiorc rat(., contbincd wind and tc'm- perr~turc cflc.cts lor Housc No. 1
of combined wind and temperature difference approaches that due to wind alone.
The ventilation rate during cold weather is affected by the additional air flow up the flue induced by furnace operation. Two air leakage values obtained with air temperature differences of 64 and 75
F
and with the furnace in operation are shown in Fig. 7. These two values are well above the estimated curve for an air temperature difference of 70F.
To determine the amount of air flow through the chimney due to furnace operation, the carbon dioxide concentration was meas- ured with an Orsat gas analyzer in the smoke pipe be- tween the furnace and barometric damper and inside the chimney just above the smoke pipe inlet on a num- ber of occasions with the furnace in operation.The furnace at the time of the tests was equipped with a 0.50 gph nozzle burning No. 2 fuel oil and was operating with a Bacharach smoke No. 2. At an inside to outside temperature difference of 75
F
and a wind speed of 5 mph the air flow, based on the Con measure- ments, was about 1300 cu ft per hr or 0.11 house air changes per hr through the furnace, which was increased by the diluent air through the barometric damper to a total of about 4,500 cu ft per hr or 0.40 air changes per hr.The ventilation rates obtained during the cold weather and with the furnace on are close to this value; this suggests that with the furnace in operation air flow out of the house took place largely through the chimney. The ventilation rate obtained with the barometric damper sealed indicated an appreciable reduction in air leakage. The results of the ventilation tests on house No. 2
READINGS INDICATE TEMP DIFFERENCE IN
0 - FURNACE ON - FURNACE OFF LT 3 0 I 3 3 41. W
.
32 a 46 0 2 4 6 8 10 12 WlND SPEED, MPHFig. 8 Ventilation test results for House N o . 2,
winter of 1960-61
effect alone, even at the highest wind speeds. St effect has a much greater influence on the ventilati rate for house No. 2 than for house No. 1, due prob to differences in the vertical distribution of cracks. air change rates for the second winter a r e somew lower than those of the first, especially at the higher wi speeds. Air leakage appears to be less influenced wind and to be primarily a function of furnace op ation and stack effect.
Some increase in air leakage due to furnace ope tion is evident on close scrutiny of the results in Fig although it would appear to be somewhat less than house No. 1. Opening of the fireplace damper cause a significant increase in air leakage; sealing of the ba metric damper caused a significant decrease, even w the furnace off. The furnace was operating during of the tests the results of which are shown in Fi Measurements of C 0 2 concentration in the flue gas dur- ing the second winter indicated air flows corresponding to 0.13 air changes per hr through the furnace and a total of 0.38 air changes per hr out the chimney with the furnace operating steadily, with an inside to outside temperature difference of about 41)
F
and a wind of about 1 0 mph. Thus, with the furnace on a large proportion of the air flow out of the house occurred through the chimney.PRESSURE MEASUREMENTS
To obtain a relationship between pressure difference across the walls of the hollses and the wind speed, the Eollo~uint, second eclualion was assumed:
for the winter of 1960-61 are shown in Fig. 8 and those
where
for the winter of 1961-62 with the windows taped are
P
= pressure difference, in. of water shown in Fig. 9, together with the curve for the sum- V = wind speed, mph
mer tests in both instances. It should be remembered
A = constant that the equivalent crack length of the summer tests
C
= constant was somewhat greater than for either winter due to the-
removal of storm sash. The slope of the curve of air leakage for the summer tests therefore is greater than is appropriate for the window arrangement of either winter, particularly the second.
Insufficient information is available to establish curves for specific values of temperature difference. The air leakage values for the first winter, however, are significantly higher than the summer values due to wind
'The pressure difference and the wind speed readings recorded on puncher1 paper tape were processed through a digital computer to determine the best fitting curve using the method of least squares. Fig. 1 0 is a typical plot of the pressure difference across a windward wall vs wind velocity. The wind speed recorded was the average wind speed during a half recorder cycle (1.92 m i n ) , whereas the pressure readings were instantaneous
0 1 I I I I I
I
0 2 4 6 8 I0 12
WlND SPEED, M P H
Fig. 9 Ventilation test results for House No. 2, the zuinter of 1961-62, taped windows
measurements. Because of the fluctuations in wind speed and direction, considerable scatter of the results occurs; it is more pronounced at higher wind speeds. The ex- tent of scatter is indicated by the standard error of estimate.
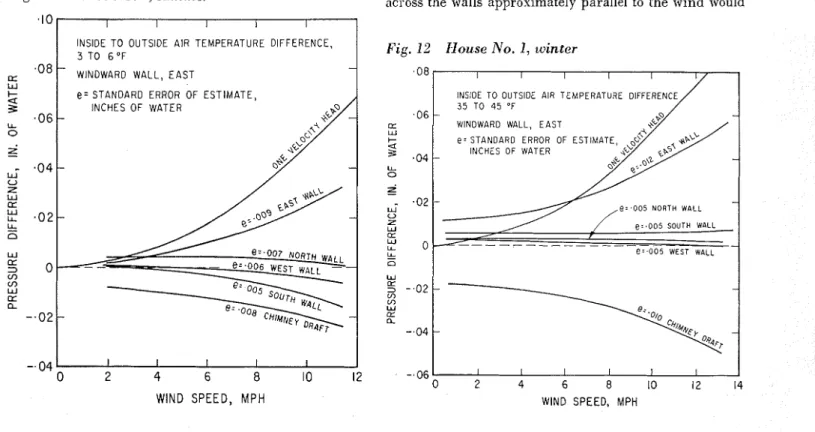
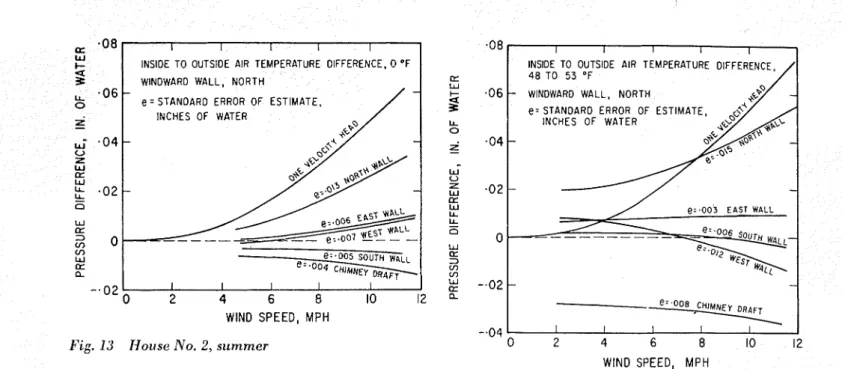
Pressure difference vs wind speed relationships for all four walls of house No. 1 are shown in Figs. 11 and 12 for summer and winter conditions, with wind from the east. Similar results for house No. 2 are shown in Figs. 1 3 and 1 4 with wind from the northwest. The pressure difference corresponding to one velocity head is also shown. The windward wall is at the rear in both cases. The results for the summer condition are similar for both residences, with infiltration through windward and exfiltration through leeward walls.
Pressure differences across side walls can be posi- tive or negative, depending on small changes in wind direction. The pressure difference across the windward wall is 867% of the total pressure difference from wind- ward to leeward sides for house No. 1 and 83% ior house
Fig. I 1
.I0
House No. 1, summer
INSIDE T O OUTSIDE AIR T E M P E R A T U R E D I F F E R E N C E , 3 T O 6 OF - WINDWARD W A L L , E A S T e = S T A N D A R D ERROR O F E S T I M A T E , I N C H E S O F W A T E R - 0 . "
/
-. 04 0 2 4 6 8 10 12 WlND SPEED, MPH e - GC3,e = STANDARD ERROR OF ESTI:JATE,
- INCHES OF WATER
-
- - I WlND SPEED, MPHFig. 10 Typical pressure plot of pressure diflerence
on windward wall us. wind velocity
No. 2. To balance the air flow, some exfiltration must take place through ceiling construction and chimneys. Extensive measurements of draft at the base of the chimneys during the summer tests indicated that draft generally increased with wind velocity for all wind directions in house No. 2 and for all but a southwest wind in house No. 1. At lower wind speeds the draft sometimes exceeded one velocity head.
The results for the winter conditions in Figs. 1 2 and 1 4 indicate the influence on pressure differences of house stack effect and furnace operation. No distinction is made between furnace-off a n d furnace-on conditions, the results indicating the net effect of this and other factors during the test period.
With wind at 10 mph the pressure difference across the windward wall was greater than that for the summer conditions by 447% for house No. 1 and by 667% for house No. 2; information for house No. 2 is for a some- what higher temperature difference than for house No. 1.
The magnitude and direction of pressure differences across the walls approximately parallel to he wind would
Fig. 12 Zlouse No. 1, winter
,08
1
I I I I I I/I
INSIDE TO OUTSIDE AIR TEMPERATURE DIFFERENCE
35 TO 45 "F
/
I
-
WINDWARD WALL, EAST INCHES OF WATER
-
-
e z . 0 0 5 N O R T H WALL
e : oos WEST WALL
-.06 I I I I I I
1
0 2 4 6 8 10 1 2 14
INSIOE TO OUTSlOE AIR TEMPERATURE OIFFERENCE. 0 'F WINOWARD WALL, NORTH
-
e = STANOARO ERROR OF ESTIMATE,
INCHES OF WATER
- 0 2 1 I I I I I I
0 2 4 6 8 10 12 WlND SPEED, MPH
Fig. 13 Norise No. 2, summer
again appear to be sensitive to small changes in wind direction.
Under the winter condition, however, infiltration occurred through all walls of house No. 1 at wind speeds up to 12 mph; infiltration occurred through all walls of house No. 2 at wind speeds up to 7 mph. At lower wind velocities it must be assumed that all of the exfiltration took place through the chimney and ceiling construction. The results indicate an increase in chimney draft to wind action.
Analysis of the pressure differences measured across the ceiling of both houses indicates that they are gen- erally independent of wind velocity and are relatively small. During the summer the pressure differences ranged between plus and minus 0.002 in. of water for both houses. In the winter. with the furnace off. the pressure inside each house was higher than in the attic.
With inside-to-outside temperature differences of 47
F
for house No. 1 and 6 5F
for house No. 2, this pressure difference was generally 0.005 in. of water, or less. With the furnace in operation the attic pressure was positive with respect to inside in house No. 1, gen- erally by 0.005 in. of water, or less, at a temperature difference of 47F
indicating a reversal of the direction of air flow. Under this condition exfiltration occurred mainly through the chimney. In house No. 2 the pres- sure difference across the ceiling did not appear to be greatly influenced by furnace operation during either winter.To estimate the neutral pressure level for the two houses the average of the difference across the four walls was determined at a number of outdoor tem- perature conditions at wind speeds of less than 4 mph. This is equivalent to determining the value of the "con- stant" A of Eq. ( 2 ) for the different temperature condi- tions. The results for both houses are shown in Fig. 15. No distinction was made between furnace-on and fur- nace-off conditions, which may account for some of the scatter in the points.
From Fig. 15, the neutral pressure level is esti- mated to be 1 0 in. above the first floor ceiling level in house No. 1 and 1 ft 4 in. below the first floor ceiling level in house No. 2. It has already been noted that, in house No. 1, the pressure difference between house
INSIDE TO OUTSIDE AIR TEMPERATURE DIFFERENCE,
48 TO 5 3 "F
-
WINDWARD WALL, NORTH-
-
" ,
0 2 4 6 8 10 12 WlND SPEED, MPH
F i g . 14 House No. 2, u.' dnter
and attic was positive with the furnace off and negative with the furnace on. At an inside-to-outside temperature difference of 65
F,
this change in pressure difference corresponded to a change in the neutral pressure level of about 2 ft. Some further information on neutral zone levels for house No. 2 has already been r e p ~ r t e d . ~SUMMARY
Detailed results of air leakage and pressure distribution measurements have been presented for two single-story houses with oil-fired warm air furnaces. The houses had similar ratios of equivalent window and door crack length to total volume but house No. 2 had a greater proportion of crack at ground level. The results, al- though specific to the test houses, have implications relative to other similar buildings.
During the summer, air leakage rates of both houses varied approximately linearly with wind velocity. Dur- ing the winter, the pattern and extent of air leakage were influenced by both house stack action and furnace operation. The influence of house stack action alone, independent of the effects of wind and furnace operation, was determined for house No. 1 and the air change rate found to vary linearly with the square root of the inside- to-outside temperature difference.
The air change rate under the combined influence of wind and temperature difference was less than the sum of rates due to wind and temperature acting inds- pendently. This is at variance with other investigators2.
"
who have assumed that wind and temperature effects are independent and additive. At the higher wind veloc- ities and with the furnace off, the ventilation rate in house No. 1 due to combined wind and stack effects was only slightly above that induced by wind action alone. House No. 2 exhibited a greater stack effect, presumably due to the greater amount of crack at lower levels.The influence of furnace operation on air leakage was quite marked. In house No. 1, ventilation rates with the burner on were up to 50% greater than with the burner off and corresponded closely with measured rates of air flow up the chimney. Exfiltration occurred
between inside and outside and on furn'ace action. more times those calculated. The discrepancv is ?re
U 2 z---
%6
---
I
_I est with house No. ~~~. - - - ~~ -~ 2 which exhibited the .--. r r ~ n t ~ r ~ t ,effect. Calculated air leakages based on the total crac length are considerably in excess of measured values
-
-
6 0 for the summer; for the winter the calculated ralu
INSIDE TO OUTSIDE AIR TEMPERATURE DIFFERENCE, OF agree well with measured values for house No. 1 wit
the furnace on, but are somewhat lower than measu Fig. 15 Average pressure diflerc~r~ce across ~ o a l l s d u e
values for house No. 2. Air leakage test results. a t o tcnzpernlurr: efJc~cl lo r both houses
mented by pressure difference measurements, are re- quired on a variety of house types to develop improied across the ceiling construction with the furnace off and
-
procedures.infiltration with the furnace on. In house No. 2 the effect of furnace o ~ e r a t i o n was not so marked until the windows were taped; then air leakage rates with the burner on were relatively insensitive to wind and outside temperature and a large proportion of the exfil- tration took place through the chimney. Some exfiltra- tion occurred through the ceiling construction even with the furnace on.
The ASHRAE Guide And Data Book crack method of calculating air leakage considers only wind action and assumes, in effect, that 64% of the velocity head of the wind acts across the cracks. For houses it is common to base the calculation on the total crack. For larger open buildings the ASHRAE Guide And Data Book recommends usinz not less than half of the total " crack. Any comparison of calculated air leakage values and actual values is arbitrary, since it depends on the selection of air leakage coefficients and amount of crack in the calculation and on the definition of wind velocity in the measurements.
Calculated air change rates for wind at 10 mph based on one-half the total crack are in good agreement with measured air change rates during the summer with wind at 1 0 mph as determined on site. This would appear to be due mainly to a fortuitous selection of leak- age coeficients. With infiltration primarily through one windward wall, the pressure difference across the
ACKNOWLEDGMENTS
The authors wish to acknowledge the contribution 01
D. G. Stephenson in developing the instrumentation and of G.
P.
Mitalas in the computer analysis of the pressure records.R. G.
Evans assisted in the taking and assem- bly of the test records. This paper is a contribution uf the Division of Building Research and is published with the approval of the Director of the Division.REFERENCES
1. Measurement of Ventilation Using Tracer Gas Technique. J. B.
Dick. ASHRAE Journal Section, Heating, Piping and Air Con- ditioning, May 1950, p. 131.
2. Measurement of Infiltration in Two Residences, Pt. 1. D. R.
Bahnflrth. T. D. Moselev and W. S. Harris. ASHRAE Transac- tions, Vol. 63, 1957, p. 439.
3. Ibid, Part 11, p. 453.
4. Field 3Ieasurements of Air Infiltration in Ten Electrically Heated Houses. C. W. Cohlentz and P. R. Achenbach. ASHRAE Journal, July 1963, p. 69.
5 Infiltration Measureinents in Two Research Houses. R. C. Jor- dan, G. A. Erickson and R. R. Leonard. ASERAE Journal, May 1963, p. 71.
6. Experimental Studies in Natural Ventilation of Houses. J. B.
Dick. Tournal of the Institute of Heating and Ventilation En- gineers,-~ol. 17, No. 173, December 191m9.
-
7. Design and Performance of Portable Infiltration Meter. C W.
Coblentz and P. R. Achenhach. ASHRAE Transactions. Vol. 63, 1957, p. 477. . .
8. Influence of the House on Chimney Draft. A. G. Wilson. ASHRAE Transactions, Vol. 67, 1961, p. 317.