HAL Id: hal-00298542
https://hal.archives-ouvertes.fr/hal-00298542
Submitted on 7 May 2008HAL is a multi-disciplinary open access
archive for the deposit and dissemination of sci-entific research documents, whether they are pub-lished or not. The documents may come from teaching and research institutions in France or abroad, or from public or private research centers.
L’archive ouverte pluridisciplinaire HAL, est destinée au dépôt et à la diffusion de documents scientifiques de niveau recherche, publiés ou non, émanant des établissements d’enseignement et de recherche français ou étrangers, des laboratoires publics ou privés.
The new Landsat-derived glacier inventory for
Jotunheimen, Norway, and deduced glacier changes
since the 1930s
L. M. Andreassen, F. Paul, A. Kääb, J. E. Hausberg
To cite this version:
L. M. Andreassen, F. Paul, A. Kääb, J. E. Hausberg. The new Landsat-derived glacier inventory for Jotunheimen, Norway, and deduced glacier changes since the 1930s. The Cryosphere Discussions, Copernicus, 2008, 2 (3), pp.299-339. �hal-00298542�
TCD
2, 299–339, 2008A new Landsat-derived glacier inventory for
Jotunheimen L. M. Andreassen et al. Title Page Abstract Introduction Conclusions References Tables Figures ◭ ◮ ◭ ◮ Back Close Full Screen / Esc
Printer-friendly Version Interactive Discussion The Cryosphere Discuss., 2, 299–339, 2008
www.the-cryosphere-discuss.net/2/299/2008/ © Author(s) 2008. This work is distributed under the Creative Commons Attribution 3.0 License.
The Cryosphere Discussions
The Cryosphere Discussions is the access reviewed discussion forum of The Cryosphere
The new Landsat-derived glacier
inventory for Jotunheimen, Norway, and
deduced glacier changes since the 1930s
L. M. Andreassen1,2, F. Paul3, A. K ¨a ¨ab2, and J. E. Hausberg1,2
1
Norwegian Water Resources and Energy Directorate (NVE), Oslo, Norway
2
Department of Geosciences, University of Oslo, Oslo, Norway
3
Department of Geography, University of Zurich, 8057 Zurich, Switzerland Received: 17 March 2008 – Accepted: 4 April 2008 – Published: 7 May 2008 Correspondence to: L. M. Andreassen (lma@nve.no)
TCD
2, 299–339, 2008A new Landsat-derived glacier inventory for
Jotunheimen L. M. Andreassen et al. Title Page Abstract Introduction Conclusions References Tables Figures ◭ ◮ ◭ ◮ Back Close Full Screen / Esc
Printer-friendly Version Interactive Discussion
Abstract
A Landsat Thematic Mapper (TM) scene from 2003 covering the Jotunheimen and Bre-heimen region has been used to map the recent glacier extents using thresholded ratio images (TM3/TM5). Orthoprojected aerial photographs and glacier outlines from digital maps have been used to validate the method and control the results. We further cal-5
culated glacier changes by comparing the Landsat-derived 2003 glacier outlines with previous maps and inventories from the 1930s, 1960s and 1980s. Our results confirm that the applied automatic mapping method is very robust and agrees precisely with the reference data used. Some manual editing was necessary to correct the outline at ice-lake contacts and at debris covered glaciers. However, for most of the glaciers no 10
corrections were required. The most laborious task has been to assign ID numbers and couple the new Landsat inventory to previous inventories to assess area changes. The glaciers investigated shrank since the 1930s with an overall area reduction of about 23% for 38 glaciers. Since the 1960s the area reduction was 12% for 164 glaciers. Although the general trend is glacier retreat and area reduction, some glaciers have 15
increased their size or remained nearly unchanged over the last decades.
1 Introduction
Glacier changes are key indicators of climate change (IPCC, 2007) and have thus been selected as one of the essential climate variables (ECVs) in the global climate observ-ing system (GCOS, 2003). Although the Norwegian glacier data base is comprehen-20
sive with long time series of mass balance and length changes for many glaciers, most of the glaciers remain unmeasured. Previous studies have shown that glacier change may vary largely within a region due to precipitation distribution, altitudinal range, area distribution and dynamic response (Andreassen et al., 2000; Engeset et al., 2000).
Furthermore, monitoring in Norway is often biased towards larger glaciers and 25
TCD
2, 299–339, 2008A new Landsat-derived glacier inventory for
Jotunheimen L. M. Andreassen et al. Title Page Abstract Introduction Conclusions References Tables Figures ◭ ◮ ◭ ◮ Back Close Full Screen / Esc
Printer-friendly Version Interactive Discussion has not been performed since the compilation of glacier inventories in the mid 1980s
for southern Norway (Østrem et al., 1988) and the early 1970s for northern Norway (Østrem et al., 1973). In order to gain an updated overview of the present state of the glacier cover and its changes since the previous inventories, the Norwegian Water Resources and Energy Directorate (NVE) has started the compilation of a new remote-5
sensing-derived glacier inventory for mainland Norway using Landsat TM/ETM+ im-agery. The new Norwegian Glacier Inventory contributes to the Global Land Ice Mea-surements from Space (GLIMS) initiative, which is specifically designed to produce and augment baseline information to facilitate glacier-change studies (e.g. Bishop et al., 2004; Kargel et al., 2005). It also follows the recommended strategy of the GTN-G 10
(Tier 5) to update glacier inventories from satellite data after a few decades (Haeberli, 2006).
The Landsat TM/ETM+ sensors have proven to be a particularly efficient tool for mapping glacier extent and monitoring changes even for small alpine glaciers (e.g. Paul et al., 2002; K ¨a ¨ab et al., 2002). Glacier outlines can be obtained from thresholded mul-15
tispectral band ratios (Bayr et al., 1994; Jacobs et al., 1997; Paul, 2002; Sidjak and Wheate, 1999). The method is robust and its results were previously reported to be very accurate for debris-free glaciers (Albert, 2002; Paul et al., 2003). A glacier inven-tory can be created using outlines derived from multispectral satellite data in combina-tion with a Geographic Informacombina-tion System (GIS) and a digital terrain model (DTM), as 20
demonstrated in an increasing number of studies over the last decade (e.g. Paul, 2007; Paul and K ¨a ¨ab, 2005; Bolch, 2007). The major limitation, however, is the availability of suitable cloud-free scenes at the end of the ablation season without seasonal snow remaining. Acquisition of such satellite data is particularly demanding in a pronounced maritime climate such as in large parts of Norway, where the major glacierized areas 25
tend to be cloud-obscured and covered by seasonal snow due to high precipitation rates in all seasons. In this study we use a Landsat scene from summer 2003 with ex-cellent snow conditions for glacier mapping. The scene covers Jotunheimen and parts of the Breheimen region in southern Norway, a well-investigated glacierized region in
TCD
2, 299–339, 2008A new Landsat-derived glacier inventory for
Jotunheimen L. M. Andreassen et al. Title Page Abstract Introduction Conclusions References Tables Figures ◭ ◮ ◭ ◮ Back Close Full Screen / Esc
Printer-friendly Version Interactive Discussion Norway with numerous glaciers and ice caps of different size and good ground control
data available (Fig. 1). The objectives of the presented study are to:
– Apply multispectral remote-sensing techniques to a test region in Norway and as-sess the suitability and accuracy of the method for application to entire mainland Norway.
5
– Provide an updated inventory of the glacier extent in the Jotunheimen and Bre-heimen regions.
– Compare this new inventory with previous inventories to quantify changes in glacier area.
2 Study region
10
The region under study is about 5000 km2in size and is centred at about 8.1◦E, 61.5◦N.
The region is covered by a Landsat 5 TM scene from summer 2003 and includes the mountain ranges Jotunheimen and Breheimen in southern Norway (Fig. 1).
The Jotunheimen region is the highest mountain massif in Norway and is charac-terised by many small glaciers, typically valley-type and cirque-type and also a few 15
steep hanging glaciers. Most of them are separate entities, surrounded by step rock walls. A few larger composite glaciers (a glacier divided into two or more glacier units by ice divides in the inventories) and ice caps exist, too, the largest of them being Smørstabbreen (Sm, Fig. 1). The Breheimen region in the west has less rough to-pography and contains the ice caps Spørteggbreen and Harbardsbreen (Sp and Ha, 20
Fig. 1). The glaciers in the study region are located within an elevation range of ∼1300 to ∼2300 m a.s.l., with increasing equilibrium line altitude (ELA) with distance from the west coast towards the drier interior in the east (Østrem et al., 1988).
Systematic observations of the glacier changes in Jotunheimen started at the be-ginning of the 20th century with traditional length change measurements for a num-25
TCD
2, 299–339, 2008A new Landsat-derived glacier inventory for
Jotunheimen L. M. Andreassen et al. Title Page Abstract Introduction Conclusions References Tables Figures ◭ ◮ ◭ ◮ Back Close Full Screen / Esc
Printer-friendly Version Interactive Discussion Presently, length changes are measured for six glaciers in the study region (see Fig. 1c
for location; Kjøllmoen et al., 2007). Long-term mass-balance observations exist for three glaciers: Storbreen, Hellstugubreen, and Gr ˚asubreen (S, H and G in Fig. 1). In addition, short-term mass-balance observations have been performed at six other glaciers within the study region (Andreassen et al., 2005). The mass-balance obser-5
vations reveal a clear west-east gradient in the study region, with the glaciers located closer to the west coast having a much higher mass turnover than those located in drier, more continental conditions towards the east (e.g. Østrem et al., 1988). Whereas the maritime glaciers with a large annual mass turnover had a large mass surplus be-tween 1962 and 2000, the continental glaciers with small summer and winter balances 10
had a mass deficit over the same period (Andreassen et al., 2005). In the period 1989 to 1995, however, both maritime and continental glaciers in southern Norway had a transient mass surplus. This surplus was mainly caused by increase in winter accumu-lation. Since 2001 the glaciers have had a net mass deficit due to warm summers and partly also less winter accumulation than normal (Andreassen et al., 2005, 2007). 15
The length change measurements reveal that the glaciers in Jotunheimen have, with a few exceptions, retreated throughout the last century, while many maritime glaciers have been through periods of advance and recession (Elvehøy et al., 1997). A period of major retreat started around 1930 (Østrem and Haakensen, 1993). Since 2000, however, nearly all glaciers in Norway have retreated (Andreassen et al., 2005, 2007). 20
3 Data
3.1 Satellite imagery
The Landsat 5 TM scene used here (date 9 August 2003, path 199, row 17, id 5199017000322110) was orthorectified and provided by the Norsk Satellittdataarkiv (Norwegian Archive of Satellite Data). The scene has no clouds and very little sea-25
TCD
2, 299–339, 2008A new Landsat-derived glacier inventory for
Jotunheimen L. M. Andreassen et al. Title Page Abstract Introduction Conclusions References Tables Figures ◭ ◮ ◭ ◮ Back Close Full Screen / Esc
Printer-friendly Version Interactive Discussion (S, H and G in Fig. 1) reveal that both 2002 and 2003 were years with highly negative
net balance due to little winter precipitation and record warm summers (Andreassen et al., 2005). The scene provides thus nearly excellent conditions for satellite-based multispectral glacier mapping.
3.2 Digital glacier outlines and digital terrain model (DTM) 5
Digital data from the main topographic map series of Norway, N50 (1:50 000 scale), by the Norwegian mapping authorities (Statens Kartverk) were used as background data for the analyses. In the Jotunheimen region the data are originally constructed using analogue photogrammetry based on aerial photography from the period 1976–1983, while two map sheets covering the western part of the study region (1 and 1418-10
2 in Fig. 1b) are based on aerial photography from 1966 (J. Tallhaug, Statens Kartverk, personal communication). The data were printed as paper maps at the scale 1:50 000. They contain standard topographic information such as lakes, rivers, glacier outlines and 20 m contour lines. The maps have later been manually digitised or scanned from the analogue maps. A digital terrrain model at 25 m resolution (DTM25) has been con-15
structed from the digitized contour lines and covers all of Norway. The reported vertical root mean square error (RMSE) of the part of the DTM25 that covers the study region is 3–5 m (J. Tallhaug, Statens Kartverk, personal communication). The N50 glacier outlines do not differentiate between glaciers and snow, so that snow ridges outside the glaciers are often included in the glacier areas when they have direct contact to 20
them. Moreover, glacier entities are not separated, which requires a combination with drainage divides before glacier specific changes can be calculated. Standard empirical rules used in photogrammetry and mapping let expect a horizontal RMSE of outlines in the order of 5 to 10 m, not taking into account any interpretation uncertainty during the compilation process.
TCD
2, 299–339, 2008A new Landsat-derived glacier inventory for
Jotunheimen L. M. Andreassen et al. Title Page Abstract Introduction Conclusions References Tables Figures ◭ ◮ ◭ ◮ Back Close Full Screen / Esc
Printer-friendly Version Interactive Discussion 3.3 Aerial photographs and glacier outlines of 2004
3.3.1 Orthophotos 2004
Digital orthorectified aerial photographs from 12 August 2004 (Contract no. 13 124, source:www.norgeibilder.no) were available for a large part of the study region (Fig. 1). Statens Kartverk has orthorectified the images by using the DTM25 as elevation 5
source. The images are taken at a scale of 1:35 000 with a spatial resolution of 0.5 m. The snow conditions are quite good for glacier mapping. Although the images are close to saturation in some snow-covered parts and radiometrically not optimised for glacier mapping tasks, they could still be used as very valuable ground control and validation for the Landsat-based glacier mapping. It has to be noted that the aerial photographs 10
are acquired one year later than the Landsat image used. Over this one-year period length change measurements at six glaciers within the study region revealed a net re-treat of the termini between 3 and 7 m (Kjøllmoen et al., 2005), the average rere-treat being 4.7 m. This retreat is considered negligible compared with the 30 m resolution of the Landsat data.
15
3.3.2 Digital glacier outlines 2004
New glacier outlines for the N50 map sheet 1418-2 Mørkridsdalen were measured by Statens Kartverk based on the aerial photographs of 2004 using digital photogrammet-ric methods (Fig. 1) and made available for this study. Furthermore, a series of de-tailed glacier maps are available for the three long-term mass-balance glaciers within 20
the study region, Storbreen, Hellstugubreen and Gr ˚asubreen (S, H and G, Fig. 1). These maps are described in detail in Andreassen (1999), Andreassen et al. (2002) and Haakensen (1986). Here, these data were used for comparison with the N50 data constructed by Statens Kartverk.
TCD
2, 299–339, 2008A new Landsat-derived glacier inventory for
Jotunheimen L. M. Andreassen et al. Title Page Abstract Introduction Conclusions References Tables Figures ◭ ◮ ◭ ◮ Back Close Full Screen / Esc
Printer-friendly Version Interactive Discussion 3.4 Previous glacier inventories
The first detailed list of the number and areas of glaciers in Norway was made by Olav Liestøl in 1958 and published by Hoel and Werenskiold (p. 35–54, 1962). The list was based on topographic maps from the Norwegian Geographical Survey (Norsk Geografisk Oppm ˚aling) at a scale of 1:100 000, and for some regions on aerial pho-5
tographs from the 1940s and 1950s. Unfortunately, some of the topographic maps used were old and inaccurate, and in many cases the glaciers have been drawn too large (Østrem, 1960; Østrem and Haakensen, 1993). The first detailed glacier inventory of Southern Norway was published in 1969 (Atlas69; Østrem and Ziegler, 1969). The reg-istration of the glaciers was based upon photographs from the period 1965–1968 as 10
well as on topographic maps to the scale 1:50 000 and 1:100 000. In the study region the aerial photographs are from 1965–1966. Glacier area was calculated by mechani-cally planimetering the surface. A revised and extended glacier inventory for southern Norway was completed in the late 1980s based on aerial photography from the period 1969–1984 (Atlas88; Østrem et al., 1988). Both inventories contained basic inventory 15
data such as glacier name (if known), length, area, and minimum and maximum eleva-tions. The Atlas88 also contained the mean aspect direction of the accumulation and ablation areas and information on glacier types and morphology. In both inventories, each glacier unit was given a number between 1 and 110 for each hydrological basin. Sketch maps at the scale of 1:250 000 displayed all the identified glaciers including 20
their number within each drainage basin or group of basins. To our knowledge, no comparison between the 1965–1968 (Atlas69) and 1969–1984 (Atlas88) inventories has been conducted so far.
TCD
2, 299–339, 2008A new Landsat-derived glacier inventory for
Jotunheimen L. M. Andreassen et al. Title Page Abstract Introduction Conclusions References Tables Figures ◭ ◮ ◭ ◮ Back Close Full Screen / Esc
Printer-friendly Version Interactive Discussion
4 Methods
4.1 Glacier delineation
As a first step, the quality of the georeference and orthorectification process of the Landsat TM image from 2003 was tested against 14 check points (CPs; typically lake edges or islands in lakes) within the Orthoengine software (© PCI Geomatica). This 5
test revealed a horizontal RMSE of 0.65 pixels, i.e. 20 m. The individual channels TM3 (red: 0.63–0.69 µm), TM4 (near-infrared: 0.76–0.90 µm) and TM5 (mid-infrared: 1.55– 1.75 µm) were then exported to an ArcGIS (© ESRI) readable format where the further GIS-based processing was carried out.
Ratio images were computed from the raw digital numbers for bands TM3/TM5 and 10
TM4/TM5 and made binary using different threshold values. The resulting glacier maps were compared with a false colour composite (bands 5, 4, and 3 as RGB) of the Land-sat image from 2003 and with the digital orthophotos from 2004 in order to optimise the threshold value and assess which of the ratios, TM3/TM5 or TM4/TM5, was best suited for mapping the glaciers in the study region. In general, both ratios gave good 15
results, and by adjusting the threshold value the glacier outlines could have been de-rived from either. However, the TM3/TM5 ratio showed better performance for ice sit-uated in shadow and for dirty and debris covered ice (Fig. 2). We therefore decided to prefer the TM3/TM5 ratio over the TM4/TM5 ratio for the glacier delineation. An optimal threshold value was chosen and pixels were finally classified as ice or snow 20
when (TM3/TM5)>2.0. The good quality of the automatic method for the Landsat data used is illustrated for the Hellstugubreen, where orthophotos from 2004 showed pre-cise agreement with the automatic mapping (Fig. 3).
As a next step, we applied a median filter (3 by 3 kernel) to the classified binary image to reduce noise in shadow regions and remove isolated pixels outside the glaciers 25
(usually snow patches), although this filter is also known to close small voids in the glacier areas (e.g. due to rock outcrops) and reduces the size of small glaciers to some extent (Paul, 2002, 2007). The median-filtered glacier map was raster-to-vector
TCD
2, 299–339, 2008A new Landsat-derived glacier inventory for
Jotunheimen L. M. Andreassen et al. Title Page Abstract Introduction Conclusions References Tables Figures ◭ ◮ ◭ ◮ Back Close Full Screen / Esc
Printer-friendly Version Interactive Discussion converted within ArcGIS and glacier polygons were obtained.
We accepted only ice bodies of larger than 0.01 km2 for our inventory. Thus, poly-gons with a size of 9 pixels or smaller were excluded from the further editing and iden-tification process. Then, all mapped snow and ice polygons were visually inspected. For a few glaciers (eight out of 417) the outlines were corrected manually for debris 5
cover. The applied corrections were in most cases small, also because the glaciers in the study region show little debris cover. A much larger manual effort was required for excluding lakes that were wrongly classified as glaciers, a well-known problem when applying TM3/TM5 ratios for ice and snow mapping (Raup et al., 2007). The most challenging task, however, was deciding on what to include as glacier surface and 10
what should belong to a specific glacier. Especially for some of the smaller polygons it was difficult to determine whether this was seasonal or perennial snow or a glacier be-ing disintegrated. For some of the larger polygons snow ridges attached to the glacier had to be judged and possibly cut. As a general rule, we included all features with bare ice exposed. A few snow fields were excluded from the glacier polygons by intersecting 15
the glacier outlines with a manually digitised glacier basin vector layer (see following section).
4.2 Identifying individual glaciers
To compare glacier inventories from different times and determine glacier specific changes, glaciers need to be identified by a unique number (glacier-ID). The two pre-20
vious inventories of southern Norway exist only as tabular digital data. Each of these inventories was compiled as a separate database with its own glacier IDs. The World Glacier Inventory (WGI) contains data from the first inventory, Atlas69, and the WGI code is thus available for each of the glaciers included in the first inventory. The sec-ond inventory, Atlas88, exists as tabular data in an internal NVE database with an 25
automatically assigned and unique code for the glaciers in southern Norway. The co-ordinates available for each glacier from both inventories turned out to be too coarse (1 arc minute resolution) to be suitable as an identifying point layer in a GIS linking both
TCD
2, 299–339, 2008A new Landsat-derived glacier inventory for
Jotunheimen L. M. Andreassen et al. Title Page Abstract Introduction Conclusions References Tables Figures ◭ ◮ ◭ ◮ Back Close Full Screen / Esc
Printer-friendly Version Interactive Discussion old inventories. Furthermore, the glacier numbers and basins used are not identical in
the two inventory issues. A few of the smaller glaciers can be found in one inventory but not in the other, most probably due to difficulties in judging whether it was a glacier or a permanent snow field. For a few composite glaciers and ice caps the ice divides or catchment basins were shifted between the two inventories. In some cases glaciers 5
were separated into two or more parts or merged between the pre-existing inventories. Such challenges made a consistent identification of individual glaciers from the Atlas69 and Atlas88 difficult.
As a consequence we decided to create a new Landsat ID for each glacier identi-fied from the 2003 Landsat data. In total, the number of glaciers within the new 2003 10
inventory is nearly 50% larger compared with the previous inventories, mainly due to inclusion of many small entities that were not included in the old inventories. In the Atlas69, perennial snow fields were omitted due to the difficulty in determining the out-lines of such snow fields and only glaciers and glacierets were included (Østrem and Ziegler, 1969). Thereby the criterion for a glacier was that the ice mass showed clear 15
signs of movement. This has not been a criterion in the new Landsat-derived inven-tory as the resolution is much coarser and identifying signs of ice flow or separating seasonal snow from perennial snow and perennial snow from glaciers or ice remnants can be very difficult. In the new inventory, a few glaciers had separated since the previ-ous inventory and each part was assigned an individual ID. For the composite glaciers, 20
glacier basin maps were digitized on screen using the divides from the sketch maps as guidelines together with contour lines from N50 topographic maps as background.
Finally, we manually linked the new Landsat IDs to the two former inventories by adding the NVE-code from the Atlas88 and the glacier atlas number from the two in-ventories so that the tabular inventory data could be compared. However, for many of 25
the smallest glaciers it was often uncertain which glacier the point information stored in the older glacier inventories belonged to. Furthermore, it was impossible to reconstruct glacier basin maps precisely from the sketch maps in the old inventories. Although the majority of the glaciers could still be identified reliably due to names and map
informa-TCD
2, 299–339, 2008A new Landsat-derived glacier inventory for
Jotunheimen L. M. Andreassen et al. Title Page Abstract Introduction Conclusions References Tables Figures ◭ ◮ ◭ ◮ Back Close Full Screen / Esc
Printer-friendly Version Interactive Discussion tion, many glaciers had to be excluded from the quantitative comparison between the
repeat inventories. Hence, we also performed a comparison with the digitally available outlines from the N50, which could be subdivided into the same entities as with the Landsat data.
4.3 Validation 5
The glacier outlines derived from TM3/TM5 ratios were compared with new digital glacier outlines from the 2004 aerial photographs for glaciers in Breheimen (N50 map sheet 1418-2 Mørkridsdalen). Visual inspection showed that some of the smallest glaciers (area <0.3 km2) were included in the Landsat 2003 inventory (L2003) but not mapped by Statens Kartverk, and vice versa, illustrating the interpretation difficulty of 10
deciding what to finally include as a glacier. As explained above, such glacier mis-matches were excluded from the comparison. Furthermore, the Landsat-based auto-matic mapping tends to include more of the smaller glaciers than the N50-mapping. Except for these smaller glaciers, the largest differences were found for glaciers in direct contact with lakes, where generally the N50 shows less glacier area than the 15
L2003. Some of the differences for these zones may indeed be caused by glacier front retreat as the aerial photographs are taken one year later than the Landsat image.
In total, the areas of 16 glaciers (counting each composite glacier or ice cap as one) included in both data sets were compared. The total area for 2004 was 61.5 km2, and for 2003 63.0 km2, revealing a difference of −1.5 km2 or −2.4%. Thus, the N50 gave 20
less area than L2003 for this selection of glaciers. For Harbardsbreen, the area in 2003 and 2004 is 25.7 and 26.5 km2, respectively. The difference of 0.8 km2 is equal to a 10-m shrinkage of the whole perimeter. Although such a retreat is unlikely along the whole perimeter, some of the area differences between the L2003 and the N50 of 2004 could be explained by actual glacier retreat, especially in calving zones and 25
along the terminus. Compared with the 30 m resolution of Landsat the agreement is very satisfactory, especially since the algorithm was not tuned to achieve a good agreement in this test site but rather for the entire study region. Our results are similar
TCD
2, 299–339, 2008A new Landsat-derived glacier inventory for
Jotunheimen L. M. Andreassen et al. Title Page Abstract Introduction Conclusions References Tables Figures ◭ ◮ ◭ ◮ Back Close Full Screen / Esc
Printer-friendly Version Interactive Discussion to results by Paul et al. (2002) who compared glacier outlines derived from Landsat
TM with a SPOT satellite scene (10 m resolution) using a selection of 32 glaciers in the Swiss Alps. In their study the Landsat-derived area was 2.3% smaller than the SPOT-based validation data. It is also noteworthy that the glaciers in the Breheimen region have comparably many glacier-lake contacts, more snow cover and are less sharply 5
constrained by topography than in the Jotunheimen region.
5 Results
5.1 Glacier size distribution and aspect
The sample of 417 glacier units from the new 2003 Landsat inventory covers a total area of 324.1 km2(average glacier area: 0.78 km2). Figure 4a shows percentages by 10
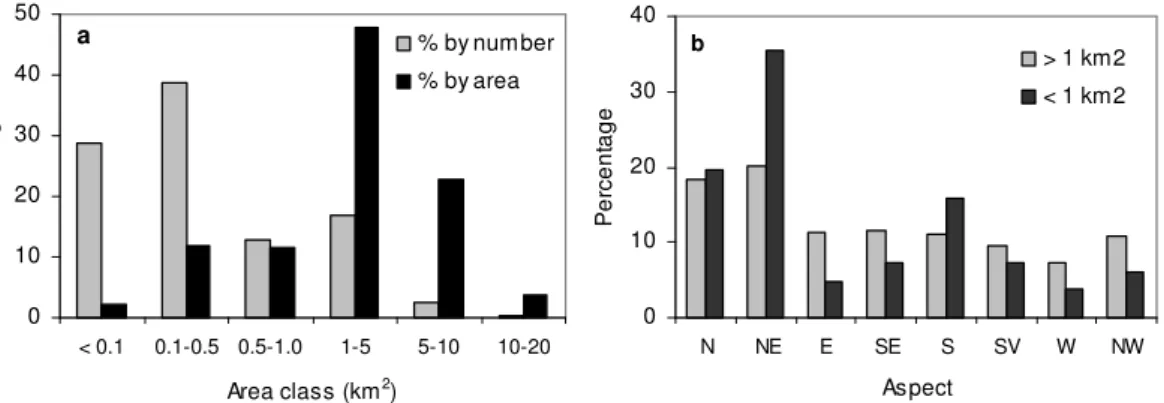
number and by area per size class for the mapped glaciers in the study area. The region is dominated by small glaciers, typical mountain glaciers (size class 1–5 km2). These form 48% of the total area, but only 17% of the total number. There is a strong asymmetry in glacier number towards smaller glaciers. Glaciers smaller than 0.5 km2 account for 68% of the number of glaciers in the sample, but they represent only 14% 15
of the glacierized area in this region. The selection of what to include as a glacier entity is somewhat subjective for very small glaciers, however, and could influence the number percentages to a certain degree.
Only one glacier unit is larger than 10 km2 (12.4 km2, a part of Harbardsbreen) and forms 4% of the glacier area. The four largest composite glaciers and ice caps, Har-20
bardsbreen (26.5 km2), Smørstabbreen (16.1 km2), Spørteggbreen (27.4 km2) and the Hol ˚abren complex (18.0 km2) form 27% of the total glacierized area (Ha, Sm, Sp and Ho in Fig. 1c).
The calculated mean aspect of the glaciers (derived from the DTM as a mean for all pixels) show that the study glaciers are orientated in all directions (Fig. 4b). The 25
TCD
2, 299–339, 2008A new Landsat-derived glacier inventory for
Jotunheimen L. M. Andreassen et al. Title Page Abstract Introduction Conclusions References Tables Figures ◭ ◮ ◭ ◮ Back Close Full Screen / Esc
Printer-friendly Version Interactive Discussion smaller than 1 km2. The outlets from the ice caps and composite glaciers will naturally
cover all aspects, but as the dominant part of the sample is based on individual glaciers, the aspect distribution shows that the location of the glaciers is more dependent on local topographical constraints rather than on exposure to radiation. This is confirmed by the missing correlation between mean glacier elevation and aspect. The increase 5
of mean slope towards smaller glaciers was only weak as the main part of the sample is formed by mountain glaciers that can form at very different locations.
5.2 Glacier change
Analyses of glacier changes were done in two ways; 1) by comparing the new Landsat outlines, L2003, with the N50 digital glacier outlines, and 2) by comparing the new 10
Landsat inventory with tabular data from the previous inventories, and for a smaller sample of glaciers, we also compare with the area given in the first detailed list of the number and areas of glaciers in Norway (Hoel and Werenskiold, 1962). The decadal rates of area changes are calculated using interest-of-interest principle.
5.2.1 Glacier change between the topographic maps (N50) and 2003 Landsat data 15
For the N50 comparison the basins and ID numbers created for the L2003 outlines were used to intersect the N50 polygons. In some cases the N50 map contained a small glacier that was not mapped in the L2003 compilation and visa versa. Such mismatches between the two data sets were excluded from the comparison. A sample of 355 glaciers was finally compared using the N50 (topographic maps) and L2003 20
outlines. The period of comparison varies within the study region: 53% of the glaciers were mapped in 1981, 20% in 1976, 16% in 1983 and 10% in 1966 (see Table 1).
In total, the glacier area is reduced from 353.1 to 316.9 km2, or 10%, in the period between the mappings. The relative area reduction is ∼4% per decade since ∼1980. The largest decadal change is found for the glaciers in the NW part (−11.8%), while 25
TCD
2, 299–339, 2008A new Landsat-derived glacier inventory for
Jotunheimen L. M. Andreassen et al. Title Page Abstract Introduction Conclusions References Tables Figures ◭ ◮ ◭ ◮ Back Close Full Screen / Esc
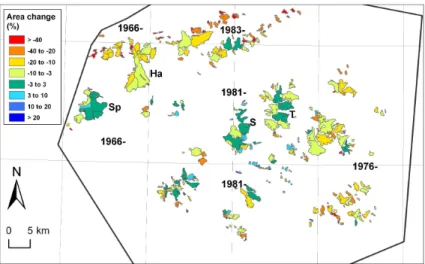
Printer-friendly Version Interactive Discussion relative area changes of all glaciers analysed are depicted in Fig. 5 where glacier
change within the uncertainty of the area change estimate, ±3%, are displayed in green. Quite a few of the larger mountain glaciers in the central part of the study region, such as Storbreen (S) and Tverr ˚abreen (T), have thus no notable changes in the period 1981–2003. There is a tendency that the relative change is more negative 5
towards the east and southeast and most of the glaciers in this region have shrunk more than 3%, many of them more than 10%. The most negative changes, however, are being found for the smaller glaciers in NW (Fig. 5). The area reduction in this region, however, is assumed to be overestimated due to the snow conditions resulting in inclusion of too much seasonal snow in the 1983 outlines (see Chapter 6).
10
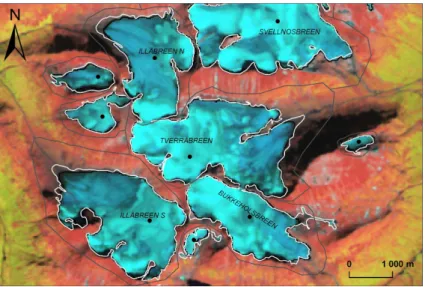
Figure 6 illustrates the glacier area changes of a selection of glaciers in the central part of Jotunheimen. The terminus of the larger glaciers Tverr ˚abreen, Ill ˚abreen S and Ill ˚abreen N have retreated markedly, the net retreat is 50–280 m since 1981. In con-trast, the smaller glaciers show smaller absolute area changes, and one of the larger glaciers, Svellnosbreen, has even advanced about 60 m between 1981 and 2003. At 15
Bukkeholsbreen the southern terminus is at about the same position as in 1981, while the northern terminus has retreated. Some of this retreat might be the reduction of snow fields adjacent to the glacier. Figure 6 also illustrates how the basins have been drawn to exclude obvious snow fields.
Generally, the scatter of individual relative changes is large, and increases towards 20
smaller glaciers (Fig. 7). The area changes for three of the largest composite glaciers and ice caps in the study region are depicted in Fig. 8a–c. In Fig. 8a retreat along the entire perimeter of Harbardsbreen is visible, an indication of thinning over the entire glacier with a total shrinkage of 11% since 1966. The Hol ˚abreen complex (Fig. 8b) shrank 15% since 1983, however, some of the shrinkage might be caused by 25
snow along the perimeter which was included in the 1983 N50 maps. Smørstabbreen (Fig. 8c) mainly retreated along two of its tongues, while other parts show no reduction; the overall shrinkage is only 2% since 1981. The largest and also the westernmost ice cap Spørteggbreen shows no notable change since 1966, and the total change of the
TCD
2, 299–339, 2008A new Landsat-derived glacier inventory for
Jotunheimen L. M. Andreassen et al. Title Page Abstract Introduction Conclusions References Tables Figures ◭ ◮ ◭ ◮ Back Close Full Screen / Esc
Printer-friendly Version Interactive Discussion ice cap is only −1% for a nearly 40 year period. The change in area grouped into size
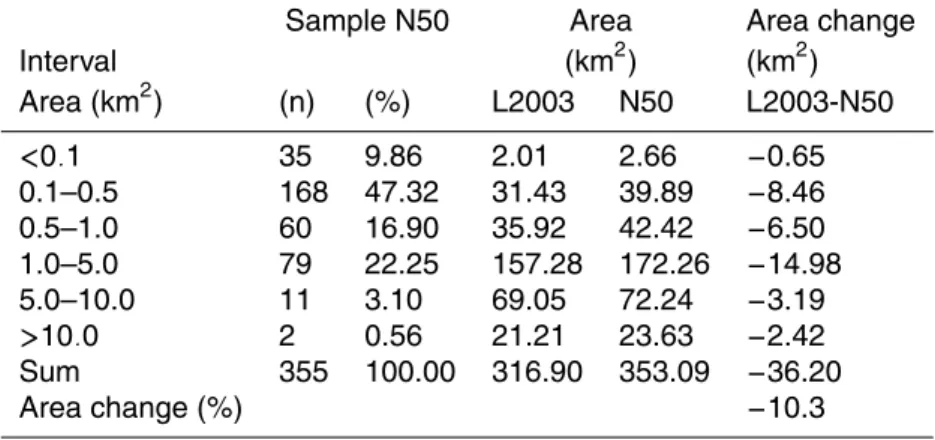
classes (according to their N50 area) shows that the reduction in glacier area is mainly caused by reduction of the mountain glaciers, but that glaciers with sizes between 0.1 and 1.0 km2also had a notable reduction (Table 2).
We also analysed the changes of the glaciers to topographic parameters derived 5
from the DTM and the glacier map: slope, aspect, mean-, minimum-, and maximum elevation, longitude and latitude. There is poor or no correlation with any of these parameters. Excluding glaciers smaller than 0.5 km2or 1.0 km2from the analysis gives a slightly higher correlation, but the correlations are still insignificant.
5.2.2 Glacier change between the 1969, 1988 and 2003 inventories 10
The sample of glaciers that could be compared with previous inventories is smaller than the sample that could be compared with N50. Units belonging to ice caps were excluded as the errors in basin delineation may be larger than the real area changes. Furthermore, for many of the smaller glaciers it was impossible to decide which L2003 unit the former inventory data referred to. Some glaciers were also excluded due to 15
problems such as glacier disintegration, merging, omittance (in one of the inventories) or suspicious table entries. When a glacier in L2003 was found to have separated into two or more units compared with the previous inventories, the related area parts in the L2003 were added and counted as one unit in the comparison sample.
In total, a sample of 161 glacier units was compared for the periods between the 20
three inventories (Table 3). Compared with the L2003 inventory most of the smallest glaciers (<0.1 km2) and some of the largest glacier units (belonging to ice caps) are excluded, in total nearly half of the glaciers and one third of the area. In this sam-ple, mountain glaciers (size class 1–5 km2) represent one third in number and more than half of the area (Table 3). The total area of the 161 glaciers was reduced from 25
229.5 km2 in 1965/1966 (Atlas69) to 213.6 km2 in ∼1980 (Atlas88) and 201.0 km2 in 2003 (L2003). The total reduction was thus 28.5 km2 or 12% for the 38 year period. The decadal reduction is 3.3% for the whole period, 5.0% per decade for the first period
TCD
2, 299–339, 2008A new Landsat-derived glacier inventory for
Jotunheimen L. M. Andreassen et al. Title Page Abstract Introduction Conclusions References Tables Figures ◭ ◮ ◭ ◮ Back Close Full Screen / Esc
Printer-friendly Version Interactive Discussion 1965 to ∼1980 (Atlas88-Atlas69), and 2.3% for the last period ∼1980 to 2003
(L2003-Atlas88). The change in area grouped into size classes (according to their Atlas69 area) shows that the reduction in glacier area is mainly caused by shrinkage of the mountain glaciers (Table 3).
5.2.3 Glacier change since the 1930s 5
Finally, an attempt was made to compare the inventories with the list of glaciers by Olav Liestøl in Hoel and Werenskiold (1962). From this list we selected single glaciers with known names, which were mapped in the 1930s based on maps at the scale of 1:100 000. A sample of 38 glaciers was identified with a mean size of 3.44 km2 in the 1930s and a size range from 0.50 to 10.0 km2. The glacier area reduced from 10
130.8 km2in the 1930s to 101.2 km2in 2003 (Table 4). Thus, the total reduction is 23% for the whole period, or 3.7% per decade. Almost all this reduction occurred in the first period, 1930–1965 (Table 4). The glaciers shrank in the two last periods too, but the area reduction was much smaller.
5.3 Uncertainties in area assessments 15
The mapped area of a glacier is dependent on the degree of generalisation of the glacier outline decided on by the operator, for example on what to include or exclude as perennial and seasonal snow or debris-covered ice. As an example we show a sequence of detailed outlines of Storbreen and the resulting glacier area in Fig. 9. The outlines are based on detailed glacier maps at the scale of 1:10 000 together with 20
the N50 and L2003 outlines. The outlines for glacier maps are typically edited and generalized, but a few possible snow ridges are still connected to the margins (e.g. in the map from 1940 and 1968). Figure 9a also illustrates that the N50 outline from 1981 divides the glacier terminus in two parts due to a medial moraine, although aerial photographs from 1981 and 1984 show that the two parts were still connected. The 25
TCD
2, 299–339, 2008A new Landsat-derived glacier inventory for
Jotunheimen L. M. Andreassen et al. Title Page Abstract Introduction Conclusions References Tables Figures ◭ ◮ ◭ ◮ Back Close Full Screen / Esc
Printer-friendly Version Interactive Discussion and 5.16 km2 respectively, while the detailed glacier map from 1984 reveals an area
of 5.35 km2. This indicates an increase in area of about 3% compared with N50 and Atlas88, although the terminus retreated 10 m since 1981 (Fig. 9b). Thus, the increase in glacier area from 1981 represents how the area estimates may vary due to different operators and methods rather than an actual change in glacier area.
5
In Fig. 10 we further compare the glacier area from N50 with the glacier area from the Atlas88 for a sample of 116 glaciers mapped using aerial photographs from 1981. Three glaciers were excluded from this sample as they had an unrealistic size in At-las88 compared with Atlas69 and L2003. The total area for the glaciers calculated from N50 gives an area of 111.9 km2, while the inventory area is 114.7 km2, in other words 10
the inventory area is 2% larger than the N50 area. The resulting RMSE is 0.11 km2. Some of the scatter could be errors due to misidentification when coupling the Atlas88-ID numbers with the N50-outlines, or due to uncertainties in matching Atlas88 glaciers with many small overlapping glaciers, adjacent perennial snow banks etc. from the N50. A stricter selection of the sample would give an even better agreement and lower 15
RMSE; but overall the agreement in area between the two datasets is acceptable.
6 Discussion
6.1 Uncertainties in outline mapping and area assessments
The comparison with validation data from 2004 confirms earlier studies in other regions and shows that Landsat data can be used to map glacier extent in the region studied 20
here with highly satisfying accuracy. In contrast to many other glacierised regions in the world where debris cover and cast shadow can be a significant problem (e.g. Williams et al., 1997; Paul et al., 2004b; Kargel et al., 2005; Raup et al., 2007), very few corrections were needed in the Jotunheimen and Breheimen region. The largest challenge and the most laborious task was the interpretation and identification of indi-25
TCD
2, 299–339, 2008A new Landsat-derived glacier inventory for
Jotunheimen L. M. Andreassen et al. Title Page Abstract Introduction Conclusions References Tables Figures ◭ ◮ ◭ ◮ Back Close Full Screen / Esc
Printer-friendly Version Interactive Discussion inventories, as neither digital outlines nor coordinates with a sufficient accuracy for the
glacier IDs connected to the tabular data were available.
There are several uncertainties in the area change assessments, as we compared glacier areas derived from different sources: Landsat data, tabular data from inven-tories based on aerial photography under different snow conditions and topographic 5
maps. Each method has its specific uncertainties, so calculated area changes may partly be due to differences in methods or human intervention rather than real glacier changes. Several decisions by the operator will influence the resulting area: the oper-ator must decide on which regions are wrongly classified as lakes, on what to include as perennial snow or to exclude as seasonal snow, which parts of a glacier are debris 10
covered and on the location of ice divides. The selection process on what to recog-nize as a glacier is thus quite subjective and will influence the value of the average absolute and relative change of glaciers. Small changes in glacier area (±3%) are not necessarily a reliable measure of glacier shrinkage or increase, but could rather be due to different interpretation by the operator(s) as well as differences in snow conditions 15
at the time of image acquisition. The latter is particularly crucial for the quality of the derived inventory data.
In the GLIMS Analysis Comparison Experiments (GLACE 1 and 2), the consistency of data provided by different analysts were studied revealing that interpretation errors and differences can be a significant problem resulting in non-uniform glacier outlines 20
(Raup et al., 2007). In the experiment GLACE 2 analyses of the same glacier system in two images separated by nine years, showed a slight increase in area for some analyses, while others showed a slight decrease (Raup et al., 2007).
The finding that the N50 glacier area is smaller than the Atlas88 area in the central part of Jotunheimen is somewhat surprising as the N50-maps over other areas tend to 25
include too much snow covered regions. As mentioned, the area reduction calculated from the N50 is probably overestimated for the NW parts mapped in 1983 as the N50 dataset in this region includes many snowfields. This illustrates that the quality of the N50 glacier outlines will vary for the different map-sheets and that results should be
in-TCD
2, 299–339, 2008A new Landsat-derived glacier inventory for
Jotunheimen L. M. Andreassen et al. Title Page Abstract Introduction Conclusions References Tables Figures ◭ ◮ ◭ ◮ Back Close Full Screen / Esc
Printer-friendly Version Interactive Discussion terpreted with care when snow-conditions are unfavourable or outlines look suspicious.
6.2 Glacier changes
A comparison of the calculated decadal relative changes in area for the three samples of glaciers reveals that the decadal area decrease has declined over the period anal-ysed (Fig. 11). The sample of 38 glaciers shows decreasing rates for each of the three 5
periods, the NGI sample of 161 glaciers being also more negative in the first period than in the second. From Fig. 11 it is also obvious that the rate of change depends on the sample analysed; the sample of 38 glaciers has a larger mean size (2.8 km2 in 1965) than the NGI sample of 161 glaciers (mean size in 1965:1.4 km2) and gives thus smaller decadal rates in area change. This dependence of the mean change on 10
the size class distribution of the analyzed sample has been noted in previous studies (e.g. Paul et al., 2004a) and limits the direct comparability among different regions to some extent.
The strong reduction in glacier area in the period 1930s–1965 is also seen in the glacier length observations. The glaciers in Jotunheimen (as well as most other 15
glaciers in Norway) retreated markedly in this period (Østrem and Haakensen, 1993; Andreassen et al., 2005). This period includes “the early 20th century warming” in the 1930s (Hanssen-Bauer, 2005). Measurements at Storbreen reveal both strong retreat and negative mass balance in this period (Fig. 9b). No mass balance measurements are available until 1949 at Storbreen, but estimates based on climate observations in-20
dicate that the period 1930–1960 was a period with particular negative mass balances for glaciers in eastern Norway (Nesje et al., 2008). The overall changes since 1969 and 1980s are notable, although smaller than in the 1930s–1965 period. The transient mass surplus in the period 1989–1995 may explain the slower rate of area shrinkage of the glaciers since the 1980s and, in some cases, also the area increase. The glacier 25
changes in Jotunheimen and Breheimen are highly individual and show a large scatter, both in absolute and relative values. The smallest glaciers display the largest scatter, as seen in other regions (Paul et al., 2004a; Citterio et al., 2007).
TCD
2, 299–339, 2008A new Landsat-derived glacier inventory for
Jotunheimen L. M. Andreassen et al. Title Page Abstract Introduction Conclusions References Tables Figures ◭ ◮ ◭ ◮ Back Close Full Screen / Esc
Printer-friendly Version Interactive Discussion The 12% (∼3.2% per decade) reduction in glacier area since 1965 and ∼6% (∼3%
per decade) since ∼1980 in Jotunheimen and Breheimen is comparable to other parts of the world with mountain and valley glaciers. In the Swiss Alps the area change was −2.8% per decade for the period 1850–1973 and 6.4% per decade for the period 1973–1998/1999. However, as little overall glacier area change was observed from 5
1973 to 1985, the mean decadal change increased to −14% from 1985 to 1998/1999 (Paul et al., 2004a). Inventory results from the Austrian Alps show a net reduction of glacier area of 17% between 1969 and 1998 (Lambrecht and Kuhn, 2007), or −6% per decade. Results from the Tien Shan showed a 32% area reduction between 1955 and 1999 (Bolch, 2007), or −9% per decade. In Baffin Island, Arctic Canada, however, 10
the glacier shrinkage was slower than in our study area; about 1.4% per decade for the period ∼1920–2000 (Paul and K ¨a ¨ab, 2005). In contrast to the above mentioned studies, recent analysis Paul and Andreassen (20081) of the Svartisen region in north-ern Norway, show no overall glacier change over the period 1968–1999 as small area losses of mountain glaciers were compensated by area gains of small cirques and 15
glacierets. Further comparisons of glacier area change throughout the world can be found in Barry (2006).
7 Conclusions
We have demonstrated that the technical process of glacier mapping using Landsat imagery is straight-forward and accurate in a region with sparse debris cover on the 20
glaciers. A larger challenge is the interpretation and identification of individual glaciers and linking the new inventory with previous inventories. Assessing area changes between repeat inventories still requires much manual work and glaciological expert knowledge. In order to make remote-sensing-based glacier mapping even more
appli-1
Paul, F. and Andreassen, L. M.: Creating a glacier inventory for the Svartisen area (Norway) from Landsat ETM+ satellite data: Challenges and results, unpublished manuscript, 2008.
TCD
2, 299–339, 2008A new Landsat-derived glacier inventory for
Jotunheimen L. M. Andreassen et al. Title Page Abstract Introduction Conclusions References Tables Figures ◭ ◮ ◭ ◮ Back Close Full Screen / Esc
Printer-friendly Version Interactive Discussion cable, future research should work towards reducing the large amount of operator work
needed for identifying individual glaciers and related human-induced uncertainties, for example using statistical tests, elements of expert decision systems, or object-oriented classifications that would allow for including former inventory data in the multi-spectral classification of glaciers.
5
There are several uncertainties in the area change assessments, as we compared glacier areas derived from different sources. Each method has its limitations, and calculated area changes may partly be caused by differences in methods or human intervention. The amount of seasonal snow remaining is therefore a crucial point when selecting satellite imagery for a new glacier inventory and deriving area change assess-10
ments. The accuracy of the mapping in regions that do not need manual correction is estimated to be better than 3%.
The glacier area changes in the study region are comparable to other parts of the world. The glaciers investigated shrank since the 1930s by about −23% for 38 glaciers or about −3.2% per decade. The largest reduction occurred in the first part of the 15
period, 1930–1965. Since 1965 the area reduction was 12% for 164 glaciers. This shrinkage is mainly caused by area reduction of mountain glaciers, but some glaciers have also slightly increased their size or remained stable over the last decades. Be-cause the changes in glacier size are highly individual, assessments for a large sample are necessary to obtain significant results. A correlation of the changes with other to-20
pographic factors was not found.
Acknowledgements. This work was funded by NVE and partly by the Norwegian Space Centre within the project Cryorisk. Geir Br ˚an ˚a at Statens Kartverk provided digital aerial photographs (orthophotos). Astrid Voksø, NVE, designed the geodatabase and helped with the conversion from ArcINFO to ArcGIS. Comments from Al Rasmussen and Nils Haakensen improved the
25
TCD
2, 299–339, 2008A new Landsat-derived glacier inventory for
Jotunheimen L. M. Andreassen et al. Title Page Abstract Introduction Conclusions References Tables Figures ◭ ◮ ◭ ◮ Back Close Full Screen / Esc
Printer-friendly Version Interactive Discussion
References
Albert, T.: Evaluation of remote sensing techniques for ice-area classification applied to the tropical Quelccaya ice cap, Peru, Polar Geogr., 26, 210–226, 2002.
Andreassen, L. M.: Comparing traditional mass balance measurements with long-term vol-ume change extracted from topographical maps: a case study of Storbreen glacier in
Jotun-5
heimen, Norway, in the period 1940–1997, Geogr. Ann. A, 81, 467–476, 1999.
Andreassen, L. M., Kjøllmoen, B., Knudsen, N. T., Whalley, W. B., and Fjellanger, J.: Regional change of glaciers in northern Norway, NVE Rep. 1, 122 pp., 2000.
Andreassen, L. M., Elvehøy, H., and Kjøllmoen, B.: Norges isbreer minket kraftig i 2007, Ci-cerone 2/2007, 8–9, 2007.
10
Andreassen, L. M., Elvehøy, H., Kjøllmoen, B., Engeset, R. V., and Haakensen, N.: Glacier mass balance and length variations in Norway, Ann. Glaciol., 42, 317–325, 2005.
Andreassen, L. M., Elvehøy, H., and Kjøllmoen, B.: Using aerial photography to study glacier changes in Norway, Ann. Glaciol., 34, 343–348, 2002.
Bayr, K. J., Hall, D., and Kovalick, W. M.: Observations on glaciers in the eastern Austrian Alps
15
using satellite data, Int. J. Remote Sens., 15, 1733–1742, 1994.
Barry, R. G.: The status of research on glaciers and global glacier recession: a review, Prog. Phys. Geog., 30, 285–306, 2006.
Bishop, M. P., Raup, B., K ¨a ¨ab, A., Kargel, J. S., Bishop, M. P., Hamilton, G., Leef, E., Paul, F., Raug, F., Soltesz, D, Khalsa, S. J. S., Beedle, M., and Helm, C.: Global Land Ice
Mea-20
surements from Space (GLIMS): Remote Sensing and GIS Investigations of the Earth’s Cryosphere, Geocarto International, 19, 2, 57–84, doi:10.1080/10106040408542307, 2004.
Bolch, T.: Climate change and glacier retreat in northern Tien Shan
(Kaza-khstan/Kyrgyzstan) using remote sensing data, Global Planet. Change, 56, 1–2, 1–12, doi:10.1016/j.gloplacha.2006.07.009, 2007.
25
Citterio, M., Diolaiuti, G., Smiraglia, C., D’Agata, C., Carnielli, T., Stella, G., and Siletto, B. G,: The fluctuations of Italian glaciers during the last century: A contribution to knowledge about alpine glacier changes, Geogr. Ann. A, 89 (3) , 167–184, 2007.
Elvehøy, H., Haakensen, N., Kennett, M., Kjøllmoen, B., Kohler, J., and Tvede, A.: Glasiolo-giske undersøkelser i Norge 1994 og 1995. NVE Pub., 19, 1997.
30
Engeset, R. V., Elvehøy, H., Andreassen, L. M., Haakensen, N., Kjøllmoen, B., Roald, L. A., and Roland, E.: Modelling of historic variations and future scenarios for the mass balance of
TCD
2, 299–339, 2008A new Landsat-derived glacier inventory for
Jotunheimen L. M. Andreassen et al. Title Page Abstract Introduction Conclusions References Tables Figures ◭ ◮ ◭ ◮ Back Close Full Screen / Esc
Printer-friendly Version Interactive Discussion
the Svartisen ice cap, northern Norway, Ann. Glaciol., 31, 97–103, 2000.
GCOS: The Second Report on the Adequacy of the Global Observing Systems for Climate in Support of the UNFCCC. GCOS-82 (WMO/TD 1143), 2003.
Haakensen, N.: Glacier mapping to confirm results from mass balance measurements, Ann. Glaciol., 8, 73–77, 1986.
5
Haeberli, W.: Integrated perception of glacier changes: a challenge of historical dimensions, in: Glacier Science and Environmental Change, Blackwell, edited by: Knight, P. G., Oxford, 423–430, 2006.
Hanssen-Bauer, I.: Regional temperature and precipitation series for Norway: analyses of time series updated to 2004, Met.no Rep., 15/2005, 34 pp., 2005.
10
Hoel, A. and Werenskiold, W.: Glaciers and snowfields in Norway, Norsk Polarinstitutt Skrifter, 114, 291 pp., 1962.
IPCC: Climate Change 2007: Synthesis Report, Contribution of Working Groups I, II and III to the Fourth Assessment Report of the Intergovernmental Panel on Climate Change, IPCC, Geneva, Switzerland, 104 pp., 2007.
15
Jacobs, J. D., Simms, ´E. L., and Simms, A.: Recession of the southern part of Barnes Ice Cap,
Baffin Island, Canada, between 1961 and 1993, determined from digital mapping of Landsat TM. J. Glaciol., 43, 98–102, 1997.
K ¨a ¨ab, A., Paul, F., Maisch, M., Hoelzle, M., and Haeberli, W.: The new remote-sensing-derived Swiss glacier inventory: II, First results, Ann. Glaciol., 34, 362–366, 2002.
20
Kargel, J. S., Abrams, M. J., Bishop, M. P., Bush, A., Hamilton, G., Jiskoot, H., K ¨a ¨ab, A., Ki-effer, H. H., Lee, E. M., Paul, F., Rau, F., Raup, B., Shroder, J. F., Soltesz, D., Stainforth, D., Stearns, L., and Wessels, R.: Multispectral imaging contributions to global land ice mea-surements from space, Remote Sens. Environ., 99(1–2), 187–219, 2005.
Kjøllmoen, B., Andreassen, L. M., Engeset, R. V., Elvehøy, H., and Jackson, M.: Glaciological
25
investigations in Norway 2004, NVE Rep., 2, 90 pp., 2005.
Kjøllmoen, B., Andreassen, L. M., Elvehøy, H., Jackson, M., Tvede, A. M., Laumann, T., and Giesen, R. H.: Glaciological investigations in Norway 2006, NVE Rep.,1, 99 pp., 2007. Lambrecht, A. and Kuhn, M.: Glacier changes in the Austrian Alps during the last three
decades, derived from the new Austrian glacier inventory, Ann. Glaciol., 46, 177–184, 2007.
30
Nesje, A., Bakke, J., Dahl, S. O., Lie, Ø., and Matthews, J. A.: Norwegian mountain glaciers in the past, present and future, Global Planet. Change, 60, 10–27, 2008.
TCD
2, 299–339, 2008A new Landsat-derived glacier inventory for
Jotunheimen L. M. Andreassen et al. Title Page Abstract Introduction Conclusions References Tables Figures ◭ ◮ ◭ ◮ Back Close Full Screen / Esc
Printer-friendly Version Interactive Discussion
210–243, 1960.
Østrem, G. and Haakensen, N.: Glaciers of Norway, in: Satellite image atlas of glaciers of the world, edited by: Williams, R. S. and Ferrigno, J. G., U.S. Geological Survey, Professional Paper, 1386-E-3, 53 pp., 1993.
Østrem, G. and Ziegler, T.: Atlas over breer i Sør-Norge. (Atlas of glaciers in South Norway).
5
Hydrologisk avdeling, Norges Vassdrags- og Elektrisitetsvesen, Meddelelse, 20, 207 pp., 1969.
Østrem, G., Dale Selvig, K., and Tandberg, K.: Atlas over breer i Sør-Norge. (Atlas of glaciers in South Norway). Hydrologisk avdeling, Norges Vassdrags- og Energiverk, Meddelelse, 61, 180 pp., 1988.
10
Østrem, G., Haakensen, N., and Melander, O.: Atlas over breer i Nord-Skandinavia. (Glacier atlas of Northern Scandinavia), Hydrologisk avdeling, Norges Vassdrags- og Energiverk, Meddelelse, 22, 315 pp., 1973.
Øyen, P. A.: Klima und Gletscherschwankungen in Norwegen, Zeitschrift f ¨ur Gletscherkunde, 1, 46–61, 1906.
15
Paul, F.: Changes in glacier area in Tyrol, Austria, between 1969 and 1992 derived from Landsat 5 Thematic Mapper and Austrian glacier inventory data, Int. J. Remote Sens., 23, 787–799, 2002.
Paul, F.: The New Swiss Glacier Inventory 2000–Application of Remote Sensing and GIS, Schriftenreihe Physische Geographie, Universit ¨at Z ¨urich, 52, 210 pp., 2007.
20
Paul, F. and K ¨a ¨ab, A.: Perspectives on the production of a glacier inventory from multispectral satellite data in the Canadian Arctic: Cumberland Peninsula, Baffin Island, Ann. Glaciol., 42, 59–66, 2005.
Paul, F., K ¨a ¨ab, A., Maisch, M., Kellenberger, T. W., and Haeberli, W.: The new remote sensing-derived Swiss glacier inventory: I. Methods, Ann. Glaciol., 34, 355–361, 2002.
25
Paul, F., Huggel, C., K ¨a ¨ab, A., and Kellenberger, T.: Comparison of TM-derived glacier areas with higher resolution data sets, EARSeL Workshop on Remote Sensing of Land Ice and Snow, Bern, 11.-13.3.2002, EARSeL eProceedings, 2, 15–21, 2003.
Paul, F., K ¨a ¨ab, A., Maisch, M., Kellenberger, T., and Haeberli, W.: Rapid
disintegra-tion of Alpine glaciers observed with satellite data, Geophys. Res. Lett., 31, L21402,
30
doi:10.1029/2004GL020816, 2004a.
Paul, F., Huggel, C., and K ¨a ¨ab, A.: Combining satellite multispectral image data and a digital elevation model for mapping of debris-covered glaciers, Remote Sens. Environ., 89 (4), 510–
TCD
2, 299–339, 2008A new Landsat-derived glacier inventory for
Jotunheimen L. M. Andreassen et al. Title Page Abstract Introduction Conclusions References Tables Figures ◭ ◮ ◭ ◮ Back Close Full Screen / Esc
Printer-friendly Version Interactive Discussion
518, 2004b.
Raup, B. H., K ¨a ¨ab, A., Kargel, J. S., Bishop, M. P., Hamilton, G., Lee, E., Paul, F., Rau, F., Soltesz, D., Khalsa, S. J. S., Beedle, M., and Helm, C.: Remote Sensing and GIS technology in the Global Land Ice Measurements from Space (GLIMS) Project, Comput. Geosci., 33, 104–125, 2007.
5
Sidjak, R. W. and Wheate, R. D.: Glacier mapping of the Illecillewaet icefield, British Columbia, Canada, using, Landsat TM and digital elevation data, Int. J. Remote Sens., 20, 273–284, 1999.
Williams, Jr., R. S., Hall, D. K., Sigurdsson, O., and Chien, J. Y. L.: Comparison of satellite-derived with ground-based measurements of the fluctuations of the margins of Vatnaj ¨okull,
10
TCD
2, 299–339, 2008A new Landsat-derived glacier inventory for
Jotunheimen L. M. Andreassen et al. Title Page Abstract Introduction Conclusions References Tables Figures ◭ ◮ ◭ ◮ Back Close Full Screen / Esc
Printer-friendly Version Interactive Discussion
Table 1.Comparison of glacier area of N50 and 2003 for 355 glacier units per N50 map sheet. The year of N50 mapping and the map sheets are given. See Fig. 1b for location of map sheets.
Map year Map sheet Part Sample Sample Area N50 Area 2003 Diff Diff Area N50 N50 of area n (%) (km2) (km2) (%) (%/10a) (%) 1966 1418-1,2 West 37 10.4 78.6 70.0 −10.9 −3.1 22.2 1976 1617-4, 1618-3 East 72 20.3 65.6 56.8 −13.4 −5.3 18.6 1981 1517-1,3,4,1518-2,3 Central 189 53.2 164.3 154.9 −5.7 −2.7 46.5 1983 1518-1,4 NorthWest 57 16.1 44.7 35.2 −21.2 −11.8 12.6 Total 355 100.0 353.1 316.9 −10.3 −4.2 100.0
TCD
2, 299–339, 2008A new Landsat-derived glacier inventory for
Jotunheimen L. M. Andreassen et al. Title Page Abstract Introduction Conclusions References Tables Figures ◭ ◮ ◭ ◮ Back Close Full Screen / Esc
Printer-friendly Version Interactive Discussion
Table 2.Comparison of glacier area of N50 and 2003 per glacier size class.
Sample N50 Area Area change
Interval (km2) (km2) Area (km2) (n) (%) L2003 N50 L2003-N50 <0.1 35 9.86 2.01 2.66 −0.65 0.1–0.5 168 47.32 31.43 39.89 −8.46 0.5–1.0 60 16.90 35.92 42.42 −6.50 1.0–5.0 79 22.25 157.28 172.26 −14.98 5.0–10.0 11 3.10 69.05 72.24 −3.19 >10.0 2 0.56 21.21 23.63 −2.42 Sum 355 100.00 316.90 353.09 −36.20 Area change (%) −10.3
TCD
2, 299–339, 2008A new Landsat-derived glacier inventory for
Jotunheimen L. M. Andreassen et al. Title Page Abstract Introduction Conclusions References Tables Figures ◭ ◮ ◭ ◮ Back Close Full Screen / Esc
Printer-friendly Version Interactive Discussion
Table 3. Comparison of glacier area for 161 glacier units from three different inventories:
At-las69, Atlas88 and L2003. The Atlas69 are based on aerial photographs from 1965–1966, the Atlas88 are based on aerial photographs from 1976–1984. The area in Atlas69 is used as reference for area size determination.
Interval Sample Atlas69 Area (km2) Area change (km2)
Area (km2) (n) (%) NGI69 NGI88 L2003 L2003-NGI88 NGI88-NGI69 L2003-NGI69
<0.1 8 5.0 0.27 0.35 0.34 −0.01 0.08 0.07 0.1–0.5 64 39.8 15.30 14.92 13.55 −1.37 −0.38 −1.75 0.5–1.0 27 16.8 21.17 18.61 17.03 −1.58 −2.56 −4.14 1.0–5.0 54 33.5 133.24 125.70 118.65 −7.05 −7.54 −14.59 5.0–10.0 7 4.3 49.05 44.13 42.71 −1.42 −4.92 −6.34 >10.0 1 0.6 10.50 9.87 8.76 −1.11 −0.63 −1.74 Sum 161 100.0 229.53 213.58 201.04 −12.54 −15.95 −28.49 Area change (%) −5.9 −6.9 −12.4
TCD
2, 299–339, 2008A new Landsat-derived glacier inventory for
Jotunheimen L. M. Andreassen et al. Title Page Abstract Introduction Conclusions References Tables Figures ◭ ◮ ◭ ◮ Back Close Full Screen / Esc
Printer-friendly Version Interactive Discussion
Table 4.Comparison of glacier area for 38 glaciers since the 1930s.
Source 1930s Atlas69 Atlas88 L2003 Net area change (km2)
Map year 1931–1934 1965 1976/81 2003 1965–1930 1976/81–1965 2003–1981
Area (km2) 130.8 106.5 103.8 101.2 24.23 −2.76 −2.60
TCD
2, 299–339, 2008A new Landsat-derived glacier inventory for
Jotunheimen L. M. Andreassen et al. Title Page Abstract Introduction Conclusions References Tables Figures ◭ ◮ ◭ ◮ Back Close Full Screen / Esc
Printer-friendly Version Interactive Discussion
Fig. 1. (a)Location map of southern Norway with a false colour composite of bands 543 (as RGB) of the Landsat TM scene (199–17) and extent of study area. (b) The N50 map sheets and
glaciers in the study area. (c) Glaciers (>0.01 km2) in the Breheimen and Jotunheimen region.
Letter codes denote: Sp: Spørteggbreen, Ha: Harbardsbreen, Ho: Hol ˚abreen, Fa: Fanar ˚aken, Sm: Smørstabbreen, S: Storbreen, HI: Heimre Ill ˚abreen, T: Tverr ˚abreen, H: Hellstugubreen, G: Gr ˚asubreen.
TCD
2, 299–339, 2008A new Landsat-derived glacier inventory for
Jotunheimen L. M. Andreassen et al. Title Page Abstract Introduction Conclusions References Tables Figures ◭ ◮ ◭ ◮ Back Close Full Screen / Esc
Printer-friendly Version Interactive Discussion
Fig. 2.Performance of the automatic mapping method using thresholded band ratios TM4/TM5 and TM3/TM5 in an area with cast shadow (Heimre Ill ˚abreen; HI in Fig. 1c) and the terminus of Harbardsbreen (Ha in Fig. 1c). To the left the outlines with the Landsat scene as background, to the right the orthophotos in the background.
TCD
2, 299–339, 2008A new Landsat-derived glacier inventory for
Jotunheimen L. M. Andreassen et al. Title Page Abstract Introduction Conclusions References Tables Figures ◭ ◮ ◭ ◮ Back Close Full Screen / Esc
Printer-friendly Version Interactive Discussion
Fig. 3. Glacier outlines (in black) mapped from Landsat TM using a thresholded ratio image of band TM3/TM5 with the orthophotos from 2004 in the background. The terminus of Hell-stugubren retreated 5 m from 2003 to 2004 (Kjøllmoen et al., 2005).
TCD
2, 299–339, 2008A new Landsat-derived glacier inventory for
Jotunheimen L. M. Andreassen et al. Title Page Abstract Introduction Conclusions References Tables Figures ◭ ◮ ◭ ◮ Back Close Full Screen / Esc
Printer-friendly Version Interactive Discussion 0 10 20 30 40 50 < 0.1 0.1-0.5 0.5-1.0 1-5 5-10 10-20 Area class (km2) P e rc e n ta g e % by number % by area a 0 10 20 30 40 N NE E SE S SV W NW Aspect P e rc e n ta g e > 1 km2 < 1 km2 b
Fig. 4.Bar graphs showing percentages of (a) the glacier area and number per size class and
(b)the aspect orientation of the Jotunheimen and Breheimen region (sample of 417 glaciers).
TCD
2, 299–339, 2008A new Landsat-derived glacier inventory for
Jotunheimen L. M. Andreassen et al. Title Page Abstract Introduction Conclusions References Tables Figures ◭ ◮ ◭ ◮ Back Close Full Screen / Esc
Printer-friendly Version Interactive Discussion
Fig. 5. Colour coded relative area change per glacier from N50 (1966–1983) to 2003. Let-ter codes denote: Sp: Spørteggbreen, Ha: Harbardsbreen, S: Storbreen, T: Tverr ˚abreen, H: Hellstugubreen. See also Fig. 1.
TCD
2, 299–339, 2008A new Landsat-derived glacier inventory for
Jotunheimen L. M. Andreassen et al. Title Page Abstract Introduction Conclusions References Tables Figures ◭ ◮ ◭ ◮ Back Close Full Screen / Esc
Printer-friendly Version Interactive Discussion
Fig. 6.Glacier changes from 1981 (N50 maps: white outlines) to 2003 (Landsat: black outlines) for a sample of glaciers in central Jotunheimen. The digitized glacier basins and ID points are also shown.
TCD
2, 299–339, 2008A new Landsat-derived glacier inventory for
Jotunheimen L. M. Andreassen et al. Title Page Abstract Introduction Conclusions References Tables Figures ◭ ◮ ◭ ◮ Back Close Full Screen / Esc
Printer-friendly Version Interactive Discussion N50 (1966-1983) to L2003 -100 % -80 % -60 % -40 % -20 % 0 % 20 % 40 % 0.01 0.1 1 10 100 Area N50 (km2) A re a c h a n g e 1966 1976 1981 1983
Fig. 7.Relative area changes glacier from N50 (1966–1983) to 2003. Two outliers (>80%) are outside the y-axis and are not shown.
TCD
2, 299–339, 2008A new Landsat-derived glacier inventory for
Jotunheimen L. M. Andreassen et al. Title Page Abstract Introduction Conclusions References Tables Figures ◭ ◮ ◭ ◮ Back Close Full Screen / Esc
Printer-friendly Version Interactive Discussion
Fig. 8.Changes of three of the largest glaciers and ice caps from the N50-maps to 2003. Note that the scale and year of N50 differs. See Fig. 1c for location.
TCD
2, 299–339, 2008A new Landsat-derived glacier inventory for
Jotunheimen L. M. Andreassen et al. Title Page Abstract Introduction Conclusions References Tables Figures ◭ ◮ ◭ ◮ Back Close Full Screen / Esc
Printer-friendly Version Interactive Discussion 0 1 2 3 4 5 6 7 1930 1940 1950 1960 1970 1980 1990 2000 2010 A re a ( k m 2) -16 -14 -12 -10 -8 -6 -4 -2 0 2 C u m l e n g th (1 0 0 m ) / C u m n e t b a la n c e ( m w .e .) . area length change mass balance b)
Fig. 9. (a) Mapped extent of Storbreen from 1940 to 2003. Detailed glacier maps: 1940, 1951, 1968, 1984 and 1997, N50; 1981 and L2003. (b) Area of Storbreen calculated from the glacier maps (Andreassen, 1999) and reported in the glacier inventories 1930s (mapping year: 1931–1934), Atlas69 (1965) and Atlas88 (1981) and cumulative length change since 1933 and mass balance since 1949. Length change and mass balance data have been collected by the Norwegian Polar Institute and NVE.