Effect of Print Orientation on Mechanical Material Behavior
in Fused Deposition Modeling 3-D Printing
by
Frank Yuxing Fang B.S. Civil Engineering
Columbia University, Fu Foundation School of Engineering and Applied Science, 2016 Submitted to the Department of Civil and Environmental Engineering
in partial fulfillment of the requirements for the degree of
Master of Engineering in Civil and Environmental Engineering at the
Massachusetts Institute of Technology June 2017
0 2017 Frank Yuxing Fang. All rights reserved.
The author hereby grants to MITpermission to reproduce and to distribute publicly paper and electronic copies of this thesis document in whole or in part in any medium now known or hereafter created
Signature of Author:
Signature redacted
Department of Civil and Environmental Engineering May 12, 2017
Certified By:
Signature redacted
Caitlin T. Mueller Assistant Professor of Architecture and Civil and Environmental Engineering /I Thesis Supervisor
Accepted By:
Signature redacted
Jesse Kroll Associate Professor of Civil and Environmental Engineering
MASSACHUSETTS INSTITUTE Chair, Graduate Program Committee
OF TECHNOLOGY
Effect of Print Orientation on Mechanical Material Behavior
in Fused Deposition Modeling 3-D Printing
byFrank Yuxing Fang
Submitted to the Department of Civil and Environmental Engineering on May 12, 2017, in partial fulfillment of the requirements for the Degree of Master of Engineering in Civil and Environmental Engineering
Abstract
Additive manufacturing, also known as 3-D printing, has in recent years experienced a meteoric rise in relevance and application that has seen the technology be used in wide range of industries, from aerospace to construction to healthcare. However, many of the methods used for 3-D
printing, such as Fused Deposition Modeling (FDM), are layer-based processes, resulting in anisotropic material behavior of the printed object. Thus, the print orientation of the object is a
crucial factor in its mechanical properties, such as strength and elastic modulus.
While anisotropy in 3-D printing has been extensively studied, a gap in current research exists because previous literature only considered different orthogonal configurations of specimen
orientation. This thesis investigates the effect of print orientation on the tensile mechanical material properties of FDM printed test specimens in finer detail. By analyzing many print orientations in between the orthogonal configurations, this project seeks to develop a better, higher resolution understanding of anisotropic behavior that could inform engineers and designers about how to account for anisotropy in their prints.
Keywords: additive manufacturing, 3-D printing, FDM, anisotropy, ABS plastic Thesis Supervisor: Caitlin T. Mueller
Acknowledgements
This thesis was completed under the steady guidance and encouragement of my advisor, Professor Caitlin Mueller. Her feedback has helped greatly in moving the project forward; her passion for architecture and structural engineering has been energizing and inspirational. In the classes I have taken with Professor Mueller, I have been introduced to Grasshopper and structural optimization, as well as collaborated with architects and artists in a studio to design an installation at the Glass House. From ice shells to soft houses, I am grateful for this opportunity to learn from you. Thank you for your encouragement and patience, and for sharing with me your enthusiasm.
Several other people have had a hand in this thesis, and it would not be complete without them. Thanks to Jen and the architecture shop TAs for assisting with the 3-D printing of test specimens. Thanks to Steve for his assistance with load testing in the structural engineering laboratory. Thanks to Chrystal Chern, who started much of the work on this project before I was even at MIT.
I would like to express gratitude to Professor John Ochsendorf and Professor Gordana Herning,
who have also been at the core of my academic experience at MIT. Professor Ochsendorf first convinced me to study at MIT. He introduced me to graphic statics and impressed upon me a deeper appreciation of historic structures. His emphasis on presentation and communication skills in our design project class has helped me improve those skills, and it has been rewarding to learn from the professional engineers he has connected us with. Professor Herning has made herself available numerous times to answer any questions I had, whether it was about a problem set or job applications, and I greatly appreciate her assistance.
There are many people who have made these 9 fast-passing months at MIT unforgettable. My classmates and friends in the M.Eng Class of 2017 have been constant sources of encouragement and learning, with an infectious propensity for having fun. Thank you all for the many memories, whether it was in Room 1-141, at our weekly potlucks, or on the soccer pitch with FC Hardly Civil.
I would also like to thank several members of Professor Mueller's Digital Structures research group
- Pierre, Renaud, Nate, Mark, Yijiang, Paul, and Noor - whom I've had the pleasure of interacting
and learning from. In addition, thank you to my teammates and coaches on the MIT Sport Taekwondo Team, where I am constantly pushed to seek improvement and reminded to never give up.
Table of Contents
Acknow ledgem ents
...
5
1
Introduction
...
9
1.1 A pplicatio ns of 3-D Printing ... 10
1.2 3-D P rinted Structu res ... 11
1.3 Fused D epositio n M odeling ... 16
1.4 A n iso tro p y ... 17
1.5 Research Focus and Organization of Thesis ... 18
2 Literature Review ... 19
2.1 Material Properties of ABS Plastic...19
2.2 Fxternal Studies of Material Properties ... 20
2.3 Research Q uestio n ... 24
3
M ethodology...
27
3.1 C o nceptual O ve rview ... 27
3.2 G eo m etry G eneratio n ... 29
3.3 Sp ecim e n P rinting ... 35
3.4 Structu ral Lo ad Testing ... 37
3.5 Analysis and Data Processing ... 38
4 tesu s ... 41
4 .1 B o x P lo ts ... 4 1 4.2 Test Results for Selected Specimens...45
4.3 Relating Print Orientation to Mechanical Properties... 48
4 .4 D iscu ssio n ... 54
5 Conclusion ... 57
5.1 Summary of Contributions ... 57
5.2 Po te ntia l Im p act...58
5.3 Limitations and Future Work...58
5.4 C o nclud ing Re m arks ... 58
6 References... 59
Appendix A: Specim en Dim ensions and M asses... 63
B.2 D ata Processing C ode ... 67
B.3 Specim en O bject Code...78
Appendix C: Results...
...
... 8l
81...
Appendix D: Stress-Strain Graphs... . ... ... 83Appendix E: Surface Plots... 116
E.1 Surface Plots for Z = 0 degrees...116
E.2 Surface Plots for Z = 15 degrees ... 118
E.3 Surface Plots for Z = 30 degrees ... 120
1
Introduction
Additive manufacturing, also known as 3-D printing, has been characterized as an "industrial revolution for the digital age" (Hopkinson 2006). Traditional manufacturing techniques such as milling and cutting are subtractive, in which a product is created by removing the excess material from a starting piece of raw material. 3-D printing flips this process upside down by adding material layer-by-layer only where it is required.
While the industrial revolutions of the 191 Century marked a shift from hand labor to
automated mass production (Schoffer 2016), today's "3-D Printing Revolution" combines both craftsmanship and automation to provide user flexibility (D'Aveni 2015). The possibilities for
customization are boundless and production is on demand - one simply needs to click "print" to
begin. The ability to 3-D print a product bypasses the need to establish a manufacturing process
-and the large investment that accompanies the necessary machinery -and equipment. Production can also be local, which reduces the cost of transporting raw materials and finished goods.
In addition to these advantages, material extrusion processes offer several capabilities that assembly-based processes cannot, including fabrication of arbitrarily complex forms (Keating et
al. 2017). Thus, 3-D printing makes it possible to quickly fabricate objects with complex geometries, which would otherwise have required assembly or complicated molds to produce. The
combination of flexibility, speed, and low cost is makes 3-D printing both an exciting and disruptive technology (Kietzmann et al. 2015).
A general process of 3-D printing is described as follows. First, a solid model of the object
to be printed is modelled digitally. The model is then tessellated and exported as a stereolithography (.stl) file. The .stl file is imported into a 3-D printing software, usually produced
by the manufacturer of the 3-D printer, which slices the model into a series of equally spaced and
parallel horizontal layers corresponding to the printing resolution, or the thickness of the extruded filament. In addition, the software determines whether any support material must be printed, and calculates an optimal toolpath for material extrusion head. Once the print job is started, the object is built from the bottom up, and new material is deposited on the object in horizontal layers.
1.1 Applications of 3-D Printing
In recent years, the 3-D printing has seen increasing use in various stages of the product
manufacturing process. A 2016 PwC research survey of 120 U.S. manufacturing firms found that
71.1% were applying 3-D printing technology in some way, including 31.4% for prototyping, 6.6%
for production of end products, and 13.2% for both (PwC 2016). 3-D printing, the survey concluded, "is becoming mainstream", as global spending on 3-D printers reached almost $11 billion in 2015.
The uses of 3-D printing are similarly diverse - it has found applications in automobiles,
aerospace, consumer products, education, and healthcare. General Electric's CFM LEAP passenger jet engines uses 19 3-D printed fuel nozzles (Figure 1, Kellner 2016), and Boeing estimates that there are 50,000 3-D printed parts flying on its commercial, space, and military vehicles (Boeing
2016). Starting in 2018, 3-D printed titanium structural components will be installed on the Boeing 787 Dreamliner, in the first usage of printed structural components in aircraft (Scott 2017). In
medicine, 3-D printing can be used to produce customized implants and prosthetics that fit a specific patient and even to print tissues and organs (Ventola 2014).
Figure 1: GE 3-D printed fuel nozzle (Kellner 2016)
The relatively low cost of a desktop D printer also means that consumers can afford to
3-D print for personal use. Kietzmann, Pitt, and Berthon (2015) divide consumer users into four
different categories: 3-D tinkerers, creative consumers, designers, and inventors. These users range from do-it-yourself enthusiasts to modelmakers and hobbyists to entrepreneurs.
1.2 3-D Printed Structures
The previous section described the use of 3-D printing as a commercial and consumer technology. On a larger scale, 3-D printing has potential application as a building technology to automate construction. Globally, construction is a $8.5 trillion industry, but common construction methods such as bricklaying and concrete casting are time consuming, labor intensive, and potentially hazardous (Keating et al. 2017). Applying additive manufacturing to construction could produce geometries that is not constructible with current techniques, while improving safety, speed, and quality. Though the technology is currently still in a development stage, numerous
entities from around the world in academia, construction, and structural engineering have explored 3-D printing methods for fabricating structures.
Early research in automated fabrication of structures was done by Khoshnevis (2004), who developed the concept for Contour Crafting, a layered fabrication technology for large structures. Contour Crafting technology uses a computer controlled material extrusion nozzle and trowels attached to the nozzle to create free-form surfaces with a smooth finish. For building construction, Contour Crafting imagines mounting the nozzle on a gantry system that can slide on rails at the construction site (Figure 2).
Figure 2: Contour Crafting's concept for a gantry-based 3-D printer (Contour Crafting)
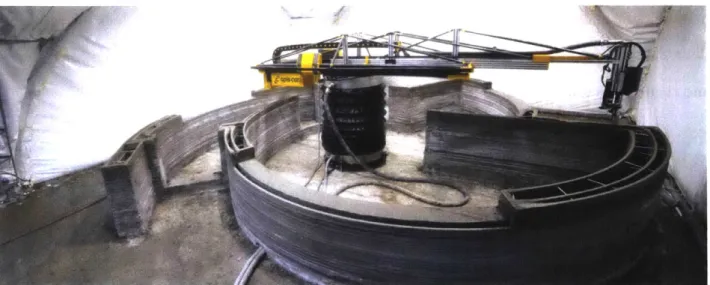
Unlike this gantry-based system, which prints from outside the building being constructed, the San Francisco-based startup Apis Cor has built a mobile 3-D printer that works from inside the building. In December 2016, the firm constructed a one-story concrete house in Russia, printing the walls, partitions, and building envelope in less than 24 hours (Figure 3). Similarly, Keating, Leland, Cal, and Oxman (2017) at MIT have developed the Digital Construction Platform
(DCP), consisting of a compound robotic arm mounted on a tracked, mobile platform that
maximizes build volume. In a preliminary test, the DCP printed a 14.6-meter diameter dome formwork structure using a fast-curing polyurethane foam.
h. ~
Figure 3: 3-D printed house by Apis Cor (Apis Cor)
Various architecture and engineering firms have used 3-D printing to fabricate experimental structures. In the Netherlands, DUS Architects are 3-D printing a traditional Amsterdam canal house in full-scale, using a scaled-up version of the Ultimaker printer called the 'KamerMaker' (Dutch for "room builder"). 3-D printing allowed for integration of architecture, structure, and constructability. Rooms are printed separately on site and can be assembled and disassembled as necessary, and geometrically complex folds in the structure help add stiffness and enhances the architectural expression of the structure.
In 2015, Skidmore, Owings & Merrill (SOM) collaborated with the U.S. Department of Energy's Oak Ridge National Laboratory to 3-D print the Additive Manufacturing Integrated Energy (AMIE) demonstration project, a conceptual design for a self-sustaining, energy efficient home (SOM 2015). 3-D printing was used to explore how the diverse functions of a conventional
wall - structure, insulation, air and moisture barriers, and exterior cladding - could be combined
into an integrated shell. The complex, organic geometry of the structure, optimized to reduce local stresses and mitigate turbulent exterior air flow, was also made possible by 3-D printing.
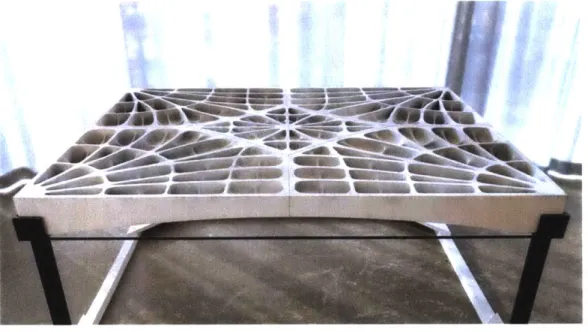
Current research also seeks to apply 3-D printing for building components. Block et al.
(2017) has developed a new floor slab system comprising of a rib-stiffened funicular vault using
prefabricated modules (Figure 4). Five separate modules were 3-D printed using a mixture of sand
material efficiency, as the rib pattern is determined by the force flow. Not only does the resulting floor slab system does not require steel reinforcement, it is 70% lighter than conventional floors and reduces the total floor height.
Figure 4: 3-D printed floor slab system (Block et a!. 2017)
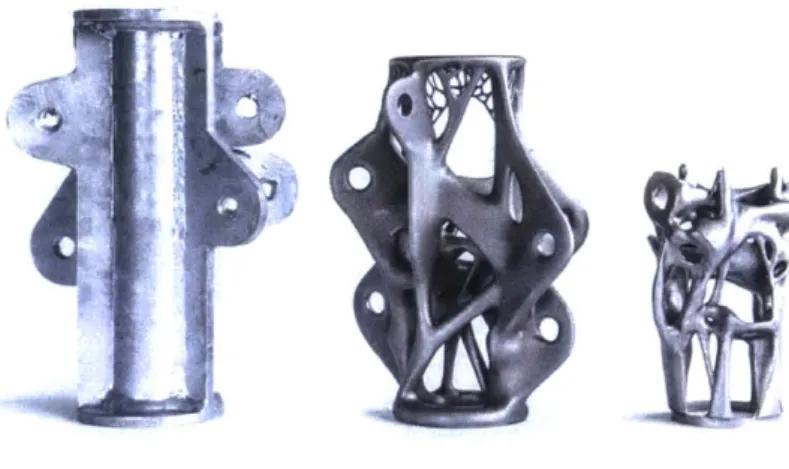
Arup explored 3-D printing for the fabrication of member connections in several tensegrity structures at the Grote Marktstraat in The Hague, The Netherlands. Conventional production of these connections would be very labor intensive as the angle and position of the connected members was different for each node (Galjjaard 2015). Topology optimization was performed to find a structurally efficient shape for each node. A 3-D printing method known as Direct Metal Laser Sintering, in which powdered metal material is selectively melted layer-by-layer, was used to produce connection nodes that were 75% lighter than traditional nodes (Figure 5). The weight reduction achieved in the connections resulted in lower forces in the struts, allowing for a smaller strut and a 40% total reduction of the structure weight.
Figure 5: 3-D printed steel connection nodes designed using topology optimization, in comparison with a traditional plate-based connection (Galjaard 2015)
One alternative to layer-based 3-D printing is freeform 3-D printing, which uses a material extruder attached to a 6-axis robotic arm. One of the groups exploring this printing method is the Chattanooga based firm of Branch Technologies, which has patented a process called Cellular Fabrication to print lattice structures made of an ABS plastic and carbon fiber mixture (Branch Technologies). These printed lattice structures are both strong and can form complex geometries, and are designed to be integrated with concrete and insulation to serve as the interior support structure of a wall assembly. In November 2016, the firm collaborated with SHoP Architects to
3-D print a lattice structure pavilion, Flotsam &
Jetsam,
for the Miami Design fair (Figure 6).WANV
Figure 6: Branch Technologies free-form printed lattice structure (left) and 'Flotsam & Jetsam' (right)
hosting the 3-D Printed Habitat Challenge, a $2.5 million competition to design and build a 3-D printed habitat for space exploration, including on Mars. The three-phase competition challenges participants to create architectural concepts for a printed habitat, develop technologies for printing structural members using indigenous or recycled materials, and 3-D print a full-scale habitat. The result of the first stage of competition was a winning entry from SEArch (Space Exploration Architecture) and Clouds Architecture Office, proposing a 3-D printed habitat constructed of ice
(Figure 7).
Figure 7: Model of 3-D printed ice shell habitat on Mars (CloudsAO)
These examples demonstrate that 3-D printing has exciting potential in structures and construction. With 3-D printing, increased complexity is free, allowing architects and engineers the opportunity to pursue intricate architectural expressions and structural efficiency.
1.3 Fused Deposition Modeling
There are a variety of 3-D printing methods, which differ in the material consumed and how material is deposited. This thesis focuses on Fused Deposition Modeling (FDM), developed
by Stratasys. FDM is an extrusion-based method that uses a thermoplastic raw material heated to
its melting point. FDM is one of the most commonly used additive manufacturing techniques, in part because of the wide range of materials that can be used, the strong mechanical properties of
printed objects, and its ability to be implemented on a small scale at a low cost (Gibson 2015). A schematic of a FDM 3-D printer is shown in Figure 8.
Exton tad
stpn materwal s"oo
Part supportstructre
Budld platform
Suild material spoo
Figure 8: Schematic of the parts of an FDM 3-D printer (Additively)
Thermoplastic filament material from the material spools is fed into the extrusion head. The extrusion head can move in the horizontal plane, using Cartesian coordinate information from the 3-D model to position itself exactly where material is needed. Inside the extruder, the filament is heated, and the liquefied plastic is deposited in a thin layer, solidifying and bonding to the previous layer. When the entire layer has finished printing, the build platform moves downward
by a distance equal to the layer thickness to begin the next layer.
1.4 Anisotropy
The process of adding materials layer-by-layer in FDM, however, results in anisotropic mechanical properties of the completed object in the vertical direction. The layers that comprise the printed object are held together by the fusion between adjacent layers. This results in a natural weak point for breakage, as adjacent layers never fully fuse together. FDM printed objects rely on the strength of the bonds between layers to resist a tensile load applied perpendicularly to the
weakest interlayer bond, and the failure mode can be characterized as brittle, with delamination between layers (Figure 9).
Parallel (00-degree) Orientation Perpendicular (90-degree) Orientation
Uneven breakage along filament axes Even breakage in fusion between layers
Figure 9: Illustration of failure behavior based on print orientation (Mueller, Irani, Jenett 2014)
Thus, one important design consideration for FDM is accounting for the anisotropy of an object subjected to loading. For best performance, Gibson, Rosen, and Stucker (2015) recommend aligning the major stress axes of the object with the horizontal plane of the build platform. The layering of the object is then aligned parallel to the direction of load, and the strength of the object becomes dependent on the axial strength of individual lines of filament material.
1.5 Research Focus and Organization of Thesis
The geometric possibilities enabled by 3-D printing, as well as benefits gained in materials and cost savings, provides exciting opportunities for both architects and engineers. 3-D printing could also help solve constructability issues on projects with particularly complex geometries.
While the prospect of 3-D printing buildings is exciting, its current applicability is limited
by anisotropy, due to the layer-based approach of most available printing systems. Anisotropy
presents a great challenge in building design because current design methods assume isotropic material properties, for conventional building materials such as steel and concrete. Directional variation in material strength is detrimental structurally, as potential loads could come from any direction. Thus, the scope of this thesis is to quantitatively analyze the relationship between print orientation and the mechanical properties of FDM specimens. Specifically, this project only considers tensile mechanical properties and ABSplus material.
2
Literature Review
This chapter provides an overview of previous research in the material properties of 3-D printing plastics and the anisotropic effects of layering in FDM 3-D printing.
2.1 Material Properties of ABS Plastic
A wide variety of thermoplastic materials can be used in FDM 3-D printing, among them
acrylonitrile butadiene styrene, also known as ABS plastic. The polymer composition of this plastic gives it both strength and toughness (Zieman 2012). Table 1 describes various mechanical properties of general purpose ABS plastic.
Mechanical Properties Value
Density 1,060 - 1,080 kg/m3
Shear Modulus 700 - 1,050 MPa
Young's Modulus 2,275 - 2,900 MPa
Compressive Strength 60 -86 MPa
Tensile Strength 41 - 60 MPa
While the mechanical properties of solid ABS plastic are well documented, the properties of the material after it has been 3-D printed are less clear. A Stratasys Dimension Elite FDM 3-D printer, which uses Stratasys ABSplus material, was used for test specimen fabrication in this project. Table 2 gives the values of relevant tensile mechanical properties of 3-D printed ABSplus plastic, obtained from a Stratasys material data specification sheet.
Test
Mechanical Properties Method Imperial SI
Tensile Strength, Ultimate (Type 1, 0.125", 0.2"/min) ASTM D638 4,700 psi 33 MPa
Tensile Strength, Yield (Type 1, 0.125", 0.2"/min) ASTM D638 4,550 psi 31 MPa
Tensile Modulus (Type 1, 0.125", 0.2"/min) ASTM D638 320,000 psi 2,200 MPa
Tensile Elongation at Break (Type 1, 0.125", 0.2"/min) ASTM D638 6% 6%
Tensile Elongation at Yield (Type 1, 0.125", 0.2"/min) ASTM D638 2% 2%
Table 2: Tensile mechanical properties of ABSplus plastic after being 3-D printed (Stratasys 2014)
According to the Stratasys specification sheet, the values presented above were obtained through testing of a specimen printed "on-edge". However, a disclaimer notes, "actual values will vary with build conditions." No information was provided about the print parameters used. In comparison with general purpose ABS plastic, the Stratasys test results show that ABS plastic used in FDM have lower tensile strengths and elastic moduli.
2.2 External Studies of Material Properties
There is a wealth of previous research on the material properties of FDM 3-D printed specimens. Many variables in the 3-D printing process, from material choice to build parameters, can influence the final strength of the printed specimen.
Bertoldi et al. (1998) performed tensile tests on FDM printed ABS plastic specimens printed at various orientations in the XY, XZ, and YZ planes, using a "pseudo-isotropic" fiber orientation stacking sequence (Figure 10). Test results showed that large variations in tensile strength, elastic modulus, and failure mode occur, depending on specimen orientation. Vertically-printed specimens (in the XZ plane, oriented in the Z direction) exhibited the least tensile strength, 48%
the tensile strength of specimens printed on-edge (in the YZ plane, oriented in the Y direction), which exhibited the greatest strength.
Figure 10: Test specimen orientations (Bertoldi et a. 1998)
Rodriguez, Thomas, and Renaud (2001) investigated the mechanical properties of FDM printed ABS plastic specimens with three different mesostructures in comparison with ABS
monofilament feedstock. Tensile tests of specimens with longitudinal, off-axis, and transverse fiber orientations (relative to the direction of load) were conducted for each mesostructure (Figure 11). Results showed that among the FDM specimens, the highest stiffness and tensile strength values were found for loading in the direction of the fiber orientation. The yield strength of specimens with a transverse fiber orientation was 56% the yield strength of specimens with a longitudinal fiber orientation. 0 190 2.i7 0 0 I 12. 7 J L2.54 Dimensions in [mm] 0 127 054d .25
Figure 11: Tensile specimens with longitudinal, off-axis, and transverse fiber extrusion directions in Rodriguez et a. 2001
Ahn and Montero et al. (2002) analyzed how the mechanical behavior of FDM printed ABS plastic specimens was affected by changes in design and process parameters, such as raster orientation, air gap, bead width, color, and model temperature. Results showed that only air gap and raster orientation had a significant impact on the tensile strength of the 3-D print specimens. Specimens with a transverse raster orientation were found to have 57% the tensile strength of specimens with a longitudinal raster orientation.
More recently, Bagsik, Schdppner, and Klemp (2010) compared the tensile strengths of
ULTEM 9085 plastic specimens printed in the X (on edge), Y (flat), and Z (vertical) orientations
(Figure 12). The vertically oriented specimens, with the layering perpendicular to the direction of load, exhibited a tensile strength that was 64% the tensile strength of specimens printed on edge, where the layers were parallel to the direction of load.
X-Directio
Y-Direction Z-Direction
Figure 12: Build orientation of test specimens in Bagsik et al. (2010)
Zieman et al. (2012) also examined FDM printed ABS plastic specimens with varying raster orientations. Tensile test results showed that the mean ultimate and yield strengths were greatest for specimens with a longitudinal raster orientation, while specimens with a transverse raster orientation had the lowest strength. The mean ultimate strength of transverse specimens was only
56% of the strength of longitudinal specimens.
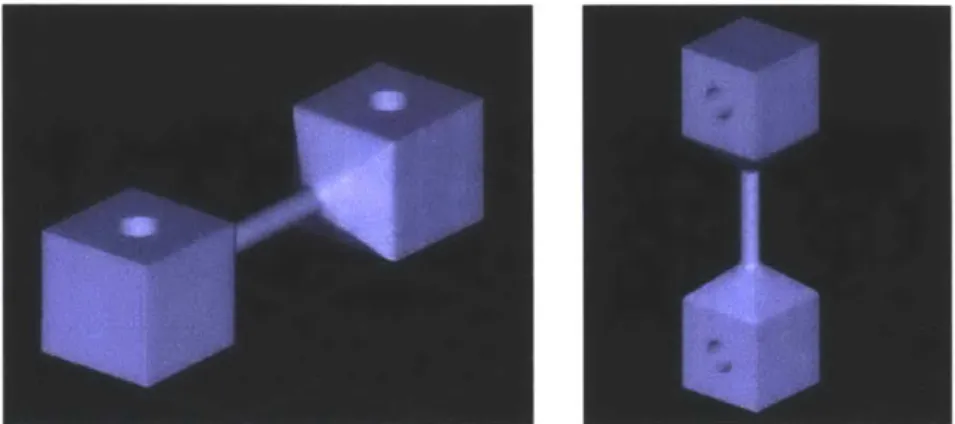
Mueller (2014) examined the effect of varying diameters and specimen orientations on the strength of FDM printed ABS plastic specimens (Figure 13). Print orientation was found to have a
significant impact on strength - transversely oriented (90-degree) specimens had an average ultimate strength that was 54% that of longitudinally oriented (0-degree) specimens.
Figure 13: Model of test specimens in the 0 degree (left) and 90 degree (right) orientations (Mueller 2014)
Most recently, Cantrell et al. (2016) studied the effect of print orientation and raster orientation on the mechanical properties of FDM printed ABS plastic and polycarbonate specimens, using an experimental 2-D digital image correlation method to collect strain data. Vertical, on-edge, and flat print orientations and four different raster orientations were considered in their experiment (Figure 14). Results for ABS plastic showed that specimens printed vertically performed the worst, with strengths of about 91% the strength of specimens printed in the flat configuration, which were the best performing. Similarly, for polycarbonate, specimens printed vertically had the lowest strength, 73% of the highest strength for specimens printed on-edge. The results presented in Cantrell et al. (2016) differ significantly from the other papers evaluated; the reasons for these discrepancies are not clear.
Z Printer bed orientation
Printed up-right Printing raster direction
[0/90] uprght u45
PPenting b
d ras ter 5a
Printed on-edge Printed flat
Printing raster direction [0/90 on-edge [0/90 flat [+45/-45R uprgght -a 0B [+45/ 4 1 on-edge [+1 5 5) flat Ahn t at (202) AS 57 [+30/-60i a(0L 9-[+1e45/-45] flat 45
Printer bed orientation
Figure 14: Printer bed and raster orientations for Cantrell et al. (2016)
Table 3 summarizes the experimental results found by various other research projects on
anisotropy in FDM 3-D printing.
Research Paper Material Tested Tensile Strength of Transverse Orientation, as a percentage of
Tensile Strength of Longitudinal Orientation
Bertoldi et al. (1998) ABS 48%
Rodriguez et al. (2001) ABS 56%
Ahn et al. (2002) ABS 57%
Bagsik et al. (2010) ULTEM 9085 64%
Ziemnan et al. (2012) ABS 56%
Mueller (2014) ABS 54%
Cantrell et al. (2016) ABS 91%
Cantrell et al. (2016) Polycarbonate 73%
Table 3: Summary of experimental results obtained by various researchers studying anisotropy in FDM 3-D printing
2.3 Research Question
The broad extent of existing literature on anisotropy in FDM 3-D printing shows that it is
an extensively studied subject. Despite this, the effect of print orientation on anisotropy is not yet fully understood in high detail. Many projects have only considered different orthogonal configurations of specimen orientation - vertical, on-edge, and flat. At the same time, researchers have also investigated the influence of a variety of other parameters, such as raster orientation and air gap, on the strength of the printed specimen.
To better understand the anisotropic material properties of FDM printed objects, more data about the behavior of specimens printed at orientations in-between the orthogonal configurations is needed. How do the mechanical properties of a printed object change, as the object rotates from one orthogonal configuration to the other? As the object rotates through 3-dimensional space, a myriad of configurations is possible. Thus, a much greater number of specimen orientations, due to rotations about any combination of the X, Y, and Z axes, must be considered.
3
Methodology
This thesis seeks to characterize anisotropy in FDM 3-D printing using ABS plastic by studying finer increments of the angular rotations that determine specimen orientation. 15-degree increments of rotation about the X, Y, and Z axes were considered. Other print parameters were kept constant throughout the experiment. Data obtained from tensile load testing of test specimens was analyzed to obtain the tensile mechanical properties of each specimen. This chapter provides
a detailed description of the experimental methodology - from geometry generation of test
specimens, to fabrication, load testing, and data analysis.
3.1 Conceptual Overview
The experimental procedure was divided into four distinct steps (Figure 15) - test specimen
geometry generation, printing, load testing, and data analysis. A portion of the work completed for this thesis in this chapter, including geometry generation, load testing, and data processing, has been done in collaboration with Chrystal Chern.
Geometry Generation Specimen Printing Structural Loa dTestin g Data Analysis 000
.00 000,
WO-O"!Oe
Oto
0000
000
4P00000
9 -. ~3.2 Geometry Generation
Figure 16 and Table 4 describe the typical dimensions of the 3-D printed tensile test specimen used in this research.
5.57 2.25
R1.00
Thickness: 0.25
Figure 16: Tensile test specimen dimensions [in.]
Dimension Value
_____ ____ ____ ___ [in.J
Width of narrow section, W 0.50
Length of narrow section, L 2.25
Overall width, WO 1.00
Overall length, LO 5.57
Radius of fillet, R 1.00
Thickness, T 0.25
Table 4: Description of tensile test specimen dimensions
The geometry of the 3-D printed test specimens was determined per the dimensions specified in the ASTM D638 standard for Type I specimens. However, it should be noted that the overall length of the test specimen is nonstandard. This dimension was shortened to reduce build times, and the exact value of 5.57 inches was selected to minimize local stress effects at the rounded corners when the specimens are rotated and printed.
The test specimen geometry was modeled in Rhinoceros 5. The base model of the test specimen was oriented in Rhinoceros such that the length of the specimen was parallel to the Y-axis in the global coordinate system (Figure 17). The axes of this coordinate system correspond to the axes in the 3-D printing software and the 3-D printer's build platform.
Figure 77: Model of the base test specimen in Rhinoceros 5, and its orientation in the global coordinate system
The orientation of test specimens was controlled by rotating the specimen relative to the axes of the printer's build platform. To generate additional test specimens, this base model was copied and rotated about the X, Y, and Z axes. Figure 18 shows specimens with 30, 60, and 90 degree rotations about the X-axis. The 90-degree rotation about the X-axis is equivalent to a vertical orientation of the specimen.
Figure 18: Models of test specimens rotated 30 (left), 60 (center), and 90 degrees (right) about the X-axis
Figure 19 shows specimens with 30, 60, and 90 degree rotations about the Y-axis. The 90-degree rotation about the Y-axis is equivalent to an on-edge orientation of the specimen.
Figure 19: Models of test specimens rotated 30 (left), 60 (center), and 90 degrees (right) about the Y-axis
Figure 20 shows specimens with 30, 60, and 90 degree rotations about the Z-axis. Regardless of the rotation about the Z-axis, a 0-degree rotation about both the X and Y axes is equivalent to a flat orientation of the specimen.
Figure 20: Models of test specimens rotated 30 (left), 60 (center), and 90 degrees (right) about the Z-axis
Figure 21 shows specimens with 45-degree rotations about both the X and Y axes, X and Z axes, and Y and Z axes, respectively.
Figure 21: Models of test specimens rotated 45 degrees about both the X and Y (left), X and Z (center), and Y and Z axes
Figure 22 shows a specimen with a 45-degree rotation about the X, Y, and Z axes.
Figure 22: Model of a test specimen rotated 45 degrees about the X, Y, and Z axes
A MATLAB script (Appendix B.1) was written to create a Latin hypercube sample for
combinations of rotation angles about the X, Y, and Z axes. The range of possible angles was 0 to
90 degrees in the X and Y axes, and 0 to 45 degrees in the Z axis. Z axis rotation was limited to 45
degrees because the rotation is in-plane with the horizontal printing platform; as Z axis rotation
increases the orientation of horizontal cross-section of the specimen changes with respect to the X
and Y axes. This orientation is symmetric about 45 degrees; hence it was unnecessary to include Z
rotations greater than 45 degrees.
The angles generated were rounded to nearest 15 degrees and checked for uniqueness. A total of 92 specimen types, each with a unique combinations of rotation angles about the X, Y, and
Z axes, were found. Specimen types were numbered from 0 to 91, and their rotation data was
Z'Ois
exported as a .csv file. This .csv file was imported into Grasshopper, a parametric modeling plug-in for Rhplug-inoceros 5. Usplug-ing the base model as a reference object, the Grasshopper script generated the remaining specimen types by rotating the base model about its centroid at the X, Y, and Z angles corresponding to each specimen type.
For this thesis, the first 64 specimen types of the 92 total were tested. Thus, no X-axis rotations greater than 60 degrees were tested. Table 5 and Figure 23 shows the rotation angles of specimens that have been tested. Table 6 shows the rotation angles of specimens that have yet to be tested as of writing.
Rotation of Tested Specimens 100 90 80 70 60 50 40 30 20 10 0 1 -X
I
I II
II
2 3 4 5 6 7 8 9 10 11 12 13 14 15 16 17 18 19 20 21 22 23 24 25 26 27 28 29 30 31 32 33 34 35 36 37 38 39 40 41 42 43 44 45 46 47 48 49 50 51 52 53 54 55 56 57 58 59 60 6162 3 Specimen TypeFigure 23: X, Y, and Z rotation combinations for tested specimens
I . . . .1 ... ---I I 11 I 11 O s
Specimen X-axis Y-axis 2-axis Specimen X-axis Y-axis Z-axis
Type Rotation Rotation Rotation Type Rotation Rotation Rotation
0 0 0 0 32 30 45 30 1 0 15 30 33 30 60 15 2 0 30 0 34 30 60 30 3 0 45 45 35 30 75 15 4 0 60 0 36 30 90 30 5 0 60 15 37 30 90 45 6 0 60 45 38 45 0 15 7 0 75 30 39 45 15 0 8 0 90 30 40 45 15 30 9 15 0 0 41 45 15 45 10 15 0 15 42 45 30 15 11 15 0 30 43 45 30 45 12 15 15 15 44 45 45 0 13 15 30 15 45 45 45 15 14 15 30 30 46 45 45 30 15 15 30 45 47 45 60 30 16 15 45 0 48 45 60 45 17 15 45 15 49 45 75 0 18 15 45 30 50 45 75 15 19 15 75 0 51 45 75 30 20 15 75 15 52 45 90 45 21 15 90 15 53 60 0 45 22 15 90 30 54 60 15 0 23 30 0 15 55 60 15 15 24 30 0 30 56 60 15 30 25 30 15 0 57 60 15 45 26 30 15 15 58 60 30 15 27 30 15 30 59 60 30 30 28 30 15 45 60 60 45 0 29 30 30 15 61 60 45 15 30 30 30 30 62 60 45 30 31 30 45 15 63 60 45 45
Specimen X-axis Y-axis Z-axis Specimen X-axis Y-axis Z-axis
Type Rotation Rotation Rotation Type Rotation Rotation Rotation
64 60 60 0 78 75 60 15 65 60 60 15 79 75 60 45 66 60 60 30 80 75 75 15 67 60 60 45 81 75 75 30 68 60 75 0 82 75 75 45 69 60 75 15 83 90 30 15 70 60 75 45 84 90 30 30 71 75 15 15 85 90 45 30 72 75 15 30 86 90 60 0 73 75 30 0 87 90 60 15 74 75 30 30 88 90 75 0 75 75 30 45 89 90 75 15 76 75 45 15 90 90 90 15 77 75 45 30 91 90 90 45
Table 6: Table of specimen types to be tested and their X, Y, and Z axis rotations
3.3 Specimen Printing
For each of the 64 specimen types, 3 specimens were printed, for a total of 192 test specimens. Test specimens were printed on a Stratasys Dimension Elite 3-D printer. This printer builds objects up to a maximum size of 8 in. width by 8 in. length by 12 in. height, using ABSplus material. The printer also features a second extruder head for depositing the support material, which is dissolvable in a lye solution.
The test specimens modeled in Rhinoceros 5 were meshed and saved in the stereolithography (.stl) file format. This file was uploaded into Dimension CatalystEX software for slicing and generating the toolpath for printing.
Three print parameters can be user defined in the CatalystEX software: layer resolution, model interior style, and support fill style. Layer resolution refers to the height of each layer of material extruded to make the part, with higher resolution prints resulting in a smoother finish but requiring a longer build time. Model interior is the type of fill used for the interior, solid areas of
the part. Support fill defines the strength and amount of support material used to brace overhanging parts of the printed part. The following print parameters were chosen for the test
specimens: 0.01-inch resolution, sparse - high density model interior, and surround support fill.
To save time, test specimens were grouped to maximize the number of test specimens that could fit within the boundaries of the printer bed. Figure 24 shows the model of a group of specimens in CatalystEX, after slicing and support material calculations have been completed. CatalystEX automatically determines the pattern of the interior fill, or raster. Figure 25 shows the directionally alternating raster pattern for two consecutive layer slices of a model. At this point, the model is ready to be printed.
Figure 25: Model in CatalystEX, showing alternating interior fill for two consecutive layer slices
3.4 Structural Load Testing
An Instron Model 1331 Tensile, Compression, and Fatigue Testing System, with an Instron
8850 controller and a 10 kN load cell, was used for tensile load testing. An extensometer with a
gage length of 12.5 mm (0.5 inch) was attached to the center of the test specimen. A photograph of the structural testing setup is shown in the figure below.
Figure 26: Tensile test experimental setup.
Before testing, the thickness, width of the narrow section, and mass of the specimen were measured and recorded (Appendix A). Tensile load was applied at a constant rate of 3 mm per minute until specimen failure. Applied load and extension data was recorded at a rate of 1 Hertz.
3.5 Analysis and Data Processing
A MATLAB script and function was written to automate the processing and analysis of the
data produced by all tensile tests. Data processing and analysis was performed by the script in Appendix B.2.
This script opened and extracted raw data from a .dat file and converted the load and strain data, expressed in volts, to the actual load and strain values. Several steps were then taken to process the raw data. Noise at the beginning of the data set, when the specimen is unloaded, and any data after peak load were removed. The data was then shifted such that the first data point was located at the origin, where both load and strain equal zero. The script also calls to .mat (MATLAB
The processed load and strain data was input into a "specimen" function, presented in Appendix B.3, that created a MATLAB object for each specimen tested. The function also takes inputs of specimen area and the rotation angle in the X, Y, and Z axes. The specimen function converts the load data into values of stress. Next, through a comparison of the incremental changes in slope between data points, the proportionality limit stress point is found and the modulus of elasticity is calculated. Yield stress is calculated using the 0.2% offset method. Knowing the value
of the x-intercept and the slope of the line, the coefficients of a linear equation for a line parallel to the elastic section of the strain plot was found. The distance between this line and the stress-strain data points was calculated using the equation for the distance from a point to a line:
SxO+ my) - mk + xo I my,) mk 2
d - xi + m + k - y
m2 + 1 m2 +
Figure 27: Formula for the distance from a point to a line (Wikipedia)
The stress-strain data point which was closest to this line was considered to be the yield point. The specimen function then plotted the stress and strain data for each tested specimen.
The specimen object stores internally the calculated values of proportionality limit stress, offset yield stress, and elastic modulus. Values in the object can be extracted from within the data processing and analysis script, and were used to generate plots and figures for data visualization.
4
Results
This chapter presents and discusses the data obtained from the structural load testing. A general overview of yield strength, ultimate strength, elastic modulus, and strain results for all specimens is first presented. Results for selected specimens, and analysis of the relationship between print orientation and mechanical properties are further discussed. A detailed tabulation of results for each specimen type can be found in Appendix C.
4.1 Box Plots
Box plots were created to show the range of results for each specimen type, and a horizontal dashed line was added to indicate the value reported by the Stratasys material specification sheet for ABSplus plastic. Figures 28 and 29 shows the tensile yield strength and ultimate strength results
for all specimens, respectively. Results for tensile yield ranged from a minimum of 7.5 MPa to a
maximum of 19.9 MPa. Results for ultimate strength ranged from a minimum of 7.6 MPa to a maximum of 20.7 MPa.
36 34 32 30 28 26 24 22 5)20 U) 18 32 16 C14 12 12 10 8 6 4 2 0 0 1 2 3 4 5 6 7 8 9 10 11 12 13 14 15 16 17 18 19 20 2122 23 24 25 26 27 28 29 30 31 32 33 34 35 36 37 38 39 40 4142 43 44 45 46 47 48 49 50 51 52 53 54 55 56 57 58 59 60 616263 Specimen Type
Figure 29: Ultimate tensile strength for all specimens Tensile Yield Strengths
Yeld Strength repoied b tr-tasys
-- -3637 1 IS 6s 1521 3 3 3 495851 213 1415 3383 466 1 2C2
Iae111
21 N 48 1 0 0 31 1 -9 11 0 30 0 eg 62 27 28 46 so 61 -8 39 ID-40 53 57 0 1 2 3 4 5 6 7 8 9101112131415161718192021222324252627282930313233343536373839404142434445464748495051525354555657585960616263 Specimen TypeFigure 28: Tensile yield strength for all specimens
0. E 6 Ultimate Tensile Strength I I I I I I I I I I I I I I I I I I I I I I I I I I I I I I I I I I I I I I
Ultimate Strength reported by Stratasys-- --- - --- ---
--32 -30 28 -26 -24 -22 -20 - 8 18 23 Q3 16 - 12 M 9fl 232 47- 10-8 0 41 53 6 - -44 -5 2 0 2t 2
--~~2 44 I l0~lI I I II II IIIIIII II III
10-2 24 59 9
Figure 30 shows the elastic moduli results for all specimens. The values of elastic modulus ranged from a minimum of 920 MPa to a maximum of 1518 MPa.
2400-2200 -- - --2000 V 1800 1600 1400 1200 00 CA 0 11000--800D 600 400 200-3 0 2 12 10 13 14 Mfdhuof EWsUc~ty 1718 19 21 is C 0 t 0 ; 0 n 32 9 24 250 3D M a V 34 74 n 42 46 51 5 ~54 53 W 6 61 a2 U. LI 14 0 '.. ' i I L 1 i ~ i L _____1__- I I II )I , i, , 0 1 2 3 4 5 6 7 8 9 10 11 12 1314 15 16 17 18 19 20 21 22 23 24 25 26 27 28 29 30 31 32 33 34 35 36 37 38 39 40 41 42 43 44 45 46 47 48 49 50 51 52 53 54 55 5657 58 59 60 61 62 63 Speanen Type
Figure 30: Moduli of elasticity for all specimens
Figures 31 and 32 shows the yield and ultimate strain for all specimens, respectively.
Percent Strain at Yield
S I I I I I I I I I I I I I I I I I I I I I I I I I I I I I I I I I I I I I I T
-5.5 P
4.5
h--reld Strain reported by Stralasys
3 7 2 13 1 15 18 1 2D21 2 .O32 -I 334 35 36 3 23 51 52 47 48 49 50 ;e 042 434 46 4 38 0 41 58 59 60 61 62 62 S54 55 56 53 I I I I I I 1 I I I I 1 1 1 I I I I 1 I I I I I I I I 1 I I I I1 I 1 I I I I I I I 0 1 2 3 4 5 6 7 8 9 10 11 12 13 14 15 16 17 18 19 20 21 22 23 24 25 26 27 28 29 30 3132 33 34 35 36 37 38 39 40 4142 43 44 45 46 47 48 49 50 51 52 53 54 55 56 57 58 59 60 61 62 63 Specimen Type
Figure 31: Percent strain at yield for all specimens
Percent Strain at Break
I I I I I I I I I I I I I I I I I I I I I I I I I I i I I i i I i I I I I I I I I I I I I I I I I I
-UmLirnate Strain rep-rted Str-tasys
--T 4' z 3.5 Cd) 3-2.5 --12 3 6 2 14 3 10 16 1117 20 21 1f 35 37 26 30
8~
~47 48 4950 3 4 45 46 40 41 55 t6 539 53Q LI 1 1 1 1 1 1 1 1 1 1 1 1 1 1 1 1I II 1 I 111111111111111 1 IU 0 1 2 3 4 5 6 7 8 9 10 11 12 1314 15 16 17 18 19 20 21 222324 25 26 27 28 29 30 31 32 3334 35 36 37 3839 40 4142 43 44 45 46 47 48 49 50 51 52 53 54 5556 5758 59 60 6162 63 Specimen TypeFigure 32: Percent strain at break for all specimens
6.5 6 5 4 iv3.5 -3 2.5 t-2 1.5 0.5 0 6.5 6 5.5 5 4.5 2 1.5 0.5 1I 4
Table 7 summarizes the maximum and minimum values of the yield strength, ultimate strength, elastic modulus, strain at yield, and strain at break found in this experiment, in comparison with the values stated by Stratasys in their ABSplus material specification sheet (Table 2). The yield strengths, ultimate strengths, and elastic moduli were consistently lower than the values reported by Stratasys. While the differences in magnitudes may be attributable to a difference in print settings, the wide range of values for different specimen types suggest that the strength of FDM printed ABS plastic cannot be reduced to a single column of values.
Yield strains for all specimens were within relatively close range of each other, at between
0.9% to 1.5%. These values are slightly below the tensile elongation at yield reported in the Stratasys
specification sheet. Strains at break were more varied across all specimens, but were generally under 3%, less than half of the 6% strain reported by Stratasys.
Test Results
Percentage of
Mechanical Properties ralay Minimum Maximum Stratasys-Reported
ValueValue
Ultimate Tensile Strength 33 MPa 7.6 MPa 20.7 MPa 23-63%
Yield Strength 31 MPa 7.5 MPa 19.9 MPa 24-64%
Elastic Modulus 2,200 MPa 920 MPa 1518 MPa 42-69%
Percent Strain at Break 6% 0.86% 5.73% 14-96%
Percent Strain at Yield 2% 0.86% 1.68% 43-84%
Table 7: Comparison of maximum and minimum test results with the values reported by the Stratasys ABSplus plastic material specification sheet
4.2 Test Results for Selected Specimens
Test specimens exhibited both ductile and brittle material properties. This section presents stress-strain data from selected test specimens to show examples of both types of behavior. Specimen 0 was the "base model" specimen, printed flat on the build platform (Figure 17). Figure
22 -20 18 16 -14 121- S10-8 6 4 2 SpecImen1, X -0, Y =IS, Z=30 0 0.5 1 1.5 2 2.5 3 3.5 4 Percent Strain
Figure 33: Specimen 0 stress-strain plot
Specimen 8 achieved the greatest tensile strength, and Figure 34. Ductile failure behavior is also observed.
SpedmenOS. X .0. Y =.0, Z =30 [_M208-2 I---08-3 2 2 0 18 F 6 4 a ~-4j. 2 0 0.5 1 1s 2 2.5 3 3.5 4 Percent Strain
Figure 34: Specimen 8 stress-strain plot
-01-1
--01-2
--013
-/
4.5 5 5.5 6
its stress-strain plot is shown in
Figure 35 shows a model of Specimen 8, with horizontal lines drawn in the model to show the print layers, oriented parallel to the direction of the load. This orientation is optimal for axial loads, as load is fully resisted by the layers of filament. The result also corroborates previous research by Bertoldi (1998) and Bagsik (2011), who have found that specimens printed in the
"on-edge" orientation of specimens to be the strongest. ,Z-axis
2r Y a( '
))(iis
Figure 35: Specimen 8 model, with horizontal lines showing print layers
Figure 36 shows the stress-strain plot for Specimen 53, which exhibited the least tensile strength. A brittle failure can be observed.
Specln53, X =U. Y =0. Z 246 20~ 18I 161 14 a.12F S10-6K 4h
2/I
F 31
I
*1
0 0.5 1 1.5 2 2.5 3 3.5 4 4 Percent Strain .5 5 5.5 6The model of Specimen 53 is shown in Figure 37, with horizontal lines added to show the print layers. Note that the layer lines on the front face of the specimens are perpendicular to the direction of loading. As expected, this orientation is not optimal, as the strength of the piece is wholly dependent on the bonding between layers.
Z-axis
Y-axis
X-axis
Figure 37: Specimen 53 model, with horizontal lines showing print layers
4.3 Relating Print Orientation to Mechanical Properties
To better understand the impact of rotating the test specimen on its strength, the collected data was sorted by the X, Y, and Z axis rotations of the specimens. Scatter plots relating the all specimens' rotation angle about one axis to their mechanical properties were created. Figures 38 to 41 on the following pages relates the rotation angle about the X, Y, and Z axes of all specimens to their moduli of elasticity and tensile yield strength.
X Rotation vs. Modulus of Elasticiy
I
I
I
45 X Rotation (degrees)X Rotation vs. Tensile Yield Strength
I
45
X Rotation (degrees)
Figure 38: Elastic moduli and tensile yield strength results for all specimens, grouped by X-axis rotation
0
1600-1400 12001 1000 6001 0 400 200 0 15 30 24 22 60 75 201 18 90I
I
a
S12L 10 8- 6- 4j-2 0 UI
30I
0 0 0 0 15 60 75 90Y Rotation vs. Modulus of Elasticity
45
Y Rotation (degrees)
Y Rotation vs. Tensile YThid Strength
8 0 0
j
45 Y Rotation (degrees)Figure 39: Elastic moduli and tensile yield strength results for all specimens, grouped by Y-axis rotation
I
1200~ 100 1400 200 0L 0 9I
0 S 00
0 0 0 60 15 30 75 90 24-22 20 ~ 1816-14
S12-10j 8I
6I
8 0I
I
60 21 0 L 0 15 30 75 90Z Rotation vs. Modulus of Easticity
0
i
45
Z Rotation (degrees)
Z Rotation vs. Tensile Yleld Strength
45 Z Rotation (degrees)
Figure 40: Elastic moduli and tensile yield strength results for all specimens, grouped by Z-axis rotation
I
I
1600-1400 1200 8W01 600 400 200I
I
0 0 30 0 15 24 -22 60 75 90I,
*1 Ii1
4
K
12 10 6- 4-2 0 15 30 60 75 90 n E JSeveral trends can be observed in the scatter data. In the X-axis rotation data, a slight decrease in elastic modulus and yield strength can be observed as the rotation angle increases. In the Y-axis rotation data, a strong correlation can be found between increasing Y-axis rotation and greater elastic moduli and yield strength.
Changes in Z-axis rotation did not seem to exhibit any correlations with changes in stiffness and strength. Results were sorted by their Z-axis rotation, and for each increment of rotation about the Z-axis, 3-dimensional stem plots relating X and Y axis rotation to stiffness and strength were created. Using the MATLAB "griddata" function, surface plots were interpolated from the available data points to show how strength and stiffness change with rotations about the X and Y axes. Selected results for a Z-axis rotation of 30 degrees, for which many data points were available, are presented in Figures 41 to 43. Additional figures are presented in Appendix E.
X and Y Rotation vs. Elastic Modufl. Z z30
1500 1450 22 7 36 1800 1400 12004 [000 6001 400 200 0 75 60 30 Y Rotation (dagrees) 51 62 59 58 15 0 o 15 so 30 X Rotation (degreos)
Figure 41: X and Y Rotation vs. Elastic Moduli for Z-axis rotation of 30 degrees
1400 1350 1300 1250 1150 1100 1050 90 75 45
X and Y Roawion vs. Yild trs, Z .30 51 ~1'~A1i~5 p ~ 18 60 45 30 15 15 Y Rotation (degrees) 60 R 45 15 0 0 X Rotation (degrees)
Figure 42: X and Y Rotation vs. Yield Stress for Z-axis rotation of 30 degrees
X and Y Rotation vs. Ultimat Stress, Z =30
4~6 51 1~ 2. 7 16 1 60 45 Y Rotation (degrees) 45 30 0 0 X Rotation (degrees) 19 24 22 20 1 l 18 16 8-4 0 90 75 90 75 20 24 22 20 18 16, 14 12 10-8 4, 2 0 75 Is 16 14 12 10 90 60 Is 17 16 15 14 13 12 11 10 9
Three similar and well-defined gradients can be observed in the relationship between X and Y axis rotations and the mechanical properties of the specimen. The highest values of elastic modulus, yield strength, and ultimate strength occurred at the top left corner of the plot, at an X rotation of 0 degrees and a Y rotation of 90 degrees. The lowest values occurred at the bottom right corner of the plot, where X and Y axis rotation approached 60 degrees and 0 degrees, respectively.
4.4 Discussion
The results presented in the previous sections show that specimen orientation has a significant impact on the mechanical properties of the specimen. A clear and wide ranging variation in the yield and ultimate tensile strength of all test specimens can be seen. Minimum values of yield and ultimate strength were 38% and 37% of the maximum values of yield and ultimate strength, respectively. These results are similar to those from previous studies, which found that tensile strength could be reduced by nearly 50%, depending on specimen and raster orientation. Elastic modulus also varied, though to a relatively lesser degree, from specimen to specimen. The minimum value of the elastic modulus was 61% of the maximum value.
In addition, five distinct regions, characterized by relatively low values of yield strength, ultimate strength, or elastic modulus, sloping up to relatively high values, can be observed in the
boxplots. These regions occur from, 1) Specimen 0 to Specimen 8, 2) Specimen 9 to Specimen 22,
3) Specimen 23 to Specimen 37, 4) Specimen 38 to Specimen 52, and 5) Specimen 53 to Specimen 63. By comparing the specimen types associated with these regions and their rotation angles
(Figure 23), it can be seen that each region corresponds to one value of rotation about the X axes. Increased X-axis rotation, approaching 90 degrees, is generally related to a decrease in yield and ultimate strength. Furthermore, strength and moduli values trend upwards within each region, which correlates with incremental increases in Y-axis rotation for each X-axis rotation angle. As described in Chapter 3.2, increases in X-axis rotation up to 90 degrees results in the specimen shifting towards a vertical configuration. This orientation is not optimal for resisting tensile loads, as the specimen layers are built up in the direction of its greatest dimension. On the contrary,