HAL Id: hal-02464916
https://hal.archives-ouvertes.fr/hal-02464916
Submitted on 4 Feb 2020HAL is a multi-disciplinary open access
archive for the deposit and dissemination of sci-entific research documents, whether they are pub-lished or not. The documents may come from teaching and research institutions in France or abroad, or from public or private research centers.
L’archive ouverte pluridisciplinaire HAL, est destinée au dépôt et à la diffusion de documents scientifiques de niveau recherche, publiés ou non, émanant des établissements d’enseignement et de recherche français ou étrangers, des laboratoires publics ou privés.
Valorizing low cost and renewable lignin as hard carbon
for Na-ion batteries: Impact of lignin grade
Camelia Matei Ghimbeu, Biao Zhang, Alicia Martínez de Yuso, Bénédicte
Réty, Jean-marie Tarascon
To cite this version:
Camelia Matei Ghimbeu, Biao Zhang, Alicia Martínez de Yuso, Bénédicte Réty, Jean-marie Tarascon. Valorizing low cost and renewable lignin as hard carbon for Na-ion batteries: Impact of lignin grade. Carbon, Elsevier, 2019, 153, pp.634-647. �10.1016/j.carbon.2019.07.026�. �hal-02464916�
1
Valorizing low cost and renewable lignin as hard carbon
for Na-ion batteries: impact of lignin grade
Camélia Matei Ghimbeu1,2,3,*, Biao Zhang4,5, Alicia Martinez de Yuso1 , Bénédicte
Rety1,2,3, Jean-Marie Tarascon 3,4
1Université de Haute-Alsace, Institut de Science des Matériaux de Mulhouse (IS2M), CNRS
UMR 7361, F-68100 Mulhouse, France
2Université de Strasbourg, F-67081 Strasbourg, France
3Réseau sur le Stockage Electrochimique de l'Energie (RS2E), CNRS FR3459, 33 Rue Saint
Leu, 80039 Amiens Cedex, France
4 FRE 3677 "Chimie du Solide et Energie", Collège de France, 11 Place Marcelin Berthelot,
75231 Paris Cedex 05, France
5 Department of Applied Physics, The Hong Kong Polytechnic University, Kowloon, Hong
Kong
*Corresponding author:
E-mail: camelia.ghimbeu@uha.fr
2
Abstract
Lignin, the second most abundant biopolymer and rich in aromatic entities, is a by-product of paper industry and mainly burned to produce energy. Its commercialization for high-value added products remains largely unexplored today. Herein, we explored the preparation of hard carbon anodes for sodium-ion batteries using the two most common lignin grades, i.e, lignin kraft and lignin sulphonate. The lignin kraft hard carbon (LK-HC) shows small specific surface area (1.8 m2 g-1) and a dense random-like morphology while the latter lignin
sulphonate hard carbon (LS-HC) presents a high surface area (180 m2 g-1) and spherical
particles containing macropores. Their electrochemical performances vs. Na+ revealed a
steady capacity of 181 mAh g-1 over cycling for LK-HC, as compared to a capacity of 205
mAh g-1 for LS-HC which fades after 30 cycles due to an impurity-driven growth of a
blocking solid electrolyte interphase (SEI). To circumvent this issue, an efficient washing procedure was successfully implemented enabling to obtain (LSW-HC) carbons which deliver a high and stable capacity (284 mAh g-1) along efficiency (78.1 %).
3
1. Introduction
In a general context of global warming due to intensive industrialization and fossil fuel consumption, the negative impact on the climate change is one of the main challenges the world has to face today. Significant changes are required to produce, distribute and consume energy in a more environmental way. Renewable energy systems received great attention as an efficient solution, but their intermittency call for the development of improved energy storage systems. Today, Li-ion batteries (LIBs) are considered as one of the most advanced technologies for energy storage with application in different devices [1]. However, the lithium resources are limited and not well spread worldwide, hence the need for alternatives. Sodium, which is very abundant in earth crust and sea water, has received particularly great attention for the development of sodium ion batteries (SIBs) [2;3]. As anode material for SIBs, hard carbons which are non-porous and disordered, were shown to be much more performant than the conventional graphite anode used in LIBs. In addition, hard carbon can be produced by simple pyrolysis of biomass or polymers at moderate temperature (1100-1500°C) and with shorter annealing times compared to graphite. Up to now, most of the works devoted to hard carbon preparation uses waste biomass [4;5] due to their advantages such as abundance, low cost and environmentally friendly nature. However, their inhomogeneity related to their provenience source or season harvesting may hinder their large scale valorization. In this sense, another class of materials, i.e., the biopolymers which are cheap and commercially available are of great interest. Cellulose, which is the most abundant biopolymer, was used in several works to prepare hard carbon with high electrochemical performances in Na-ion batteries [5-8]. Lignin is the second most abundant, renewable and inexpensive biopolymer on Earth, behind the cellulose, with a global production of 50 million tons/year [9;10]. It is one of the main constituents of wood and presents an amorphous structure with a highly branched three-dimensional network and various compositions depending on the plants source. A
4
unique feature of lignin is the presence of rich aromatic carbon ring framework making it a very attractive precursor for high yield carbon preparation (~50%) [9;11;12]. Lignin is composed mainly of three different phenylpropane monomers repeating units, i.e, coniferyl alcohol, p-coumaryl alcohol and sinapyl alcohol (Figure 1). Their amounts and their possible bonding varies with the plant source, inducing a complex and undefined structure for lignin compared to other biopolymers [10;13]. The properties of lignin are also strongly depending on the extraction procedure and source. The lignin derived from the pulp and paper industries are known as kraft or lignosulfonate lignin while those coming from biorefinery are referred as Organosolv lignin. Although the extraction process for organosolv derived lignin is more environmentally friendly and its purity is higher than that of kraft lignins and lignosulfonates, the watersoluble lignosulfonates are today the most used types of lignin due to their larger scale production and their commercial availability [9;10]. The most found impurities in kraft lignins and lignosulfonates are sulphur and sodium due to the extraction process, with the feasibility of becoming soluble in water for high amounts of sulphur (~ 5wt%) as reported for olignosulfonates [13;14]
.
Therefore, most of the procedures modifies the structure of the lignin so that achieving a homogeneous production is difficult, hence plaguing its large-scale application. This is the reason why the major part of the produced lignin is used as fuel while only 2% is commercialized for high-value added products nowadays.There are a few reported attempts to prepare hard carbons from lignin-based precursors for Na-ion batteries. Dou et al. [15] used peanut shell biowaste rich in lignin that he impregnated with phosphoric acid for two weeks prior to wash it with water and to obtain after pyrolysis a hard carbon which delivers a capacity of 298 mAh g-1 with a first cycle
reversibility of 68%. Marino et al. [16] evaluated three biomass wastes containing lignin, i.e., almond shells, walnut shells and scarp wood to obtain hard carbon. The biomass was ball milled, washed with sulfuric acid and water, and finally pyrolysed at 1000°C under inert (Ar
5
or N2) or reductive (mixture Ar/H2) atmospheres. Whatever the precursor origin, the measured
capacities ranged between 255 and 270 mAh g-1 with the best performances (capacity and
cycle stability) achieved for wood biomass exhibiting a particular fibrous-like morphology. The inert atmosphere was found to be more suitable for hard carbon preparation since induced lower specific surface area and therefore, better electrochemical performances. Li et al. [17] ball milled in aqueous conditions a mixture of lignin and pitch followed by heat treatment at temperature between 1200 and 1600 °C, with the finding that a 1:1 mixture treated at 1400°C produces a carbon with a capacity of 254 mAh g-1 and an initial irreversibility of 18%.
Following a similar procedure, Zhang et al. [18] used a (1:1) mixture of lignin and epoxy resin to obtain hard carbons with capacities of 316 mAh g-1 and 18 % of initial irreversibility.
Worth to mention is also the synthesis of carbon spheres with a capacity of ~300 mAh g-1 at
0.4 C current rate, by a water-in-oil reverse-phase polymerization of lignin, formaldehyde and 5 % hexamethylenetetramine (HMTA) in ammonia aqueous solutions followed by thermal annealing under hydrogen flow at 1300°C [19].
In light of the aforementioned examples, the use bio-wastes containing lignin or mixture of lignin with other polymeric or organic compounds appear as an attractive option to obtain hard carbons. However, cheap and highly available commercial lignin ready for industrialization was not yet proposed for such aim. We thus decided to explore the most common commercial available lignin raw materials (lignin kraft and lignin kraft low sulphonate content) as renewable source for the preparation of hard carbon materials for Na-ion batteries applicatNa-ion. We first established the physical-chemical properties of both lignin-derived carbons and used such knowledge to propose an efficient and scalable water washing procedure for controlling impurities and surface areas so as to obtain from lignin sulphonate a hard carbon having high capacity, i.e., 309 mAh g-1 with an irreversible initial capacity of
6
2. Experimental part
2.1. Hard carbon synthesis
Two grades of lignin alkali were purchased from Sigma-Aldrich®. The first grade (lignin kraft, denoted as LK) is a solid dark orange powder insoluble in water while the second one (lignin kraft low sulphonate content, denoted as LS) is a dark-red powder readily soluble in water (Figure 1). Firstly, two hard carbon materials were prepared by placing the as-received lignin powders in an alumina boat and by heating up to 1200°C under argon with a heating rate of 5°C/min and an annealing time of 1h. The obtained hard-carbons are denoted LK-HC and LS-HC, respectively (Figure 1). The temperature selection was done according to our previous works [20;21], where a range between 1000 and 1400°C allow a good balance between the porosity and the structure of the materials. Since both raw lignin precursors and consequently the derived carbon contain some impurities, washing with water was performed more intensively on lignin kraft low sulphonate content (LS) having a higher amount of impurities. As LS is soluble in water, firstly was thermally annealed at 600°C for 1h in argon to obtain a carbon which is insoluble in water, therefore, facilitating the washing. Further thermal annealing at 1200°C in the conditions described above allows obtaining the hard carbon labeled as LSW-HC. Another supplementary material was prepared by washing the LSW-HC with water and labeled as LSW2-HC. The entire synthesis procedure is schematically illustrated in Figure 1.
7 Lignin source Lignin sulphonate, LS Lignin Kraft, LK TT 1200°C LK-Hard Carbon LS-Hard Carbon 1. TT 600°C 2. Washing 3. TT 1200°C
LSW-Hard Carbon Washing LSW2-Hard Carbon
Figure 1: Synthesis schema of hard carbon derived from two lignin kraft grades, LK and LS.
2.2. Materials characterization
Differential scanning calorimetry (DSC) was performed on a METTLER TOLEDO DSC 1 under N2 atmosphere with a debit of 100 ml min-1 at a heating rate of 10 K min-1. The
decomposition of lignin precursors was followed by thermogravimetric analysis (TGA) using a TGA 851 (Mettler-Toledo) instrument, by heating the samples under nitrogen atmosphere (100 ml/min) with a heating rate of 5°C min-1 up to 900oC. The materials morphology was
evaluated by scanning electron microscopy (SEM) analysis using a FEI Quanta 400 scanning electron microscope. The macropore size was determined with ImageJ software by counting ~ 250 pores from different SEM images in order to ensure good representation of the material. The SEM set-up is equipped with an energy dispersive analyzer (EDX) which was used to determine the chemical composition of the raw lignin and hard carbons. Three spectra were recorded in distinct places on the material by performing EDX mapping on large zones to be representative for the entire material. The average values were calculated and reported in the manuscript. Elemental analyses (EA) were performed on a Thermo Electron elemental analyzer.
8
The surface material composition was determined by X-ray photoelectron spectroscopy (XPS) with a VG SCIENTA SES-2002 spectrometer equipped with a concentric hemispherical analyser. The incident radiation used was generated by a monochromatic Al Kα x-ray source (1486.6eV) operating at 420 W (14kV; 30mA). Wide scan spectrum (survey) signal was recorded with a pass energy of 500 eV. The textural and porous characteristics of the hard carbons were determined by measuring nitrogen adsorption/desorption and CO2 adsorption
isotherms with an ASAP2020, Micromeritics porosity analyzer at 77K and 273K, respectively. Before the analysis, the materials were firstly outgassed under primary vacuum at 300°C for ~12h to remove water from the porosity. The BET specific surface area (SSA) was calculated in the relative pressure range, P/P0, of 0.05-0.3. The pore size distributions
(PSD) were determined from the adsorption branch of the isotherms using the 2D-NLDFT heterogeneous surface model for carbon materials with slit pores implemented in SAIEUS (Micromeritics) [22]. The nitrogen and CO2 micropore volumes (Vµ) were calculated based
on the Dubinin-Radushkevich method in the relative pressure range of 10-4 and 10-2. The
material structure was evaluated by X-ray diffraction technique using a D8 ADVANCE A25 powder diffractometer (from Bruker) in Bragg-Brentano reflexion geometry θ – θ. The diffractometer is equipped with a LynxEye XE-T high resolution energy dispersive 1-D detector (Cu Kα1,2). The instrument resolution function was determined using NIST
SRM-1976b Standard. This Standard Reference Material (SRM) consists of a sintered alumina disc intended for use in calibration of X-ray powder diffraction equipment. Raman analyses were performed in a backscattering geometry with a LabRAM BX40 (Horiba Jobin-Yvon) microspectrometer equipped with a He-Ne excitation source (wavelength 532 nm). The obtained spectra were fitted with five Lorentzian peaks (D1, D2, D3, D4, and G) using OriginPro software according to the procedure reported by Sadezky et al. [23]. The material structure was investigated with a JEOL ARM-200F transmission electron microscope
9
working at 200 kV. The carbon surface chemistry and active surface area were assessed by temperature programmed desorption coupled with mass spectrometry (TPD-MS) [24]. The hard carbon material is heat-treated in vacuum (10-7 Torr) with a heating rate of 5°C min-1 up
to 950°C leading to the oxygen-containing functional groups decomposition as CO and CO2
which are continuously monitored by a mass spectrometer. Water and H2 are evolved as well
from the material. The total amount of each gas evolved can be determined by time integration of the TPD curves and by comparison with calibrated gases prior the analyses. The active surface area (ASA) was determined as described before [25]. Briefly, the hard-carbon surface cleaned during the first TPD-MS experiment is exposed to O2 at 300°C during 10 h.
The newly formed surface oxygen complexes due to the interaction of carbon defects with O2
are quantitatively determined by a second TPD-MS experiment. Knowing the amounts of CO and CO2 desorbed and considering the area of an edge carbon site that chemisorbs an oxygen
atom as 0.083 nm2, the surface area occupied by the chemisorbed oxygen which is referred as
active surface area (ASA) can be calculated. 2.3. Electrochemical tests
The electrode was made up of 80 wt.% active materials, 10 wt.% Carbon SP conductive additives and 10 wt.% carboxymethylcellulose sodium binder. The components were mixed in de-ionized water to prepare a slurry, which was coated on a copper foil. The electrodes were cut into a circular shape in a diameter of 12 mm after drying in the oven. A typical mass loading was 2 mg cm-2. Before transferring into glovebox, the electrodes were further dried at
80oC under vacuum using Buchi glass oven. 2032 coin cells were assembled utilizing Na
metal as a counter electrode and 1M NaClO4 in ethylene carbonate (EC)/ dimethyl carbonate
(DMC) as electrolyte. A piece of glass fiber (Whatman, GF/D) was placed between the electrode and Na metal to serve as separator. The cells were charged/discharged on a VMP system (Biologic) between 0-3V under a constantspecific current of 25 mA g-1.
10
3. Results and discussion
3.1 Material characterization
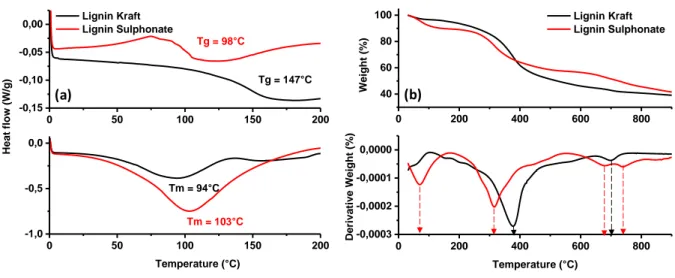
Figure 2a shows the Differential scanning calorimetry (DSC) profiles for LK and LS which evidence Tg’s of 147°C and 98°C, respectively. The higher Tg for lignin kraft indicates a higher degree of polycondensation and cross-linking [13;26]. This is supported as well by the water peak evolution which is less intense and occurs at lower temperature (94 vs. 103°C, Figure 2a down) for lignin kraft than lignin sulphonate. These differences in cross-linking of lignin may induce the formation of hard carbon with different structure/texture. To check this aspect, the thermal decomposition of lignin was studied. The thermogravimetric (TGA) and 1st derivative thermogravimetric curves (DTG) are shown in Figure 2b.
0 200 400 600 800 -0,0003 -0,0002 -0,0001 0,0000 Deriva tiv e Wei gh t ( %) Temperature (°C) 0 200 400 600 800 40 60 80 100 Lignin Kraft Lignin Sulphonate Weig ht (%) (a) (b) 0 50 100 150 200 -1,0 -0,5 0,0 Tm = 94°C Tm = 103°C Tg = 98°C Heat fl ow (W/g ) Temperature (°C) Tg = 147°C 0 50 100 150 200 -0,15 -0,10 -0,05
0,00 Lignin Kraft Lignin Sulphonate
Figure 2: Differential scanning calorimetry (a) and thermogravimetric analyses (b) of lignin LK and LS under inert atmosphere.
A first mass weight loss is observed at temperatures below 100°C, namely for LS (~10 wt. %), that we mainly ascribe to the removal of water molecules. A greater mass loss (30-45 wt. %) at higher temperature (300-400°C) can also be visualized and it is related to the thermal
11
decomposition of lignin and more specifically of the β-O-4 aril-ether linkage which is predominant in the lignin [27]. For LS, the decomposition occurs at lower temperature (316 °C) instead of 377°C for LK, and this is in line with its lower degree of cross-linking. Afterwards, there is another smooth and gradual decrease in the mass (12-16 wt.%) between 400 and 900°C that we associated to the removal of oxygen-containing functional groups from carbon surface and the reorganisation of the carbon structure. Lastly, a few weak peaks can be noticed at around 700°C (Fig. 2 bottom right) that we believe to be related to the decomposition of some impurities as will be discussed later on. The overall conversion yield of the lignin precursor into carbon is around 40 wt.%, or even 50 wt.% for LS bearing in mind that the yield is calculated on dry basis (do to take into consideration the water amount). Such high carbon yield is one of the main advantage and interest to use lignin as carbon precursor. Next, we studied the morphology of the obtained carbon materials by SEM (Figure 3). For LK-HC (Figure 3a), the material presents dense particles with irregular random shape having sizes ranging between 30 and 60 µm. This contrasts with the LS-HC particles (Figure 3b) which have a spherical morphology with a large size distribution, ranging from 20 to 100 µm. A closer look to the inner part of the particle reveals the presence of macropores with sizes below 10 µm together with, in a minor amount, pores of larger size, rarely exceeding 20 µm (see in-set Figure 3c). Overall, the pyrolysis of the two lignin results in carbon materials with different particle shape and size, which may influence the electrode preparation in terms of wettability or electrolyte percolation.
12
(c)
(a)
200 µm
200 µm
50 µm
50 µm
(b)
(d)
0 10 20 30 40 0 20 40 60 80 100 Count Macropore size (µm)Figure 3: SEM images of LK-HC (a, b) and LS-HS (c, d) hard carbons. In-set Figure 3c: macropore size distribution of LS-HC.
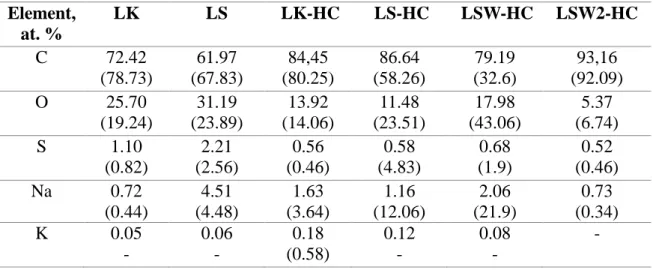
The chemical composition of the materials was studied by several complementary techniques, i.e., EDX, XPS and EA. The LK and LS raw lignin materials contain beside C and O, impurities such as S, Na and traces of K which are coming from the extraction process of the lignin (Table1). The amount of impurities is higher in LS, i.e., S (2.2 vs 1.1 at.%) and Na (4.5 vs 0.7 at.%), than LK.
13
Table 1: Chemical composition of kraft and sulphonate lignin and their corresponding hard carbons determined by EDX and XPS techniques (XPS values are given in brackets).
Element, at. % LK LS LK-HC LS-HC LSW-HC LSW2-HC C 72.42 (78.73) 61.97 (67.83) 84,45 (80.25) 86.64 (58.26) 79.19 (32.6) 93,16 (92.09) O 25.70 (19.24) 31.19 (23.89) 13.92 (14.06) 11.48 (23.51) 17.98 (43.06) 5.37 (6.74) S 1.10 (0.82) 2.21 (2.56) 0.56 (0.46) 0.58 (4.83) 0.68 (1.9) 0.52 (0.46) Na 0.72 (0.44) 4.51 (4.48) 1.63 (3.64) 1.16 (12.06) 2.06 (21.9) 0.73 (0.34) K 0.05 - 0.06 - 0.18 (0.58) 0.12 - 0.08 - -
After thermal annealing at 1200°C, the obtained hard carbon (LK-HC and LS-HC) materials present a lower content in oxygen and impurities (S, Na) than their counterpart precursors, as revealed by EDX (Table 1). Interestingly, the XPS results show a significantly much higher amount of impurities that in the precursors. Taking into consideration that XPS analysis probe only the surface of the materials (first 10th nanometers), it is reasonable to assume that these
metal impurities migrate from the inside of the material to the surface due to their evaporation during the heating process at 1200°C, temperature which exceeds their boiling point (882°C for Na). Some on these impurities are evacuated and some of them may remain on the surface of the materials and once exposed to atmosphere, oxygen and CO2 can be absorbed to further
reform metal carbonates or oxides. Note that the amount of impurities is similar for the LSW-HC material (e.g treated at 600°C, washed with water and then treated at 1200°C) that for LS-HC (directly treated at 1200°C), with the exception that the Na content is two times higher (EDX, Figure 4a) for the former. XPS further confirms the highest amount of Na but also of oxygen (Figure 4b), suggesting the presence of Na-O bonded surface species.
14 C O Na S 0 20 40 80 90 100 EDX Compo sit io n (a t %) Chemical elements LK-HC LS-HC LSW-HC LSW2-HC C O Na S 0 20 40 80 90 100 XP S Compos iti on (a t %) Chemical elements LK-HC LS-HC LSW-HC LSW2-HC (a) (b)
Figure 4: Chemical composition of hard carbon materials derived from the two lignin grades determined by EDX (a) and XPS (b) techniques.
To get more insights about this aspect, the deconvolution of the high resolution XPS spectra for LS-HC and LSW-HC was performed as shown in Figure 5. The C1s spectra for LS-HC (Figure 5a) present an important contribution at 284.5 eV coming from the Csp2. The
associated oxygen-containing functional groups, ie., ether (C-OR), carbonyl (C=O) and carbon bonded to carbonyl groups (C-C=O), are observed in significant less extent between 284-289 eV [28]. Another important peak is seen at 286.8 eV and associated to C-C bonds due to the adventitious carbon [29]. Small peaks corresponding to carbonate (CO32-) and K2p are
observed as well at 290.3 eV and 295.7 eV, respectively. For the LSW-HC (Figure 5c), the contribution of the Csp2 is significantly decreased in the favour of carbonates and adventitious
carbon, suggesting a higher amount of impurities in the surface of the material. The Na1s spectra (Figure 5b) show one peak placed at 1072.5 eV which can be associated most likely to sodium carbonates and/or sulphates, however, it is not possible to discriminate between them due to their similar binding energy. The S2p peak (Figure 5d) reveals that the sulphur is present in different forms in the material, i.e., sulphate (SO42-, ~ 55%), sulfonate (SO3-, ~20%)
15 296 294 292 290 288 286 284 282 C1s K 2p3/2 CO3 2-C=O C-OR C-C In te ns ity (a .u .)
Binding Energy (eV)
C sp2 1076 1074 1072 1070 1068 In te ns ity (a .u .)
Binding Energy (eV) Na 1s (b) (c) (d) (a) 296 294 292 290 288 286 284 282 Csp2 C=O C-OR C-C=O CO2-3 C-OR K 2p3/2 C-C C-C In te ns ity (a .u .)
Binding Energy (eV) C1s 175 170 165 160 S 2p S 2p1/2(SO4 2-) S 2p3/2(SO4 2-) S 2p1/2(SO3 -) S 2p3/2 (SO3 -) S 2p1/2 (S-C) In te ns ity (a .u .)
Binding Energy (eV)
S 2p3/2 (S-C)
F igure 5: XPS deconvoluted spectra: C1s spectra for LS-HC (a), C1s spectra (b), Na1s spectra (c) and S2p spectra (d) for LSW-HC.
These results show that the nature and amount of the formed impurities are different in the LS-HC and LSW-HC which might be triggered by the intermediate heating (600°C) coupled with washing performed on LSW-HC. To check this point, XRD was performed (Figure S1a) and the results showed that mainly Na2CO3 (PDF 19-1130) is formed after the annealing at
600 °C which is only slightly removed after washing. However, EDX analyses (Figure S1b and Table S1) revealed a significant decrease of Na content after washing (from ~ 6.0 to 1.7 at.%), implying that most of the Na-based impurities are rather in amorphous form, most likely NaOH coming from the extraction process of lignin. Therefore, the left impurities
16
(Na2CO3 and S) on the washed LS-600 carbon will follow different reaction pathway during
the carbonization at 1200°C, explaining the different surface chemistry observed between LSW-HC and LS-HC. As no surprise, the second washing (LSW2-HC) removes further impurities (Na-O) so that the composition of the bulk and in the surface become similar with this sample showing the highest carbon content (93 at.%) among the studied ones (Table 1). The elemental analysis (Table S2, Supporting Information) which is more sensitive to light elements reveal rather similar trend for C and S amounts in the materials as by EDX, however, no information about the oxygen and impurities content cannot be obtained by this technique.
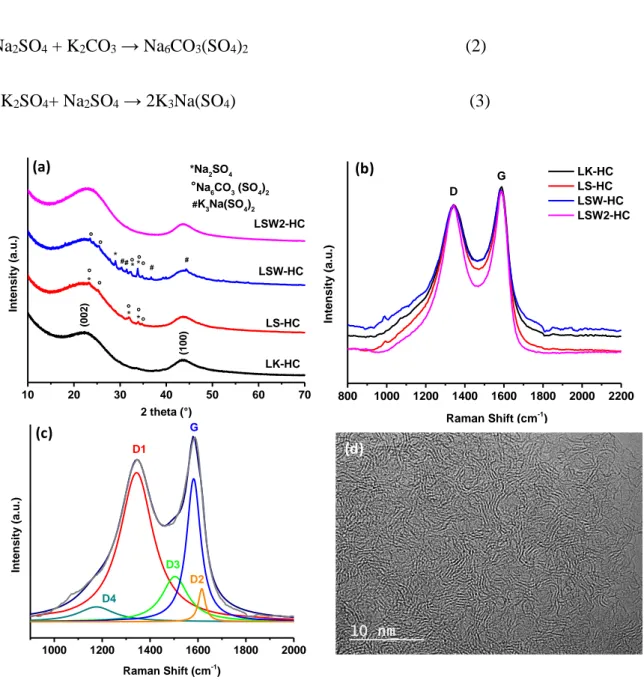
Besides composition, and of paramount importance for the electrochemical performances of carbons is their local structure that we address next by complementary X-ray diffraction and Raman spectroscopy (Fig. 5). XRD analysis shows for all materials two peaks located at ~24° and 43° corresponding to the (002) and (100) diffraction planes of graphite. The peaks are very broad implying a low degree of graphitisation, as expected for hard carbon materials, which combine amorphous carbon and few graphitic domains. The calculated interlayer spacing (d002) is nearly similar, i.e., 3.842 vs. 3.827 Å for LK-HC and LS-HC, respectively.
This d-spacing was found to be sensitive to water washing since it decreases to 3.797 Å (first washing LSW1-HC) to stabilized at 3.668 Å (second washing LSW2-HC), suggesting the removal of impurities located in some extent between graphene layers. In addition to the peaks related to the carbon, several small and sharp peaks are noticed for LS-HC which could be mainly indexed to Na2SO4 (PDF No: 24-1132) and Na6(CO3) (SO4)2 (PDF No: 24-1134).
For washed LSW-HC, in addition to the Na2SO4 and Na6CO3(SO4)2 phases, a K3Na(SO4)2
phase (PDF No: 20-0928) is detected as well. The presence of carbonates and sulphates was already seen by XPS analysis. The formation of such compounds may be favoured by the presence of sodium-based and sulphur-based impurities which in contact with oxygen and
17
humidity may lead to sodium oxides and sulphuric acid which react according to the reaction 1 giving rise to sodium sulphate. The latest one may interact with potassium carbonate to form Na6CO3(SO4)2 and K3Na(SO4)2 depending on the ratio between sodium sulphate and
potassium carbonate (Eqs. 2-3) [31;32].
Na2O + H2SO4 → Na2SO4 + H2O (1) Na2SO4 + K2CO3 → Na6CO3(SO4)2 (2) 3K2SO4+ Na2SO4 → 2K3Na(SO4) (3) 1000 1200 1400 1600 1800 2000 D2 D3 D4 D1 In te ns ity (a .u .) Raman Shift (cm-1 ) G 800 1000 1200 1400 1600 1800 2000 2200 G In te ns ity (a .u .) Raman Shift (cm-1 ) LK-HC LS-HC LSW-HC LSW2-HC D 10 20 30 40 50 60 70 ° ° ° ° ° (1 00 ) °Na6CO3 (SO4)2 #K3Na(SO4)2 * * * # # # ° ° ° ° ° * * LSW2-HC LSW-HC LS-HC In te ns ity (a .u .) 2 theta (°) LK-HC * *Na2SO4 # (0 02 ) (a) (b) (c) (d)
Figure 6: XRD patterns (a) and normalized Raman spectra based on D peak (b) of hard carbon materials derived from LK and LS precursors, (c) example of deconvoluted Raman spectra and HRTEM for LK-HC (d).
18
Lastly it is worth mentioning that no crystalline impurities could be observed after the second washing (LSW2-HC), hence highlighting importance of the precursors and synthesis pathways on the nature of the resulting impurities.
Raman spectroscopy was further used to get insights on the carbon structure. The normalised Raman spectra (Figure 6b) show two broad peaks at 1350 and 1585 cm-1 corresponding to the
D and G band of the disordered graphitic lattice (breathing mode of sp2 atoms in ring) and the
ideal graphitic lattice, E2g symmetry (stretching mode of sp2 atoms in rings and chains)
domains in the materials, respectively. The G band is slightly much intense and less broad than the D band. The deconvolution of Raman spectra (Figure 6c) according to the procedure described by Sadezky et al. [23], reveals four D peaks (D1, D2, D3 and D4). The D1 peak is associated with the disordered graphitic lattice (graphene layer edges, A1g symmetry) and the ratio between D1 and G peak (AD1/AG) gives information about the structural disorder in
the materials [33]. The calculated values were found very similar for LK-HC, LS-HC and LSW-HC, i.e., 2.4 while in the case of LSW2-HC was much lower, 1.9 (Table 2). The full width at half-maximum (FWHM) follows the same trend indicating a better structural organisation for LSW2-HC material. The D3 and D4 peaks are related to the amorphous carbon including adsorbed molecules and/or functional groups and to the disordered graphitic lattice (A1g symmetry), respectively. The AD4/AG ratio gives values rather close for all
materials, i.e., 0.34 while for the AD3/AG ratio, the values slightly decrease from 0.59 for
LK-HC to 0.49 for LSW2-LK-HC as seen in Table S3 (Supporting Information), indicating less amorphous carbon and functional groups in the later material. The assembly of these results are in line with the XRD patterns showing smaller d002 space for LSW2-HC, hence, better
structural organisation. The HRTEM images (Figure 6d and Figure S2, Supporting Information) reveals for all materials similar structure which is typical for hard carbon
19
structure combining disordered carbon domains and short graphitic layers staked in 3 to maximum 5 layers.
Deeper insights into the materials surface chemistry and structure were provided by TPD-MS analyses. The oxygen-containing functional groups present in the carbon surface are decomposed as CO and CO2 groups by heating up to 900°C. The TPD-MS desorption profiles
are shown in Figure 7a-d.
For the CO2 desorption curve, a large peak between 200 and 800°C is observed for LK-HC
(Figure 7a), which become narrower and more intense in the temperature range of 500-800°C for LS-HC and LSW-HC (Figure 7b, c). The presence of such CO2 peaks in the high
temperature range is unusual, since the CO2 groups are mainly coming from the
decomposition of carboxyl (- COOH) and anhydrides (-COO-OR) groups and occurs at low temperature (< 500°C) [34;35]. Bearing in mind the presence of metal carbonate impurities revealed by XRD diffraction and the high decomposition temperature of carbonates observed by TGA and TPD-MS in other works [36;37], it is reasonable to associate the high desorption of CO2 at high temperature to the carbonate decomposition. This is sustained also by the
TPD-MS desorption profiles of the washed material LSW2-HC (Figure 7d), where the intensity of this peak is significantly reduced.
The CO decomposition profiles show two main peaks, one placed at around 300°C and another one at around 800°C. The decomposition of oxygen-containing functional groups results as well from the decomposition of more stable groups such as carbonyl (-CO), phenol (-OH) and ether (C-O-R) and occurs at high temperature (> 500°C) [34;35]. Therefore, the CO peak observed at low temperature cannot be associated to the decomposition of functional groups but rather to the decomposition of carbonate impurities. It can be seen that at this temperature the CO groups are released in the same time as the CO2 groups. The amount of
20
COx groups (CO + CO2) coming from the oxygen-based functional groups and carbonate
impurities are shown in Figure 7e. It can be observed that the LSW-HC presents the highest amount of COx (1.18 mmol g-1) which diminishes after the washing procedure (LSW2-HC),
while the LK-HC presents the lowest amount of COx groups (~0.5 mmol g-1).
LK-HC LS-HC LSW-HC LSW2-HC 0 3 6 9 12 15 ASA ( m 2 g -1)
Lignin Hard Carbon ASA LK-HC LS-HC LSW-HC LSW2-HC 0.0 0.5 1.0 1.5 COx group s (mmol g -1)
Lignin Hard Carbon
COx groups (a) (b) (c) (d) (e) (f) 0 200 400 600 800 1000 0E+00 1E-07 2E-07 3E-07 H2 H2O CO CO2 0 200 400 600 800 1000 0E+00 1E-07 2E-07 3E-07 H2 H2O CO CO2 SO2 0 200 400 600 800 1000 0E+00 1E-07 2E-07 3E-07 H2 H2O CO CO2 SO2 Desorption Rate ( mol s -1 g -1) Temperature (°C) 0 200 400 600 800 1000 0E+00 1E-07 2E-07 3E-07 H2 H2O CO CO2 SO2
Figure 7: TPD desorption profiles for LK-HC (a), LS-HC (b), LSW-HC (c) and LSW2-HC (d); amounts of desorbed COx groups (c) and active surface area (d) of hard carbons
21
In light of previous studies on “impurity free” hard carbons prepared at the same temperature, where the amount of COx groups is lower than 0.5 mmol g-1 [21;38], it can be concluded that
an important part of the COx groups is coming from carbonates impurities. Besides COx groups desorption, water is also desorbed. Its origin is twofold and enlists the low temperature physisorbed water together with the in-situ formed water by secondary reactions occurring between the oxygen-containing functional groups during the TPD-MS experiment. H2 groups
are observed as well at high temperature and they are ascribed to the C-H bonds cleavage and carbon organisation. Lastly, we also noticed the desorption of minor amounts of SO2 groups
that most likely come from the sulphur-based impurities (sodium sulphate) and S present as dopant in the carbon aromatic ring.
Once the surface chemistry is removed during the TPD-MS experiment, the materials are exposed to O2 chemisorption at 300°C, hence favouring additional reactivity of the defects
(edge defects, vacancies, dislocations…) which formed oxygen-containing groups that were again quantified by TPD-MS. The active surface area (surface occupied by the defects) can then be calculated and the values are rather similar for all materials, ranging between 9 and 13 m2 g-1 (Figure 7f). Such values are comparable with those obtained on cellulose derived hard
carbons
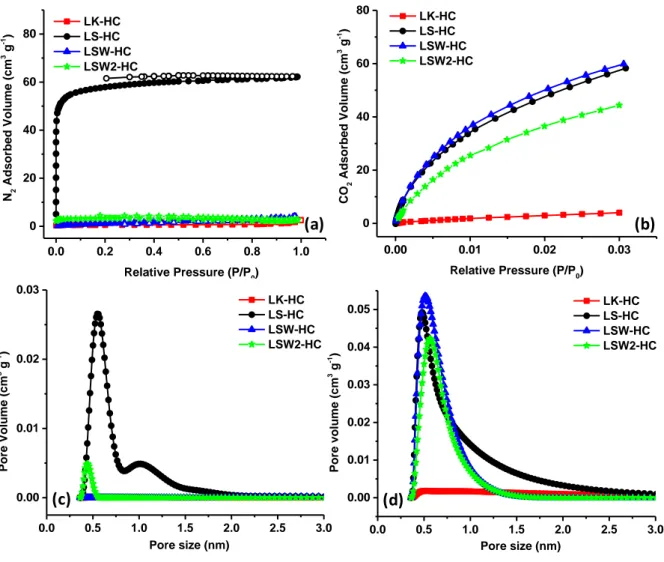
Asides from local structure, surface sites, the materials porosity is of prime importance since it may influence the interactions with the electrolyte and the formation of solid electrolyte and irreversible capacity [21;39;40], hence the importance of its knowledge. Figure 7 illustrates the nitrogen adsorption/desorption curves of hard carbon derived from lignin and their corresponding pore size distribution. For LK derived carbon, the nitrogen adsorbed volume is very small, within the limit of the detection of the technique, leading to a small BET surface area < 2 m2 g-1. On the contrary, when using LS, the nitrogen adsorbed quantity is
22
microporous materials. The surface area is rather high, 180 m2 g-1 and the majority of pores
are centered around 0.55 nm which are coexisting with larger pores of about 1.0 nm (Figure 7c). Such surface area is very high compared to LK but also to other precursors heated at similar temperatures where the SSA is significantly much smaller [5;20]. This developed porosity during the pyrolysis may result from an in-situ activation of the carbon due to the presence of impurities such as NaOH or KOH which triggers temperature-driven reactions (e.g, eqs. 4-6) releasing gaseous products [41;42]. This hypothesis is fully consistent with the observation of a lower porosity (5.6 m2 g-1) for the washed materials (LSW-HC) that are
nearly free of impurities. The slight surface area increase (10.1 m2 g-1) note after the second
washing (LSW2-HC) can simply be explained by the removal of extra impurities which liberates some blocked pores as seen in the pore size distribution (Fig.7c). The nitrogen micropore volumes, Vµ are low and vary in the same manner as the specific surface area (Table 2).
6NaOH + 2C => 2Na + 3H2 + 2Na2CO3 (4)
Na2CO3 + C => Na2O + 2CO (5)
Na2O + C => 2Na + CO (6)
More insights on the material porosity were assessed by CO2 adsorption, which allows to
probe small pores (< 0.7 nm). The CO2 isotherms and the pore size distribution (Figure 7b, d)
show for LK-HC a very small amount of adsorbed CO2, hence, implying the absence of
ultramicropores. In contrast, the CO2 isotherms reveal a high amount of CO2 for LS-HC
indicating the presence of numerous ultramicropores with sizes around 0.55 nm that is consistent with the higher surface area (302 to 378 m2 g-1) and ultramicropore volume, Vµ
23 0.0 0.5 1.0 1.5 2.0 2.5 3.0 0.00 0.01 0.02 0.03 0.04 0.05 Pore vo lu me (cm 3 g -1 ) Pore size (nm) LK-HC LS-HC LSW-HC LSW2-HC (a) (b) (c) (d) 0.0 0.2 0.4 0.6 0.8 1.0 0 20 40 60 80 N2 Ads orbe d Volu me (cm 3 g -1 ) Relative Pressure (P/P0) LK-HC LS-HC LSW-HC LSW2-HC 0.0 0.5 1.0 1.5 2.0 2.5 3.0 0.00 0.01 0.02 0.03 Pore Volu me (cm 3 g -1 ) Pore size (nm) LK-HC LS-HC LSW-HC LSW2-HC 0.00 0.01 0.02 0.03 0 20 40 60 80 CO 2 Ads orbe d Volu me (cm 3 g -1 ) Relative Pressure (P/P0) LK-HC LS-HC LSW-HC LSW2-HC
Figure 7: Nitrogen (a) and CO2 adsorption isotherms (b) and their corresponding pore size
distribution, nitrogen (c) and CO2 (d) of hard carbon materials derived from LK and LS.
Altogether the aforementioned physico-chemical analyses of the reported hard carbon materials resulted from the pyrolysis of kraft and sulphonate lignin (Table 2) have revealed some similarities in terms of interlayer spacing (d002), ratio between D and G band (ID/IG) and
active surface area (ASA), but also drastic differences in terms of morphology, porosity and surface chemistry. More specifically, LK-HC is characterized by a dense morphology, low surface area and some Na and S impurities (~2 at%) while LS-HC reveals rather opposite characteristics including high surface area with micro and ultra-micropores, spherical morphology with macropores and higher content of impurities which are located more in the
24
surface of the material than in the bulk. Moreover, we have shown that some of these critical parameters (amount of impurities, surface area, porosity, …) can be tuned by a water washing procedure. Thus, at this stage a legitimate question regards how these carbons, showing different physical-chemical characteristics, performs as anode materials in Na batteries.
Table 2: Materials physico-chemical characteristics: specific surface area (SSA), micropore volume (Vµ), graphite interlayer space (d002), oxygen content by EDX (OEDX) and active
surface area (ASA).
3.2 Electrochemical performances
The Na storage behaviors of as-prepared hard carbon materials were investigated in half cells (Figure 9). LK-HC delivers an initial discharge capacity of 273 mAh g-1, but only 181 mAh g
-1 is recovered upon charging, giving rise to an initial irreversible capacity (C
irr.) of 33.6%
(Fig. 9a). The main reason for the irreversible capacity in the first cycle is related to the formation of solid electrolyte interphase (SEI) due to the interaction of the carbon with the electrolyte. Usually, one important parameter leading to the high irreversible capacity is the carbon surface area.
Material SSA N2 m2 g-1 Vµ N2 cm3 g-1 SSA CO2 m2 g-1 Vµ CO2 cm3 g-1 d002 Å AD1/AG OEDX at% ASA m2 g-1 LK-HC 1.6 0.0008 40 0.04 3.842 2.4 13.92 9 LS-HC 180 0.092 378 0.16 3.827 2.4 11.48 12 LSW-HC 5.6 0.002 377 0.24 3.797 2.4 17.98 10 LSW2-HC 10.1 0.005 302 0.19 3.668 1.9 5.37 13
25 0 50 100 150 200 250 300 350 400 0,0 0,5 1,0 1,5 2,0 2,5 3,0 Vo ltag e (V vs . Na) Capacity (mAh/g) 1st 2nd 24.7% 0 50 100 150 200 250 300 350 400 0,0 0,5 1,0 1,5 2,0 2,5 3,0 21.9% 1st 2nd Vo ltag e ( V v s . Na +/Na ) Capacity (mAh/g) (a) (b) (c) (d) 0 50 100 150 200 250 300 350 400 0,0 0,5 1,0 1,5 2,0 2,5 3,0 35.7% 1st 2nd Vol tage (V vs. Na ) Capacity (mAh/g) 0 50 100 150 200 250 300 350 400 0,0 0,5 1,0 1,5 2,0 2,5 3,0 Capacity (mAh/g) Vol tage (V vs. Na ) 1st 2nd 33.6% 0 10 20 30 40 50 0 100 200 300 400 LK-HC LS-HC LSW-HC LSW2-HC C apa city (mA h/g) Cycle number LK-HC LS-HC LSW-HC LSW2-HC 0 20 40 60 80 100 Initial Coulombic E ff icienc y ( %) (e) (f)
Figure 9: First charge/discharge curves of (a) LK-HC, (b) LS-HC, (c) LSW-HC and (d) LSW2-HC and first columbic efficiency (e) and evolution of capacity vs. cycle number (f) for all hard carbons (C rate C/10).
26
Considering the low surface area of 1.6 m2 g-1 (based on N2 adsorption) and the low amount
of ultramicropores (based on CO2 adsorption), it is assumed that the observed capacity loss
(33.6%) may not be associated to the porosity. Other bulk or surface phenomena must be considered as suggested elsewhere [43]. Impurities detected in the material (alkali carbonates/ sulfate) along with the high amount of heteroatom’s (mainly oxygen and in less extent sulfur/hydrogen, Table 2) may also lead to some irreversible reactions with the electrolyte [38;44;45]. Moreover, on this material it was particularly observed high amount of water released by TPD-MS (Figure 7). The high temperature of water release (between 100 and 300 °C) suggest rather strong bonding on carbon surface and not physisorption which occurs bellow 100 °C [35]. The presence of water can induce therefore undesirable decomposition of the electrolyte contributing to the SEI formation as well.
For LS-HC, a slightly higher irreversible capacity of 35.7% is observed in the firstly cycle (Fig. 9b) compared to LK-HC (33.6%). The reasons behind the observed CE are in this case more related with the larger specific surface area of 180 m2 g-1 of the material although a
contribution from the impurities and oxygen-containing groups and defects should be taken into account as well. The derivative galvanostatic curves (Figure S3b, Supporting Information) shows in addition to the peaks corresponding to the insertion of Na in the graphitic domains (< 0.1 V), a supplementary peak at 0.3 V during the first reduction (sodiation) process. Such peak associated to the SEI formation, is observed only on this carbon which show particularly high specific surface area. The peak disappears upon subsequent cycle indicating the SEI formation mainly in the first cycle. Nevertheless, the material gives a higher reversible capacity of 205 mAh g-1 due to the open structure
containing macropores which can facilitate the electrolyte diffusion and fast charge transfer. We therefore focused on this sample but decreasing the surface area to limit the irreversible capacity. This was achieved by the washing procedure previously described, which has led to
27
samples (LSW-HC) containing ultramicropores (< 0.7 nm, detected only by CO2) and
showing a significant decrease in surface area (5.6 m2 g-1). Using this trick, we could decrease
the irreversible capacity to 21.9 % (Fig. 8c) and reach a sustainable reversible capacity of 284 mAh g-1. Interestingly the second washing step leads to a slightly greater irreversible capacity
(~ 24.7%), consistent with the largest surface area of powders (10.1 m2 g-1), but at the same
time a greater reversible capacity that exceeds 300 mAh g-1, most likely due to the largest
amount of accessibly porosity hence providing a better utilization of the electrode.
In order to obtain in-depth insights on the Na storage mechanism in these materials, the galvanostatic charge/discharge curves were analyzed in more detail. They present two distinct regions, i.e., a slope between 3V and 0.1 V and a plateau at low potential (bellow 0.1 V). It is worth to mention that the mechanisms of Na insertion in the slope and in the plateau regions was studied in several works and their attribution is still under debate as resumed in the following review articles [4;46-48]. Briefly, the early mechanism proposed by Stevens & Dahn in the 2000s [49] associated the slope part to the insertion of sodium in the pseudo-graphitic nano-domains while the plateau region with the insertion of the sodium in the nanopores. Although this mechanism was accepted for about one decade, since 2010s, several works showed results which substantially disagree with this mechanism. More precisely, the low voltage plateau was preferentially attributed to the insertion of the sodium in the pseudo-graphitic domains based on experimental and theoretical studies [50;51] and on the observation that the decrease of the interlayer space lead to longer plateau. On the contrary, it was seen as well that the increase in the porosity triggers a decrease/disappearance of the plateau [45;51] and that materials showing no porosity (by N2 or CO2 adsorption) exhibits still
a plateau capacity [38;45;52]. These facts strengthen the idea that the adsorption of Na in the carbon pores does not occur in the plateau region as suggested by Stevens & Dahn but rather in the slope region. In addition, it has been also pointed out that the active site like graphene
28
edge defects and functional groups (heteroatoms) are playing an important role in the sloping part as well [21;52;53]. Therefore, the mechanism which is based on “adsorption-insertion” of Na in the slope/plateau region, respectively, seems to be more reliable according to recent studies [21;38;45].
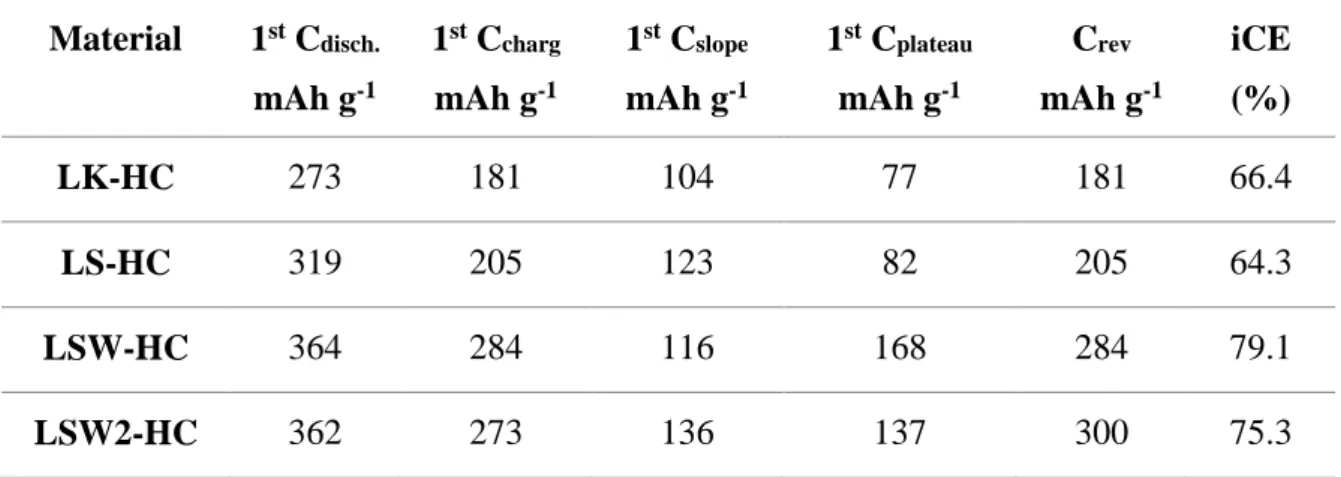
Analyzing the galvanostatic charge/discharge curves considering this mechanism, we can see that for LK-HC and LS-HC the capacity arising for the slope is much higher (104 and 123 mAh g-1, Table 3) than the one coming from the plateau (77 and 82 mAh g-1, Table 3).
Table 3: Materials electrochemical performances: first discharge, first charge, first slope and plateau capacities, reversible capacity and initial coloumbic efficiency (iCE).
Material 1st C disch. mAh g-1 1st C charg mAh g-1 1st C slope mAh g-1 1st C plateau mAh g-1 Crev mAh g-1 iCE (%) LK-HC 273 181 104 77 181 66.4 LS-HC 319 205 123 82 205 64.3 LSW-HC 364 284 116 168 284 79.1 LSW2-HC 362 273 136 137 300 75.3
The higher slope capacity is in well agreement with the high amount of impurities (alkali, oxygen, water)/defects for LK-HC and developed porosity/presence of impurities for LS-HC, respectively as detailed above. For LSW-HC an opposite trend is observed, the slope capacity is reduced in the favor of the plateau capacity (116 vs. 168 mAh g-1, Table 3) which well
corroborates with the decrease in the surface area (determined by nitrogen) of the material. It is worth to note that a high amount of ultramicropores (determined by CO2 adsorption) is still
29
partially closed with specific “ink-bottle” like shape [54] and not accessible to sodium. For the last material, LSW2-HC, lower slope and higher plateau capacity is seen as compared to LSW-HC giving rise to similar contributions in both regions (137 and 136 mAh g-1), that is in
agreement with the slight increase of the SSA and amount of defects contributing more to the slope region. Finally, a small overpotential arising from Na metal counter electrode could be observed by three-electrode measurements, but its influence is negligible (Figure S4, Supporting Information) excluding therefore a capacity contribution from the Na-plating.
Besides reversible and irreversible capacity another figure of merit in comparing carbon negative electrodes regards their maintained their capacity upon cycling. Figure 9 compares the capacity retention for all the electrodes when cycled against metallic sodium in coin cells at a rate of C/10.
The measurements, that appear very noisy because not collected in a controlled temperature environment, reproduced at least two times prior to be reported. Although having a lower capacity, the LK-HC delivers better capacity retention than LS-HC which show a more pronounced capacity decay after 30 cycles most likely associated to the faster growth of a partially blocking of the SEI layer. In comparison, both washed LSW-HC and LSW2-HC shows equally sustained capacity retentions although the latter contains minor amounts of impurities, hence indicating that a second washing treatment is not mandatory. In both cases a capacity of nearly 270 mAh g-1 is still maintained after 50 cycles (the maximum we have
tried so far). If one compares these results with the best results obtained in the literature for other bio-sourced hard carbon (Table 4), one can notice that they are in the same range with the advantages of the precursor being commercially available and presenting high carbon yield, important features for large scale production. Obvious optimization of the present work
30
to the assembly of full Na-ion cells to eliminate kinetic limitations associated to the metallic Na electrode. Whatever, bearing in mind the low cost of this precursor, this study work indicates that lignin-dervied hard carbon could be competitive candidates for Na-ion batteries providing additional appropriate material procedures are developed.
Table 4: Electrochemical performances of reported hard carbons derived from different bio-sourced precursors. Precursor TT (°C) iCE (%) Performances Ref.
Cellulose 1300 63 323 mAh g-1 at 20 mA g-1 after 10 cyles
200 mAh g-1 at 200 mA g-1 after 170 cyles [45]
Sucrose 1100 61 300 mAh g-1 at C/10 after 120 cyles [55]
Corn Cob 1300 86 275 mAh g-1 at C/10 after 100 cycles [56]
Cotton 1300 83 305 mAh g-1 at C/10 after 100 cycles [57]
Argan shell 1200 79 333 mAh g-1 at 25 mA g-1 after 100 cycles [44]
Peanut shell 1200 68 298 mAh g-1 at C/10 after 300 cycles [15]
Bio-waste 1000 80 270 mAh g-1 at C/10 after 80 cycles [16]
Lignin/pitch 1400 82 226 mAh g-1 at C/10 after 150 cycles [17]
Lignin/epoxy resin 1400 82 285 mAh g-1 at C/10 after 150 cycles [18]
Commercial Lignin 1200 79 270 mAh g-1 at C/10 after 50 cycles This
31
Conclusions
Two different commercially available abundant lignin biopolymers (ligning kraft, LK and sulphonate, LS) were herein investigated as attractive cheap and convenient precursor for the preparation of hard carbon anode for Na-ion batteries. Their thermal annealing at 1200°C lead into the formation of hard carbons having different porosity, surface chemistry (impurities) and morphology but similar structure. We have shown that these different carbon characteristics are governed on one hand by the initial precursors which exhibit different morphologies, compositions and cross-linking degrees, and on the other hand by the outcome of the impurities during the pyrolysis step which activate the carbon and induce the formation of high surface area material (180 m2 g-1 for LS-HC vs. 1.8 m2 g-1 LK-HC). We found that for
LS-derived hard carbon, such developed surface area results in capacity fading during cycling. To overcome these drawbacks pertaining to LS-HC carbons, we developed washing and thermal treatment procedure which resulted in a drastic decrease of the impurities enabling a successful decrease of the specific surface area (5.6 m2 g-1). This had positive
consequences on the electrochemical performances with namely a decrease of both the capacity fading, and the initial irreversible capacity (33.7 % to 21.9 %) together with an increase of the reversible capacity (205 to ~300 mAh g-1). Such simple washing procedure
could be implemented at industrial large scale to improve the lignin purity in order to take advantage of this natural abundant resource for the fabrication of high-value added products for different types of applications.
32
Acknowledgements
This work was financially supported by the European Union’s Horizon 2020 Program (project NAIADES, call: LCE10-2014, Contract no. 646433) and the RS2E network. Alicia Martinez de Yuso acknowledges the financial support from the French National Research Agency (ANR), France, project Genesis (ANR-13-BS08-0004-02). The authors thank Dr. Jean-Marc Le Meins, Dr. Philippe Fioux and Gautier Schrodj for the support with the XRD, XPS, DSC/TGA analyses via the IS2M technical platform.
References
[1] N. Nitta, F. Wu, T. Lee, G. Yushin, Li-ion battery materials: present and future. Mater Today 18 (2015) 252-64.
[2] C. Delmas, Sodium and Sodium-Ion Batteries: 50 Years of Research. Adv Energy Mater 1703137 (2018) 1-9.
[3] J.-Y. Hwang, S.-T. Myung, Y.-K. Sun, Sodium-ion batteries: present and future. Chem Soc Rev 46 (2017) 3529-614.
[4] M. Wahid, D. Puthusseri, Y. Gawli, N. Sharma, S. Ogale, Hard Carbons for Sodium-Ion Battery Anodes: Synthetic Strategies, Material Properties, and Storage Mechanisms. ChemSusChem 11 (2018) 506-26.
[5] J. Gorka, C. Vix-Guterl, C. Matei-Ghimbeu, Recent progress in design of biomass-derived hard carbons for sodium ion batteries. C 2, 24 (2016) 1-17.
[6] T. Zhang, L. Yang, X. Yan, X. Ding, Recent Advances of Cellulose-Based Materials and Their Promising Application in Sodium-Ion Batteries and Capacitors. Small (2018) 1802444.
[7] H. Yamamoto, S. Muratsukabi, K. Kubota, M. Fukunishi, H. Watanabe, J. Kim, et al., Synthesizing higher-capacity hard-carbons from cellulose for Na- and K-ion batteries . J Mater Chem A 6 (2018) 16844-8.
[8] V. Simone, A. Boulineau, A. de Geyer, D. Rouchon, L. Simonin, S. Martinet, Hard carbon derived from cellulose as anode for sodium ion batteries: dependence of electrochemical properties on structure. J Energy Chem 25 (2016) 761-8.
[9] J. Rosas, R. Berenguer, M. Valero-Romero, J. Rodriguez-Mirasol, T. Cordero, Preparation of different carbon materials by thermochemical conversion of lignin . Frontiers in Materials 1 (2014) 1-17.
33
[10] M. Norgren, H. Edlund, Lignin: Recent advances and emerging applications. Curr Opin Coll & Interf Sci 19 (2014) 409-16.
[11] W. Tenhaeff, O. Rios, K. More, M. McGuire, Highly Robust Lithium Ion Battery Anodes from Lignin: An Abundant, Renewable, and Low-Cost Material. Adv Funct Mater 24 (2014) 86-94.
[12] S. Chatterjee, A. Clingenpeel, A. McKenna, O. Riosa, A. Johs, Synthesis and characterization of lignin-based carbon materials with tunable microstructure. RSC Adv 4 (2014) 4743-53.
[13] S. Chatterjee, T. Saito, Lignin-Derived Carbon Materials. ChemSusChem 8 (2015) 3941-58.
[14] W. Doherty, P. Mousavioun, C. Fellow, Value-adding to cellulosic ethanol: Lignin polymers. Indust Crops Prod 33 (2011) 259-76.
[15] X. Dou, I. Hasa, M. Hekmatfar, T. Diemant, R. Behm, D. Buchholz, et al., Pectin, Hemicellulose, or Lignin? Impact of the Biowaste Source on the Performance of Hard Carbons for Sodium-Ion Batteries. ChemSusChem 10 (2017) 2668-76.
[16] C. Marino, J. Cabanero, M. Povia, C. Villevieille, Biowaste Lignin-Based Carbonaceous Materials as Anodes for Na-Ion Batteries. J Electrochem Soc 165 (2018) A1400-A1408. [17] Y. Li, Y.-S. Hu, H. Li, L. Chen, X. Huang, A superior low-cost amorphous carbon
anode made from pitch and lignin for sodium-ion batteries. J Mater Chem A 4 (2016) 96-104.
[18] H. Zhang, W. Zhang, H. Ming, H. Pang, H. Zhang, G. Cao, et al., Design advanced carbon materials from lignin-based interpenetrating polymer networks for high performance sodium-ion batteries. Chem Eng J 341 (2018) 280-8.
[19] X. Yu, B. Yu, J. Zhang, Y. Zhang, J. Zeng, M. Chen, et al., An Attempt to Improve Electrochemical Performances of Lignin-Based Hard Carbon Microspheres Anodes in Sodium-Ion Batteries by Using Hexamethylenetetramine. ChemistrySelect 3 (2018) 9518-25.
[20] A. Beda, P.-L. Taberna, P. Simon, C. Matei Ghimbeu, Hard carbons derived from green phenolic resins for Na-ion batteries. Carbon 139 (2018) 248-57.
[21] C. Matei Ghimbeu, J. Górka, V. Simone, L. Simonin, S. Martinet, C. Vix-Guterl, Insights on the Na+ ion storage mechanism: Discrimination between the hard carbon porosity, surface chemistry and active surface area. Nano Energy 44 (2018) 327-35. [22] J. Jagiello, J. Olivier, 2D-NLDFT adsorption models for carbon slit-shaped pores with
surface energetical heterogeneity and geometrical corrugation. Carbon 55 (2013) 70-80. [23] A. Sadezky, H. Muckenhuber, H. Grothe, R. Niessner, U. Poschl, Raman micro
spectroscopy of soot and related carbonaceous materials: Spectral analysis and structural information. Carbon 43 (2005) 1731-42.
34
[24] G. Moussa, C. Matei Ghimbeu, P.-L. Taberna, P. Simon, C. Vix-Guterl, Relationship between the carbon nano-onions (CNOs) surface chemistry/defects and their capacitance in aqueous and organic electrolytes. Carbon 105 (2016) 268-77.
[25] Ph. Bernardo, J. Dentzer, R. Gadiou, W. Märkle, D. Goers, P. Novák, et al., Influence of graphite surface properties on the first electrochemical lithium intercalation. Carbon 49 (2011) 4867-76.
[26] S. Baumberger, P. Dole, C. Lapierre, Using transgenic poplars to elucidate the relationship between the structure and the thermal properties of lignins. J Agric Food Chem 50, 2450 50 (2002) 2450-3.
[27] M. Brebu, C. Vasile, Thermal degradation of lignin-a review . Cellulose Chem Technol 44 (2010) 353-63.
[28] C. Nita, J. Fullenwarth, L. Monconduit, J.-M. Le Meins, P. Fioux, J. Parmentier, et al., Eco-friendly synthesis of SiO2 nanoparticles confined in hard carbon: A promising material with unexpected mechanism for Li-ion batteries. Carbon 143 (2019) 598-609. [29] T. Barr, S. Seal, Nature of the use of adventitious carbon as a binding energy standard. J
Vaccum Sci & Tech A 13 (1995) 1239-46.
[30] J. Zhao, B. Guan, C. Ma, B. Hu, H. Zhang, Effect of elemental sulfur in precursors on the pore structure and surface chemical characteristics of high-surface area activated carbon. J Saudi Chem Soc 21 (2017) 691-7.
[31] T. Kotera, D. Yoshioka, M. Mikuriy, Preparation and Crystal Structure of Tripotassium Sodium Disulfate. X-Ray structure analysis online 28 (2012) 45-6.
[32] M. Ribeiro Miranda, J. Sasaki, A. Bezerra Sombra, C. Costa Silva, C. Rocha Rémedios, Characterization by X Ray diffraction of mechanically alloyed tripotassium sodium sulfate. Materials Research 9 (2006) 243-6.
[33] A.C. Ferrari, J. Robertson, Interpretation of Raman spectra of disordered and amorphous carbon. Physical Review B 61 (2000) 14 095-14 107.
[34] J.L. Figueiredo, M.F.R. Pereira, M.M.A. Freitas, J.J.M. Orfao, Modification of the surface chemistry of activated carbons. Carbon 37 (1999) 1379-89.
[35] C. Matei Ghimbeu, R. Gadiou, J. Dentzer, D. Schwartz, C. Vix-Guterl, Influence of surface chemistry on the adsorption of oxygenated hydrocarbons on activated carbons. Langmuir 26 (2010) 18824-33.
[36] R. Frost, M. Hales, W. Martens, Thermogravimetric analysis of selected group (II) carbonate minerals-implication for the geosequestaration of greenhouse gases. J Therm Anal Calor 95 (2009) 999-1005.
[37] C. Matei Ghimbeu, R. Gadiou, J. Dentzer, L. Vidal, C. Vix-Guterl, A TPD-MS study of the adsorption of ethanol/cyclohexane mixture on activated carbons. Adsorption 17 (2011) 227-33.
35
[38] B. Zhang, C. Matei Ghimbeu, Laberty C, C. Vix-Guterl, J. Tarascon, Correlation between microstructure and Na Storage behaviour in hard carbon. Adv Energ Mate 1501588 (2016) 1-9.
[39] C. Bommier, W. Luo, W.-Y. Gao, A. Greaney, S. Ma, X. Ji, Predicting capacity of hard carbon anodes in sodium-ion batteries using porosity measurements. Carbon 76 (2014) 165-74.
[40] G. Hasegawa, N. Kanamori, J.-I. Ozaki, K. Nakanishi, T. Abe, Hard carbon anods for Na-ion batteries: toward practical use. ChemElectroChem 2 (2015) 1917-20.
[41] J. Wang, S. Kaskel, KOH activation of carbon-based materials for energy storage. J Mater Chem 22 (2012) 23710-25.
[42] P. Suhas, P.M. Carrott, M. Carrott, Lignin - from natural adsorbent to activated carbon: A review. Bioresource Technology 98 (2007) 2301-12.
[43] E. Lotfabad, J. Ding, K. Cui, A. Kohandehghan, P. Kalisvaart, M. Hazelton, et al., High-density sodium and lithium ion battery anodes from banana peels. ASC Nano 8 (2014) 7115-29.
[44] M. Dahbi, M. Kiso, K. Kuboto, T. Horiba, T. Chafik, K. Hida, et al., Synthesis of hard carbon from argan shells for Na- ion batteries. J Mater Chem A 5 (2017) 9917-28. [45] S. Qiu, L. Xiao, M. Sushko, K. Han, Y. Shao, M. Yan, et al., Manipulating
adsorption-insertion mechanisms in nanostructured carbon materials for high-efficiency sodium ion storage. Adv Energy Mater 7 (2017) 1700403.
[46] X. Dou, I. Hasa, D. Saurel, C. Vaalma, L. Wu, D. Buchholz, et al., Hard carbons for sodium-ion batteries: Structure, analysis, sustainability, and electrochemistry. Materials Today 23 (2019) 87-103.
[47] H. Hou, X. Qiu, W. Wei, Y. Zhang, X. Ji, Carbon Anode Materials for Advanced Sodium-Ion Batteries. Adv Energ Mater 1602898 (2017) 1-30.
[48] D. Saurel, B. Orayech, B. Xiao, D. Carriazo, X. Li, T. Rojo, From Charge Storage Mechanism to Performance: A Roadmap toward High Specific Energy Sodium-Ion Batteries through Carbon Anode Optimization. Adv Energy Mater 1703268 (2018). [49] D. Stevens, J.R. Dahn, The mechanisms of lithium and sodium insertion in carbon
materials. J Electrochem Soc 148 (2001) A803-A811.
[50] Y. Cao, L. Xiao, M. Sushko, W. Wang, B. Schwenzer, J. Xiao, et al., Sodium ion insertion in hollow carbon nanowires for battery applications . Nano Lett 12 (2012) 3783-7.
[51] J. Ding, H. Wang, L. Zhi, A. Kohandehghan, K. Cui, Z. Xu, et al., Carbon nanosheet frameworks derived from peat moss as high performance sodium ion battery anodes. ACS Nano 7 (2013) 11004-15.
[52] C. Bommier, T. Surta, M. Dolgos, X. Ji, New mechanistic insights on Na-ion storage in nongraphitisable carbon. Nano Lett 15 (2015) 5888-92.