HAL Id: insu-02635794
https://hal-insu.archives-ouvertes.fr/insu-02635794
Submitted on 2 Jun 2020HAL is a multi-disciplinary open access archive for the deposit and dissemination of sci-entific research documents, whether they are pub-lished or not. The documents may come from teaching and research institutions in France or abroad, or from public or private research centers.
L’archive ouverte pluridisciplinaire HAL, est destinée au dépôt et à la diffusion de documents scientifiques de niveau recherche, publiés ou non, émanant des établissements d’enseignement et de recherche français ou étrangers, des laboratoires publics ou privés.
Vertical TEC over seismically active region during low
solar activity
Elvira Astafyeva, Kosuke Heki
To cite this version:
Elvira Astafyeva, Kosuke Heki. Vertical TEC over seismically active region during low solar activ-ity. Journal of Atmospheric and Solar-Terrestrial Physics, Elsevier, 2011, 73 (13), pp.1643-1652. �10.1016/j.jastp.2011.02.020�. �insu-02635794�
Instructions for use
Title Vertical TEC over seismically active region during low solar activity
Author(s) Astafyeva, Elvira; Heki, Kosuke
Citation Journal of Atmospheric and Solar-Terrestrial Physics, 73(13), 1643-1652https://doi.org/10.1016/j.jastp.2011.02.020
Issue Date 2011-08
Doc URL http://hdl.handle.net/2115/46924
Type article (author version)
File Information AstafyevaHeki_JATP.pdf
Vertical TEC over seismically active region during low solar activity
Elvira Astafyeva1,2 and Kosuke Heki3
1 – Institut de Physique du Globe de Paris (UMR 7154 – CNRS – Université Paris Diderot), Equipe Geophysique Spatiale et Planétaire, 4,Avenue de Neptune, Saint Maur des Fossés, 94107, France ; email: [email protected] ; tel: +33-145114182
2 - Institute of Solar-Terrestrial Physics SB RAS, 126, Lermontova street, 664033, Irkutsk, Russian Federation 3 - Hokkaido University, Department of Natural History Sciences, N10W8, Kita-ku, Sapporo, 060-0810, Japan; email: [email protected]
Abstract
Using data of Japanese dense array of GPS receivers (GEONET) we analyzed variations of total electron content (TEC) over Japan during a period of lowest solar and geomagnetic activity in April-September 2008. During that time, five large earthquakes with magnitude M>6.8 occurred around the Japanese Islands. We calculated vertical TEC with time resolution 1 hour and we compared the TEC over Japan with TEC over southwestern USA. In order to detect abnormal signals, we processed daily TEC based on median and quartile of preceding 15 days. Knowing that the decisive role in the ionosphere state is performed by space weather effects, we compared the estimated TEC values with time series of the Bz component of the interplanetary magnetic field (IMF), UV solar radiation, index
of geomagnetic activity Dst and planetary index Kp. We have found that though the analyzed time period falls on the minimum of solar activity, the observed positive anomalies in the regional TEC correspond to fluctuations of IMF Bz and to the following increase in Kp and Dst indices. Other case
of ~25% TEC increase of duration of four days (DOY: 140-143) is, most likely, caused by increase in the solar UV radiation and coincides with growth of the global TEC. Other positive or negative abnormal TEC variations coincide with fluctuations of the global mean TEC or are of large spatial scale, i.e. much larger than the earthquake preparation zone. Therefore, it is rather difficult to find correlation between the observed anomalies and the five large earthquakes. Our results do not disprove the possibility of precursory phenomena but show the difficulties in identifying earthquake precursors in the ionosphere TEC on the background of TEC changes produced by space weather effects, even during solar minimum.
Keywords: vertical TEC, ionosphere, seismo-ionosphere relation, low solar activity, IMF Bz 1. Introduction
The Earth’s ionosphere is known to be an irregular medium whose state is mainly determined by the solar radiation (Akasofu, Chapman, 1972). Apart from the well pronounced solar-driven variations (27-day variations (e.g., Afraimovich et al, 2008), 180-day and annual variations (e.g,, Kakinami et al., 2009), the ionosphere reflects dynamics of thermosphere and occurrence of a variety of geophysical phenomena like planetary waves, atmospheric and lunar tides, etc. Storm-driven ionosphere changes are known to be of largest amplitude. At solar maximum and during rising and falling parts of solar cycle there occur numerous geomagnetic storms that increase the amplitude of background ionospheric variations. Therefore, study of the ionosphere during low solar activity is very important as it may show us clearer the occurrence of phenomena others than of solar and geomagnetic origin.
Pre-seismic ionosphere alterations are one of such “smaller-amplitude” phenomena that can be masked by high solar or geomagnetic activity. It was reported that large earthquakes are often preceded by signals of different nature: electric, magnetic, electromagnetic, luminous etc. (e.g., Gokhberg et al., 1982, Parrot and Lefeuvre, 1985). Some of these signals can propagate into the ionosphere and generate variations of the ionosphere parameters such as critical plasma frequency f0F2,
virtual height hmF2 and of the ionospheric total electron content (TEC). The mechanism of appearance
of the ionospheric anomalies includes direct coupling between the Earth’s surface and the lower ionosphere through electric current (e.g., Pulinets et al., 2000), and triggering of atmospheric gravity waves by gas releases or thermal anomalies (Shalimov, 1992a, 1992b; Gokhberg et al., 1994, 1996;
Pertsev and Shalimov, 1996; Molchanov and Hayakawa, 2001; Shvets et al., 2004). Thereby, at present, pre-seismic ionosphere anomalies seem to be well analyzed, and discussed in numerous papers (e.g., Pulinets, 1998; Pulinets et al., 2003, Pulinets and Boyarchuk, 2004; Liu et al., 2001, 2004, 2006; Zakharenkova et al., 2007).
In particular, Liu et al. (2000, 2001) found decrease of f0F2 and TEC from 1 to 6 days prior to
the 1999 Chi-Chi earthquake in Taiwan (M7.7). Pulinets et al. (2004) reported TEC decrease the day preceding the San Simeon earthquake of 22 December 2003 that occurred in central California, USA. Later, Liu et al. (2006) investigated the relationship between variations of the plasma frequency at the ionospheric F2 peak f0F2 and 184 earthquakes with magnitude M > 5.0 during 1994-1999 around the
Taiwan area. The pre-earthquake ionospheric anomalies, defined as the abnormal decrease more than ~25% in the ionospheric f0F2 during the afternoon period, 1200-1800 LT, occurred within five days
before the earthquakes. More recently, Liu et al. (2009) have analyzed TEC variations before the 12 May 2008 Wenchuan Earthquake (M7.9) by using global ionosphere maps (GIM), and have found that TEC above the forthcoming epicenter anomalously decreased in the afternoon period four to six days before the earthquake, and in the late evening period three days before the earthquake. They also reported that TEC anomalously enhanced in the afternoon three days before the Wenchuan earthquake.
At the same time, as the Earth’s ionosphere is characterized by diurnal, seasonal or latitudinal natural fluctuations, sometimes it is difficult to identify pre-seismic effects out of the background ionosphere variability and of alterations produced by high solar or geomagnetic activity. Afraimovich and Astafyeva (2008) have shown that decrease and/or increase of the local ionosphere TEC, which can be taken as pre-seismic signals, often reflect global changes of the ionization caused by the 27-day variations along with other fast alterations by solar and geomagnetic activities. Apart from that, it should be taken into account that parameters of the interplanetary medium, such as interplanetary magnetic field (IMF), play an important role in variability of ionosphere parameters (e.g., Astafyeva, 2009). Therefore, the key problem is to distinguish the ionosphere changes caused by enhanced pre-seismic activity from those by various phenomena of “space” origin. Whether the ionospheric anomalies that we observe in the area of future epicenter arrive down from space or they come up from the lithosphere? With time, this question becomes quite a controversial point for scientists.
Pulinets et al. (2007) have proposed a special index of the ionosphere variability, which is sensitive to the pre-earthquake variations and much less sensitive to the magnetic storm variations. Studies of correlation between the records of GPS receivers in different areas showed that in a majority of cases the correlation coefficient grows during geomagnetic disturbances. However, before earthquakes, the correlation coefficient drops within about a 700-kilometer diameter around the earthquake epicenter. In particular, Pulinets et al., (2004) showed that a few days before the California's 16 October 1999 Hector Mine earthquake (M 7.1) the variability index was higher than the index during strong (Dst ~ -250 nT) geomagnetic storms. At the same time, analysis of the same 1999 Hector Mine earthquake by Afraimovich et al. (2004) showed that the behavior of TEC was rather controlled by the local time and by fairly moderate geomagnetic activity than by the earthquake preparation.
Dautermann et al. (2007) have investigated ionosphere TEC variations before the San Simeon (22 December 2003, M 6.6) and Parkfield (29 September 2004, M 6.0) earthquakes in Southern California, using the dense network of 256 continuous GPS stations centered in Los Angeles basin. TEC time series averaged over the entire network were found to be dominated by diurnal (24 hours) and semidiurnal (12 hours) periods reflecting daily solar activity and lunar tides. It has also been found that the period surrounding the San Simeon earthquake suffered from significant space weather effects, so that the precursory event reported by Pulinets et al. (2004), most likely, was an artifact resulting from the enhanced space weather activity.
Apart from the dominating influence of solar and geomagnetic activity, the research of ionosphere precursors of earthquakes is complicated by the shortness of analyzed time intervals which are usually limited to some number of days before earthquakes. Thus, some anomalies, e.g. those by planetary waves, can appear in the ionosphere periodically, and therefore analyses through insufficient
time windows can lead to wrong conclusions about ionosphere pre-seismic alterations (Rishbeth, 2006).
In this study, we analyze behavior of vertical TEC over Japan during seismically active period in April-September 2008 by taking advantage of the high spatial resolution provided by GEONET. For our analysis we take a period of ~160 days that is long enough to exclude ionosphere TEC changes caused by planetary waves which have periods of ~2, 5, 10, 16 days (Pancheva at al., 1991; Shalimov, 2001; Lastovicka, 2009) along with other kinds of non-pre-seismic variability. Note that the mentioned period falls on the minimum of solar activity, so that the space weather influence was minimum at that time. Moreover, analysis of solar and geomagnetic activity from 2005 to 2010 showed that the selected period of time belongs to the quietest interval for the last five years. All these facts give us a unique opportunity for search of TEC anomalies possibly connected with pre-seismic activity. A special feature of this paper lies in the idea to analyze the ionosphere over seismically active region as it is, i.e. without selection of a certain number of days before/after an earthquake. This is the first study of such kind performed with GEONET.
2. Methods of Data Processing: Estimation of Vertical TEC from GPS Data
GPS ionospheric sounding is known to be one of the most powerful tools for remote sensing of the ionosphere. The dispersive nature of the ionosphere lets dual frequency GPS measurements (1.2 and 1.5 GHz) provide integral information by the carrier phase differences at ground-based receivers. Methods of TEC calculation have been described in detail in a number of papers (e.g., Calais and Minster, 1995; Afraimovich et al., 2001). Slant TEC is expressed as follows:
, (1) where L1λ1 and L2λ2 are additional paths of the radio signal caused by the phase delay in the
ionosphere, (m); L1 and L2 represent the number of phase rotations at the frequencies f1 and f2; λ1 and
λ2 stand for the corresponding wavelengths, (m); const is unknown initial phase path, caused by the
unknown number of total phase rotations along the line-of-sight (LOS); and nL are errors in determining the phase path; constant 40.308 has the dimension (m3/s2). For convenience, TEC is usually measured in TEC units, TECU (1 TECU = 1016 m-2). Since TEC is an integral parameter, it is impossible to determine the height of TEC disturbance. However, the main contribution to TEC variations would occur around the height of the maximum ionization. This allows us to consider the ionosphere as a thin layer located at the height hmax of the ionosphere F2 layer, and TEC represents a
point of intersection of a line-of-sight with the thin layer. In this study we assumed hmax as 300 km.
We estimated site-specific vertical TEC and the satellite-specific constant biases (sum of the third and the forth terms in parenthesis of equation 1) using least-squares method. We assumed vertical TEC (VTEC) as the product of slant TEC (STEC) and cosine of the zenith angle Z, an angle between LOS and local zenith at the ionospheric penetration points (IPP), i.e.
STEC(t) = VTEC(t) / cosZ + const (2) Because the constant does not depend on elevation angles, we can separate these two parameters (VTEC and the constant) by observing GPS satellites at various elevations. To avoid arbitrary discontinuities at day boundaries, we concatenated raw GPS observation data files of three consecutive days, and assumed that the constant in (2) does not change over the three days period. We let VTEC change continuously (i.e., without jumps) throughout the period as lines with hourly breaks in slopes (piecewise linear function). We also assumed that ionospheric TEC are locally frozen in the space in short time scales and converted the differences in longitude of IPP into the temporal difference in TEC If IPP is 15 degrees to the west of the GPS station, we treat the STEC there as VTEC one hour ahead in time (i.e., we assume slightly different t at the right and left sides of the equation 3). Then we extract
VTEC changes in the middle day, move the window one day ahead. By repeating this process, we finally get time series of VTEC above a particular GPS receiver. In this work we calculated vertical TEC above 50 GPS sites of the Japanese dense Network of GPS receivers GEONET (Fig. 1).
To detect abnormal signals of the GPS TEC variations, we performed data analysis similar to Liu et al. (2009). For each moment of time we computed the median M using the TEC values at the same local time for the preceding 15 days. We obtained the deviation of the observed TEC from the computed median, and then calculated the first (or lower) and the third (or upper) quartiles, denoted by LQ and UQ, respectively. It should be noted that under the assumption of a normal distribution with mean m and standard deviation σ for the GPS TEC, the expected value of M and LQ or UQ are m and 1.34σ, respectively (Klotz and Johnson, 1983). To have stringent criterion, we set the lower bound, LB=M-1.5(M-LQ) and UB=M+1.5(UQ-M). Therefore, the probability of a new GPS TEC in the interval (LB, UB) is approximately 65%. The median together with the associated LB and UB then provide references for the GPS TEC variations on the day in question. Thus, when an observed GPS TEC on that day is greater or smaller than the median of the previous 15 days by UB or LB, we consider it as an upper or lower abnormal GPS TEC value.
In order to understand spatial scale of the detected abnormal TEC, we conducted spatial analyses. For this purpose we used data of GIM (CODE). For each grid point and time moment we computed the median TEC for the preceding 15 days. We further calculated the difference between the observed TEC value and the associated median. Thus, the median represents the undisturbed background TEC value, whereas negative or positive deviations indicate reduction or enhancement, respectively.
3. Observations
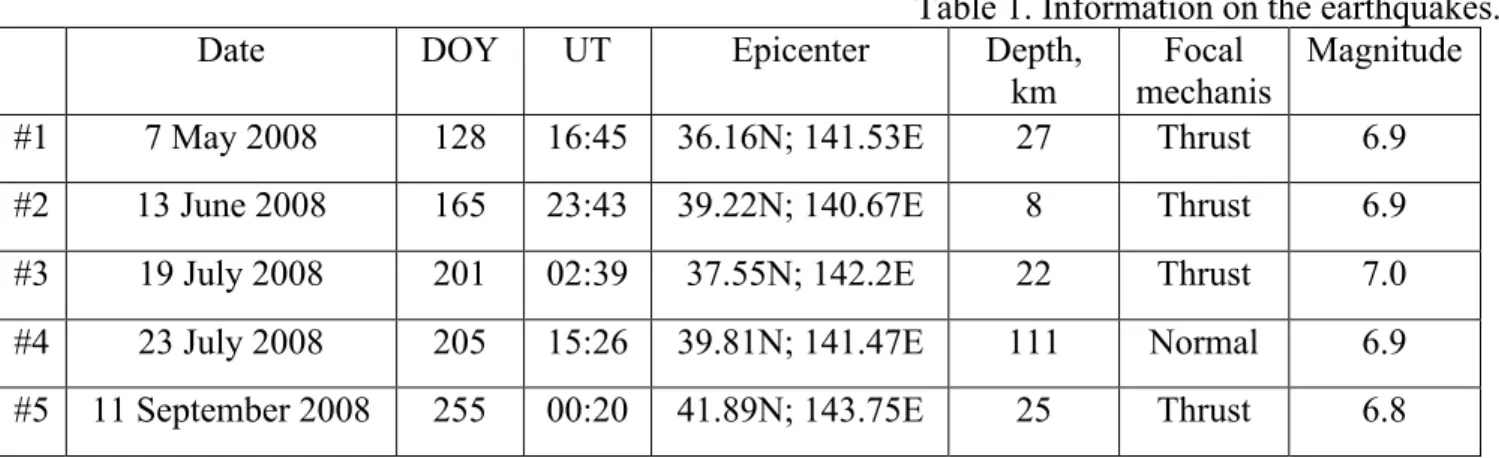
During the period from 111 to 269 DOY 2008, five large earthquakes with magnitudes from 6.8 to 7.0 occurred around the Tohoku and Hokkaido regions of Japan (http://earthquake.usgs.gov, Fig.1, Table 1).
Table 1. Information on the earthquakes.
Date DOY UT Epicenter Depth,
km
Focal mechanis
m
Magnitude #1 7 May 2008 128 16:45 36.16N; 141.53E 27 Thrust 6.9 #2 13 June 2008 165 23:43 39.22N; 140.67E 8 Thrust 6.9 #3 19 July 2008 201 02:39 37.55N; 142.2E 22 Thrust 7.0 #4 23 July 2008 205 15:26 39.81N; 141.47E 111 Normal 6.9 #5 11 September 2008 255 00:20 41.89N; 143.75E 25 Thrust 6.8
As seen from Fig.1 and Table 1, events #1, #3, #5 (DOY 128, 201, 255) are off shore events whereas events #2 (DOY 165, M6.9) and #4 (DOY 205, M6.9) are inland ones. It has been proposed that pre-seismic anomalies can appear within an area called the radius of earthquake preparation area of the lithosphere (“strain circle”) that scales with magnitude M of an earthquake as ρ=100.43M km (e.g., Dobrovolsky et al, 1979). For M6.8-M7.0 earthquakes this parameter is about 900-1100 km, so that all the territory of Japan can be considered as earthquake preparation area.
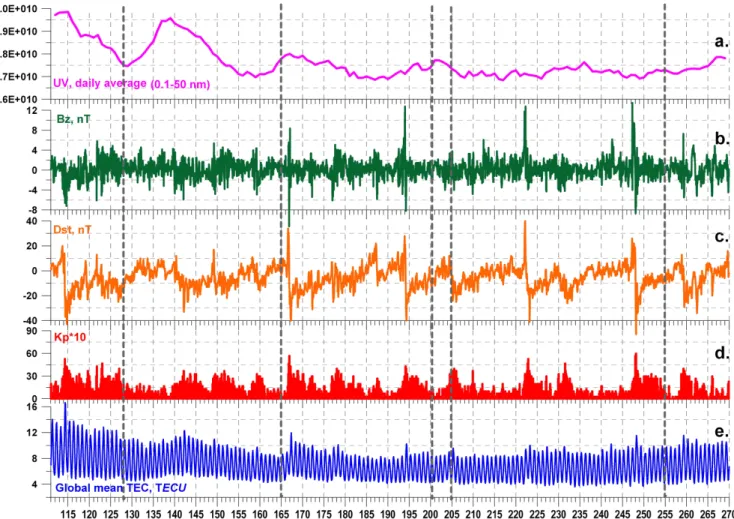
Variations of solar-geophysical parameters during April-September 2008 are presented in Fig. 2 (a-d). Fig. 2e shows fluctuations of global mean TEC that we calculated from global ionosphere maps (GIM, available from ftp://ftp.unibe.ch/aiub/CODE/) by summation of the absolute vertical TEC values for every GIM cell and divided by the total number of GIM cells (Afraimovich et al., 2008). During the analyzed time interval there are no large or moderate geomagnetic storm observed but, despite the minimum of solar activity cycle, there occurred at least four sufficiently large Bz negative
sudden short-term Bz increase occurred on 222 day. These Bz events coincide in time with sharp
variations in Dst and Kp values (Fig. 2 c, d). Apart from variations of geophysical parameters, there observed two substantial peaks in the intensity of the solar UV radiation on 110-112 and 136-139 days (Fig. 2a), which may cause increase in daily TEC values 4-5 days later (e.g., Afraimovich et al, 2008). Another smaller spike in the intensity of the UV flux occurred on 120-123 days. Therefore, from this figure, we can expect effects of UV flux increase in the ionosphere TEC on 114-116 days and from 140 to 144 days. Indeed, such peaks in the global mean TEC are seen in Fig. 2e. Increase of global TEC from 122 to 125 is, most likely, related to the spike of UV on 120-123 days. Other significant enhancements of global TEC correspond to the mentioned Bz -negative events of 167,194 and 248
days and to Bz -positive event of 222 day.
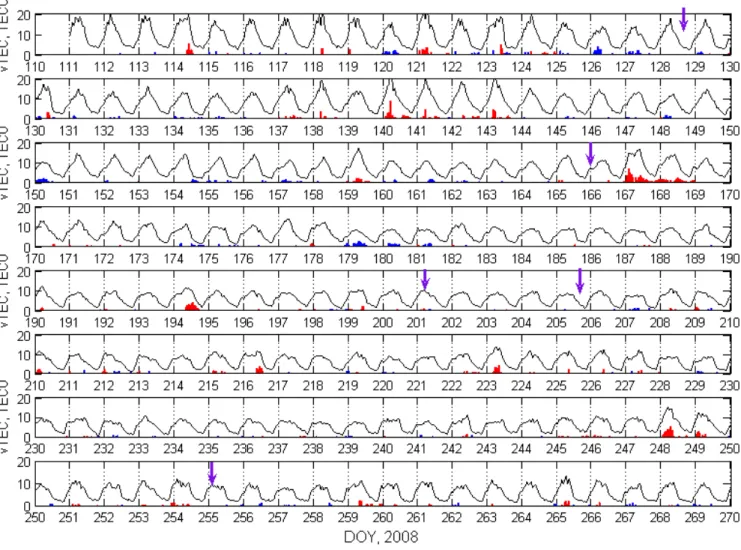
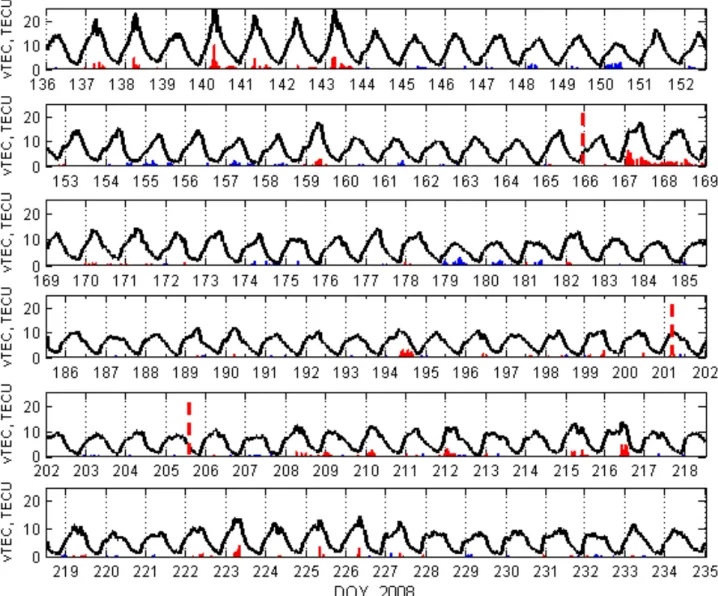
Figure 3 displays average vertical TEC derived from 50 GPS receivers of GEONET from 111 to 269 days (from 20 April to 25 September) of 2008 and TEC “anomalies”. Large positive anomalies of 25-40% (red bars) appeared on 114, 121, 123, 140-143, 167-168, 194, 223, 248 days. However, comparing Fig. 2 and Fig.3, we conclude that all these large-amplitude anomalies are of space weather origin. Thus, the abnormal increase of daytime TEC on 140-143 days occurred due to the increase of the UV solar flux, whereas the substantial and long-lasting TEC increase on 167-168 days appeared to be the response to Bz negative event and to the following moderate geomagnetic storms with minimal
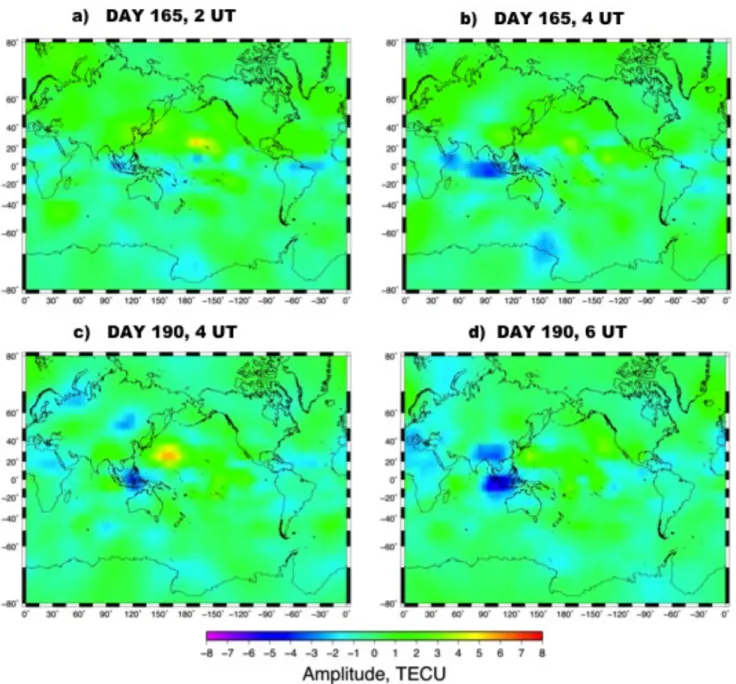
Dst value of -40 nT and Kp index value of 5. Somewhat smaller positive TEC anomalies of 194, 223 and 248 days correspond to the periods of enhanced geomagnetic activity as well. It is interesting to note that these anomalies appeared ~27-29 days one after another, i.e. with the period of solar spin. There are also small-amplitude positive TEC anomalies of duration of 2-4 hours: in the morning on 159, 165 and 190 day and in the evening on 177 day. Detailed comparative analysis shows that the anomalous TEC increase of 159 day is correlated with a jump of ~1 TECU in the value of global mean TEC. At the same time, IMF Bz decreased to -6 nT and Dst index dropped to -15 nT. Apparently, such little variations of IMF were enough to cause the following fluctuations of geophysical indices and changes in the global TEC. Similar conclusion can be done for the anomaly of 177 day that coincides with growth of global mean TEC for ~1.5 TECU (fig. 2). The anomalies of 165 and 190 days have no apparent correlation with changes of global TEC or interplanetary and geophysical indices. Therefore, they are “local” anomalies, i.e. appear only around Japan, and their spatial scale should be further analyzed in more details by plotting maps of differential TEC (Fig.4-7). Fig. 4a and 4b do not reveal any discernible TEC enhance over Japan, but it shows that the value of TEC at 2-4 UT ~3 TECU exceeded the median value within a very large area. The anomaly of 190 day that occurred at 4-6 UT over Japan is a part of a larger area of high TEC centered at ~(25°N; 160°E) (Fig. 4c,d).
Apart from the positive anomalies, we also observed small-amplitude negative anomalies (blue bars in Fig. 3): in the morning on 126-127, 150, 157, 179-181, 207, 232 days, in the afternoon on 154 day and in the evening on 218 day. The TEC decrease occurred on 126-127, 157 and 207 days coincides with decrease of the global mean TEC, whereas for the other anomalies we do not find correlation with global TEC variations or with other parameters in Fig. 2. However, it is rather difficult to confirm causal relationships of the observed negative anomalies with pre-earthquakes phenomena, since these anomalies, apart from the space weather and forcing from above, can be caused by forcing from below by thermosphere, atmospheric meteorology-driven influences, tides, gravity and planetary waves etc. Thus, before claiming the connection of the anomalies with earthquakes, the locality of these anomalies should be analyzed.
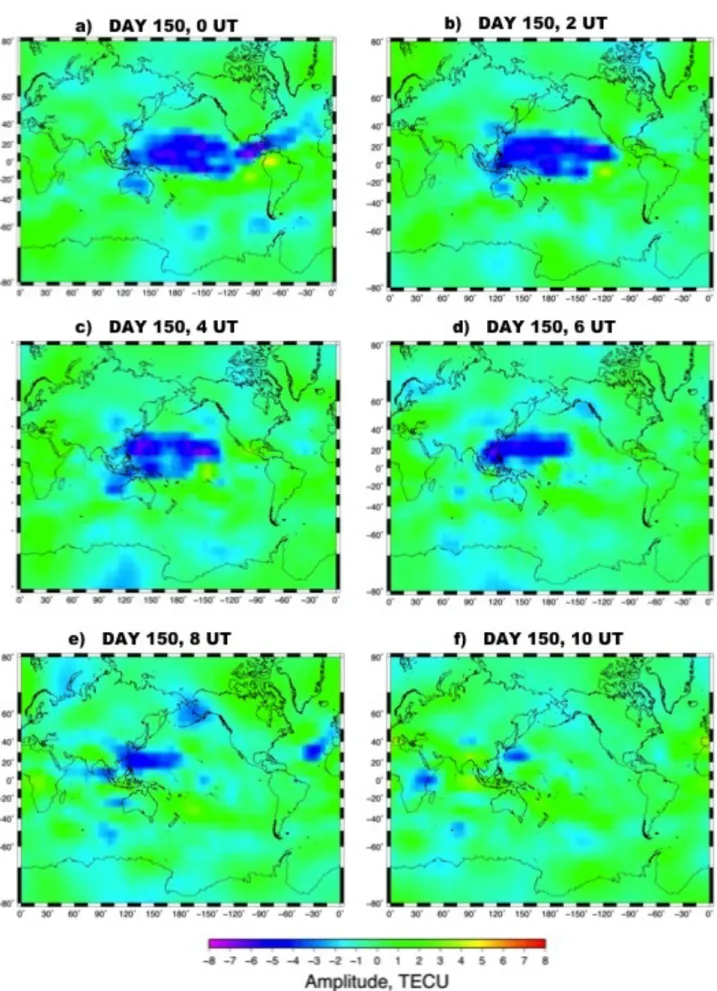
Fig. 5 shows the differential TEC maps for day 150, from 0 to 10 UT. At 0 UT we can see a huge-amplitude and largely spatially spread TEC depletion that is stretched for the whole sunlit side of the Earth, with maximum value of TEC ~8 TECU in the local evening (~18-19 LT). Note, that this TEC depletion is confined within ±20° of latitude (Fig.5a) and, most likely, it was caused by the proper dynamics of the low-latitude ionosphere. Then, the anomaly that we see in Japan presents a part of a huge “cloud” of negative TEC. Two hours later, the anomaly lessens in both magnitude and spatial scale. By 4 UT, the anomaly further fades and diminishes more noticeably by 6-8 UT, remaining centered along +20° N (Figs. 5b-e). The depletion almost disappears by 20 LT. (10 UT, Fig. 5f)
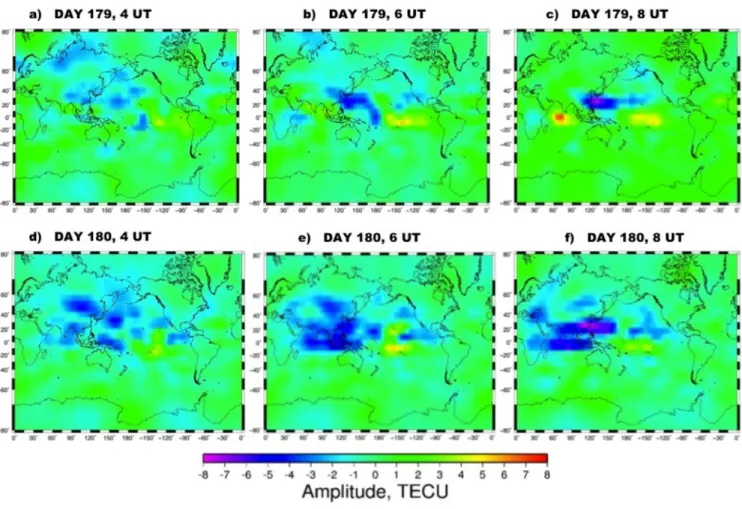
Fig. 6 demonstrates the differential TEC maps for 179 day (a-c) and 180 day (d-f), both from 4 to 8 UT. Although Japan is covered by the ionization depletion, these negative anomalies are widely spread, i.e. the observations by GEONET reflect just a part of the large-scale TEC redistribution. Because the spatial scales of the observed anomalies are much larger than the earthquake’s preparation area, it is rather difficult to claim any geophysical relevance between the TEC anomalies and the earthquakes.
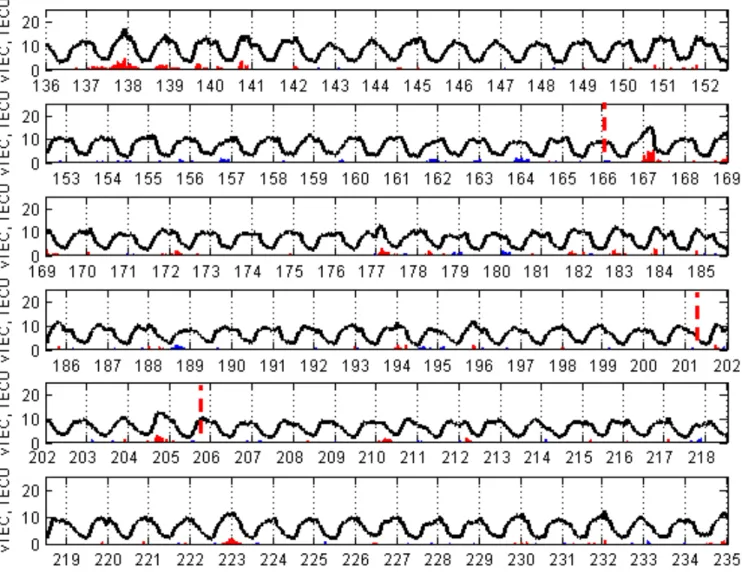
In order to additionally check the spatial occurence of the observed anomalies, we calculated vertical TEC in the area of the same geomagnetic latitudes as the epicentral area of the five considered earthquakes. As a “check”-region we took the area (34-40ºN; 237-248ºE) in southwestern USA and we performed the same sort of data processing in order to reveal anomalous TEC changes (Fig. 7). It should be noted that the difference in local time between Japan and western USA is -18 hours, so that we expect the anomalies to be time-shifted in these two regions with respect to each other. Fig. 7 confirms the stated above conclusions on the global character of the majority of the found TEC anomalies. We observe sufficiently large TEC enhancements on 114-115, 117-118, 137-140, 167, 204, 210, 223 days and TEC depletions on 124, 127, 156, 161, 164, 178, 180, 188, 217, 249-250 days. Most of these anomalies appear within the area of earthquake preparation (Fig. 3). Note that the mentioned above large-amplitude anomaly of 194 and 248 days in Japan are quite small in data series of Fig.8. The Bz negative event started at 5 UT (15 LT in Japan and 20 LT in the Californian region) and lasted
for 3 hours. It is known that TEC increase starts about 3 hours after the IMF Bz turns southward
(Astafyeva, 2009). Therefore, we could expect the dayside TEC to grow from 8 UT.
Maps of differential TEC for 194 day show TEC enhancements around the area of Japan (Fig. 8). The amplitude of the anomaly reaches its maximum by 10-12 UT (Fig. 8b-c). It is obvious that the observed increase of TEC over Japan reflects and is a part of the TEC enhancement of much larger spatial scale than the area of the earthquake’s preparation. We observe TEC increase in the whole sunlit side of the Earth and this increase is located within 20-30°N. Such phenomena are caused by the storm-time dynamics of the EIA and reinforcement of the fountain effect as a reaction to Bz negative
events (e.g., Astafyeva, 2009). From 14 UT the value and the spatial scale of differential TEC decrease (Fig.8d), so that this anomaly does not reach the western coast of North America, i.e. the check-region. Similar situation was observed for the event of 248 day.
4. Conclusions
Using data of GEONET we have analyzed vertical TEC over Japan during seismically active period in April-September 2008. Although we did observe abnormal positive and negative TEC signatures, it is rather difficult to find correlation between the anomalies and the five large earthquakes that occurred in Japan in May-August 2008.
Though the studied period can be characterized as a period of lowest solar and geomagnetic activity from 2005 to 2010, the observed large positive regional TEC anomalies were found to correspond to variations of solar flux and interplanetary magnetic field parameters. For instance, anomalous ~20% augmentation of VTEC of 114, 121 and 123 days correspond to surges in solar UV flux. Other example of ~25% increase in dayside TEC that started on 140 day and lasted for four consecutive days, was also caused by the a surge of the UV radiation. These anomalies coincided with the growth of the global TEC. Noticeable VTEC enhancements of 167-168, 194, 223 and 248 days occurred shortly after the fluctuations of the intensity of the IMF Bz and the following changes in Kp
and Dst indices. It is known that reconnection between intensive southward IMF Bz and the Earth’s
magnetic field leads to appearance of strong dawn-to-dusk electric field that moves the equatorial F-region plasma upward and enhances the fountain effect (Tsurutani et al., 2004). Thus, sharp drop of the IMF Bz down to -30-40 nT leads to drastic growth of TEC within the EIA along with displacements of
the EIA crests to ±30° of magnetic latitude (e.g., Tsurutani et al., 2004; Astafyeva et al., 2007; Astafyeva, 2009). Here we show that a drop of the IMF Bz down to -5-7 nT is enough to produce
~20-30% excess of regional VTEC over the 15-day median values. Global maps of differential VTEC allow tracking the peculiarities of the spatial response to such “small-amplitude” IMF Bz events. From
figures 2, 3 and 5, it is seen that VTEC increment starts ~3 hours after the Bz turned southward, the
maximum changes occurred within the equatorial latitudes in the evening longitudinal sector.
Other than of space weather origin, the observed negative and small-amplitude positive anomalies were found to be of a large spatial scale, so that they covered not only the area above the future earthquakes. Therefore, it is hardly that those anomalies were caused by the earthquakes’ preparation processes, but, most likely, they were associated with the ionospheric “natural” variability by thermosphere, stratosphere (Goncharenko et al., 2010), tidal effects, changes in neutral composition etc.
Special attention should be paid on the periodicity in the appearance of the anomalies, both positive and negative. It is important to cut out the influence of such periodical phenomena as solar rotation, planetary waves or tides, so that periodical abnormal signals could not be mistakenly taken as precursory signals. For instance, the large-amplitude positive anomalies of 114, 140-142, 167, 194, 223, 248 days occur with period ~26-29 days one after another. The fact of appearance of TEC increase with the period of solar rotation confirms the involvement of the Sun in these anomalous enhancements. The same range of periodicity is observed in occurence of negative anomalies on 150, 179-181, 207 and 232 days. Other periods in appearance of TEC anomalies can be caused by planetary waves which have periods of ~2, 5, 10, 16 days (Pancheva et al., 1991; Shalimov, 2001; Lastovicka, 2009).
Focal mechanism of a future earthquake could possibly influence the enhancement of pre-seismic activity in the near-epicentral area. The five mentioned earthquakes are of different focal mechanisms – the earthquakes of 128, 165, 201 and 255 days are thrust type whereas the earthquake of 205 day is normal fault. However, we did not see any specific peculiarities before these events. The location of the earthquakes’ hypocenters (inland for 165 and 205 days and underwater for 128, 201 and 255 days) does not seem to change our conclusion either.
This study does not corroborate previous works on ionosphere precursors of earthquakes and it does not disprove the possibility of the existence of precursory phenomena. Our work demonstrates the difficulties of searching the earthquake precursors in the ionosphere TEC, in particular, with the help of GPS. It should be noted that earthquake #2 (DOY 165, M6.9) was the largest inland earthquake occurred in Japan since the dense GPS array was deployed. Moreover, a period of low solar activity means small observational noises from space weather effects, so that appearance of some pre-earthquakes signatures in the ionosphere could be expected. Absence of clear precursory signals in TEC for this earthquake may suggest that the monitoring of TEC could not be practical for short-term earthquake predictions even if such precursors exist. Generally speaking, TEC is an integral parameter of the ionosphere that makes it impossible to localize the height of an ionosphere disturbance. On the other hand, GPS is a powerful tool to study the ionosphere since it provides continuous TEC measurements and good spatial coverage. Creation of precise maps of ionospheric vertical TEC along with good time resolution would perhaps give more information about the background short-time TEC changes that is of high importance and should be quite useful for the issue of ionospheric precursors of earthquakes. This study makes a step towards better understanding of background TEC variations during a period of low solar activity and of high seismic activity and of use of GPS for such purposes.
5. Acknowledgements
A part of this study was performed while EA had worked at Hokkaido University as JSPS PostDoctoral Fellow (Fellowship by the Japanese Society for the Promotion of Science). EA acknowledges support of CNES for the PostDoc position during which this work was finalized. This is IPGP contribution N°XX.
6. References
1. Akasofu, S.I., Chapman, S., 1972. Solar-Terrestrial Physics. Pergamon, Oxford, 512 pp.
2. Afraimovich E.L., N.P. Perevalova, A.V. Plotnikov and A.M. Uralov,2001. The shock-acoustic waves generated by the earthquakes, Ann. Geophys., 19(4), 395-409.
3. Afraimovich E.L., E.I. Astafieva, M.B. Gokhberg, V.M. Lapshin, V.E. Permyakova, G.M. Steblov, and S.L. Shalimov, 2004. Variations of the total electron content in the ionosphere from GPS data recorded during the Hector Mine earthquake of October 16, 1999, California. Russian Journal of Earth Sciences, 6(5), 339-354.
4. Afraimovich, E.L., E.I. Astafyeva, I.V. Zhivetiev, Yu.V. Yasukevich, and A.V. Oinats, 2008. Global electron content: a new conception to track solar activity, Ann. Geophys., 26, 335-344. 5. Afraimovich, E.L., E.I. Astafyeva, 2008. TEC anomalies -- local TEC changes prior to earthquakes
or TEC response to solar activity changes? Earth, Planets, Space, 60, 961-966.
6. Astafyeva E.I., Afraimovich E.L., Kosogorov E.A., 2007. Dynamics of total electron content distribution during strong geomagnetic storms, Adv. Space Res., V.39, 1313-1317.
DOI:10.1016/j.asr.2007.03.006
7. Astafyeva, E., 2009. Effects of strong IMF Bz southward events on the equatorial and mid-latitude
ionosphere, Ann. Geophys., 27, 1175-1187.
8. Calais, E., J.B. Minster, 1995. GPS detection of ionospheric perturbations following the January 17, 1994, Northridge earthquake, Geophys. Res. Lett., 22 (9), 1045-1048.
9. Dautermann,T, E. Calais, J. Haase and J. Garrison, 2007. Investigation of ionospheric electron content variations before earthquakes in southern California, 2003–2004, J. Geophys. Res., 112, B02106, doi:10.1029/2006JB004447.
10. Dobrovolsky, I.P., Zubkov, S.I., and Miachkin, V.I., 1979. Estimation of the size of earthquake preparation zones, Pure Appl. Geophys., 117, 1025-1044.
11. Gokhberg, M.B., Morgounov, V.A., Yoshino, T. and Tomizawa, I., 1982. Experimental
measurement of electromagnetic emissions possibly related to earthquakes in Japan, J. Geophys. Res., 87, 7824-7828.
12. Gokhberg M.B., Nekrasov A.K., Shalimov S.L., 1994. A new approach to the problem of the lithosphere-ionosphere coupling before the earthquakes. Electromagnetic Phenomena related to earthquake prediction. Ed. by M.Hayakawa and Y.Fujinawa. Terra Sci. Publ.Co., Tokyo, 619-625. 13. Gokhberg M., Nekrasov A., Shalimov S., 1996.On influence of unstable greenhouse gas outflow in
seismically active region upon the ionosphere, Physics of the Solid Earth, 8, 52-55 (in Russian). 14. Goncharenko, L. P., J. L. Chau, H.-L. Liu, and A. J. Coster (2010), Unexpected connections
between the stratosphere and ionosphere, Geophys. Res. Lett., 37, L10101, doi:10.1029/2010GL043125.
15. Kakinami, Y., C. H. Chen, J. Y. Liu, K.-I. Oyama, W. H. Yang, and S. Abe, 2009. Empirical models of Total Electron Content based on functional fitting over Taiwan during geomagnetic quiet condition. Ann. Geophys., 27, 3321-3333.
16. Klotz, S., N.L. Johnson (Ed.), 1983. Encyclopedia of Statistical Sciences, John Wiley, Hoboken, N.J.
17. Lastovicka, J. Lower ionosphere response to external forcing: A brief review, 2009. Adv. Space Res., 43, 1-14.
18. Liu, J. Y., Chen, Y. I., Pulinets, S. A., Tsai, Y. B and Chuo, Y. J., 2000. Seismo-ionospheric signatures prior to M≧6.0 Taiwan earthquakes, Geophys. Res. Lett., 27, 3113-3116.
19. Liu, J.Y., Chen, Y.I., Chuo, Y.J., Tsai, H.F., 2001. Variations of ionospheric total electron content during the Chi-Chi earthquake, Geophys. Res. Lett. 28(7), 1383-1386.
20. Liu, J.Y., Chuo, Y.J., Shan, S.J., Tsai, Y.B., Chen, Y.I., Pulinets S.A., Yu S.B., 2004. Pre-earthquake ionospheric anomalies registered by continuous GPS TEC measurements. Ann. Geophys., 22, 1585-1593.
21. Liu, J. Y., Y. I. Chen, Y. J. Chuo, and C. S. Chen, 2006. A statistical investigation of pre-earthquake ionospheric anomaly, J. Geophys. Res., Ill, A05304, doi:10.1029/2005JA011333. 22. Liu, J.Y., Chen Y.I., Chen C.H., Liu C.Y., Chen C.Y., Nishibashi M., Li., J.Z., Xia Y.Q., Oyama
K.I., Hattori K., and Lin, C.H., 2009. Seismo-ionosphere GPS TEC anomalies observed before the 12 May 2008 Mw7.9 Wenchuan Earthquake, J. Geophys. Res., 114, A04320,
23. Molchanov, O.A., and Hayakawa, M., 2001. VLF monitoring of atmosphere-ionosphere boundary as a tool to study planetary waves evolution and seismic influence, Phys. Chem. Earth C, 26, 453-458.
24. Pancheva, D., J. Lastovicka, B.A. de la Morena, 1991. Quasi-periodic fluctuations in ionospheric absorption in relation to planetary activity in the stratosphere, J. Atmos. Terr. Phys., 53, 1151-1156. 25. Parrot, M., Lefeuvre, F., 1985. Correlation between GOES VLF emissions and earthquakes, Ann.
Geophys., 3, 733-748.
26. Pertsev N., Shalimov S. , 1996.Generation of atmospheric gravity waves in seismically active regions and their influence upon the ionosphere. Geomagnetism & Aeronom, 36(2), 111-118 (in Russian).
27. Pulinets, S.A., 1998. Seismic activity as a source of the ionospheric variability, Adv. Space Res., 22(6), 903-906.
28. Pulinets, S.A., Boyarchuk, K., Hegai, V.V., Kim, V.P. and Lomonosov A.M., 2000.
Quasielectrostatic model of atmosphere-thermosphere-ionosphere coupling, Adv. Space Res., 26, 1209-1218.
29. Pulinets, S.A., Legen'ka, A.D., Gaivoronskaya, T.V., Depuev, V.Kh., 2003. Main
phenomenological features of ionospheric precursors of strong earthquakes. J. Atmos. Sol. Terr. Phys., 65, 1337-1347.
30. Pulinets, S.A., Boyarchuk, K.,2004. Ionospheric Precursors of Earthquakes, Springer, Berlin, Germany, 315 p..
31. Pulinets, S.A., Gaivoronska, T. B. and Ciraolo, L., 2004. Correlation analysis technique revealing ionospheric precursors of earthquakes, Nat. Hazards, 4, 697– 702.
32. Pulinets, S.A., 2007. Natural Radioactivity, Earthquakes, and the Ionosphere, EOS, 88 (20), 217-218.
33. Rishbeth, H., 2006. Ionoquakes: Earthquake Precursors in the Ionosphere? EOS, 87(32), 316-317. 34. Shalimov S.L., 1992a. Lithosphere-ionosphere relationship: A new way to predict earthquakes ?
International Geoscience Newsmag. Episodes, 15(4), 252-254.
35. Shalimov S. Influence of long-period Earth's oscillations on the ionosphere, 1992b. Physics of the Solid Earth, 7, 89-94 (in Russian).
36. Shalimov, S.L., 2001. Ionospheric Irregularities Initiated by Planetary Waves, Cosmic Research, 39, N6, 559-563.
37. Shvets, A., Hayakawa, M. and Maekawa, S., 2004. Results of subionospheric radio LF monitoring prior to the Tokachi (M=8, Hokkaido, 25 September 2003) earthquake, Nat. Hazards, 4, 647-653. 38. Tsurutani, B., Mannucci, A., Iijima, B., Abdu, M.A., Sobral, J.H.A., Gonzalez, W., Guarneri, F.,
Tsuda, T., Saito, A., Yumoto, K., Fejer, B., Fuller-Rowell, T.J., Kozyra, J., Foster, J.C., Coster, A., Vasiliunas, V.M., 2004. Global dayside ionospheric uplift and enhancement associated with
interplanetary electric fields. J. Geophys. Res. 109, A08302.
39. Zakharenkova, I.E., Shagimuratov, I.I., Krankowski, A., Lagovsky, A.F., 2007. Precursory
phenomena observed in the total electron content measurements before great Hokkaido earthquake of September 25, 2003 (M=8.3), Studia Geophysica et Geodaetica, 51(2), 267-278.
Figures
Figure 1. Locations of the three M>6.9 earthquakes occurred around the Tohoku area of Japan on 7 May (128 Day), 13 June (165 Day), 19 July (201 Day), 21 July (205 Day) and 11 September (255 Day). The stars denote the epicenters, the dots denote location of 50 GPS receivers data of which were used for the analysis.
Figure 2. Variations of the solar UV flux (a), IMF Bz component (b), index of geomagnetic activity
Dst (c), of planetary index Kp (d) and of global mean TEC (e) during the period from 15 May to 21 August 2008 (135-234 days). Vertical dashed lines indicate the time of five large earthquakes on 7 May, 13 June, 19 July, 23 July and 11 September 2008. Beachballs are presented in order to indicate the focal mechanisms of the earthquakes.
Figure 3. Time series of vertical TEC within the earthquake preparation area. Thick black line
indicates the observed TEC. Blue and red bars show “abnormal” TEC values, i.e. differences between the observed TEC and the lower and upper bounds, respectively. Purple arrows show the time of the five large earthquakes.
Figure 4. Maps of differential TEC from 2 to 4 UT on day 165 (a,b) and from 4 to 6 UT on day 190 (c,d). Color denotes the difference between the observed TEC value and the median value calculated for the previous 15 days.
Figure 5. Maps of differential TEC at from 0 to 10 UT on day 150. Color denotes the difference between the observed TEC value and the median value calculated for the previous 15 days.
Figure 6. Maps of differential TEC from 4 to 8 UT for 179 day (a-c) and 180 day (d-f). Color denotes the difference between the observed TEC value and the median value calculated for the previous 15 days.
Figure 7. Time series of vertical TEC within a “check”-region in North America (36÷40°N;
113÷117°W). Thick black line indicates the observed TEC. Blue and red bars show “abnormal” TEC values. Purple arrows show the time of the five large earthquakes.
Figure 8. Maps of differential TEC from 8 to 14 UT on day 194. Color denotes the difference between the observed TEC value and the median value calculated for the previous 15 days.