HAL Id: tel-03243224
https://hal.archives-ouvertes.fr/tel-03243224
Submitted on 31 May 2021HAL is a multi-disciplinary open access
archive for the deposit and dissemination of sci-entific research documents, whether they are pub-lished or not. The documents may come from
L’archive ouverte pluridisciplinaire HAL, est destinée au dépôt et à la diffusion de documents scientifiques de niveau recherche, publiés ou non, émanant des établissements d’enseignement et de
Assessing chemical perception of the young zebrafish
Benjamin Gallois
To cite this version:
Benjamin Gallois. Assessing chemical perception of the young zebrafish. Biophysics. Sorbonne uni-versité, 2021. English. �tel-03243224�
Thèse de doctorat
Sorbonne Université
École doctorale nº564 : Physique en Île-de-France
Assessing chemical perception of the young zebrafish
réalisée au Laboratoire Jean Perrin par Benjamin Gallois
soutenue le 31 Mars 2021 devant le jury composé de
M. JOLY Jean-Stéphane Referee
M. BOURDIEU Laurent Referee
Mme WYART Claire Examinator
Mme HONG Elim Examinator
M. THIRIA Benjamin Invited
M. DEL BENE Filippo Invited
Abstract
Tracking several objects from video recordings is a complicated image processing task but essential in many academic fields. We compiled a database of two-dimensional movies from very different biological and physical systems, spanning a wide range of scales and dynamics, and de-veloped a general-purpose tracking software called FastTrack. It can han-dle a changing number of deformable objects. Furthermore, we introduce the probability of incursion, a new measure of a movie’s trackability that does not require the ground truth trajectories. We demonstrated that Fast-Track is orders of magnitudes faster than state-of-the-art tracking algo-rithms with a comparable tracking accuracy. A user and developer docu-mentation is available, and the software is distributed under a GNU GPLv3 license. Chemical perception mediates several essential behaviors in fish, like mating and feeding. However, there is much to understand on how the fish process chemical stimuli. We build two experimental setups: Dual, a high-throughput setup capable of assessing young zebrafish chemical preference, and The Tropical River to simulate realistic flows that fish are susceptible to encounter in nature. Dual is scalable, open-source, and can be built for less than 2 000 euros. Using it, we showed a clear repulsion to citric acid from fish up to 2 weeks old and showed that ATP’s presentation to 2 weeks old fish was first repulsive and then attractive.
Résumé
Le suivi d’objets à partir d’enregistrements vidéo est une tâche de traite-ment d’image compliquée mais essentielle dans de nombreux domaines universitaires. Nous avons compilé une base de données de films bidimen-sionnels provenant de systèmes biologiques et physiques très différents, couvrant une large gamme d’échelles et de dynamiques, et avons déve-loppé un logiciel de suivi polyvalent appelé FastTrack. Il peut traiter un nombre variable d’objets déformables. En outre, nous introduisons la pro-babilité d’incursion, une nouvelle mesure de la difficulté d’analyse d’un film qui ne nécessite pas les trajectoires. Nous avons démontré que Fast-Track est plus rapide de plusieurs ordres de grandeur que ce qu’il se fait de mieux dans le domaine. Une documentation utilisateur et développeur est disponible, et le logiciel est distribué sous une licence GNU GPLv3. La perception chimique intervient dans plusieurs comportements essentiels des poissons, comme l’accouplement et l’alimentation. Cependant, il en reste beaucoup à comprendre sur la façon dont les poissons traitent les stimuli chimiques. Nous avons mis en place deux dispositifs expérimen-taux : Dual, un dispositif à haut débit capable d’évaluer la préférence chi-mique des jeunes poissons-zèbres, et The Tropical River pour simuler les flux réalistes que les poissons sont susceptibles de rencontrer dans la na-ture. Dual est évolutif, open-source, et peut être construit pour moins de 2 000 euros. En l’utilisant, nous avons montré une nette répulsion à l’acide citrique des poissons jusqu’à l’âge de 2 semaines et avons montré que la présentation de l’ATP aux poissons de 2 semaines était d’abord répulsive puis attractive.
Résumé long
FastTrack un logiciel de suivi généraliste
Introduction
Le suivi d’objets depuis des enregistrements vidéos est un problème qui a gagné en popularité, tant dans l’industrie que dans dans le milieu académique. Citons par exemple le projet ATTOL d’Airbus qui permet le roulage, le décollage et l’atterrissage d’un avion en se basant uniquement sur de l’analyse d’images. Dans le milieu académique, le suivi sur vidéos est très utilisé en biologie et en écologie. Il permet de suivre les animaux dans leur environnement sans avoir besoin de les marquer invasivement. On se concentrera dans cette thèse sur le suivi d’objets multiples (MOT) qui regroupe la majorité des applications scientifiques. Le suivi d’objets multiples est un problème qui consiste à détecter et à garder l’identité des objets tout au long d’un enregistrement vidéo. C’est un problème com-plexe sous plusieurs aspects : la détection des objets peut être compli-quée si par exemple ceux-ci disparaissent derrière des objets du décor, de plus la qualité des images influence grandement la détection. Les ob-jets peuvent sortir et rentrer dans le champ de vue où se superposer ce qui complique le maintien de l’identité de chaque objet.
On distingue deux grandes classes d’algorithmes permettant de ré-soudre ces problèmes. Le premier utilise les paramètres cinématiques de l’objet ce qui permet ainsi de prédire et retrouver l’identité des ob-jets d’une image sur l’autre. Très rapide, cette classe d’algorithmes souffre d’un problème majeur, la propagation des erreurs. Si une erreur est com-mise sur une image, elle se propagera jusqu’à la fin du film. La deuxième classe d’algorithmes utilise une "carte d’identité" extraite pour chaque ob-jet. Cela permet de contourner le problème de propagation des erreurs au prix d’un temps de calcul très élevé.
Plusieurs logiciels de suivi existent. On peut citer Ethovision XT, Any-maze et ToxTrack pour les logiciels propriétaires. Les deux premiers sont livrés clef-en-mains mais coûtent cher ce qui peut être un frein pour
cer-tains laboratoires. Ces logiciels sont closed-source, c’est-à-dire qu’on ne peut ni les modifier, ni savoir exactement comment ils fonctionnent, ils ne pourront donc pas être adaptés pour un projet particulier. Dans les lo-giciels open-sources, on peut citer DeepLabCut, idTrackerai et idtracker. Les deux premiers utilisent le machine learning pour effectuer le suivi. Dans les trois cas, ces logiciels nécessitent des ordinateurs puissants et l’analyse est en général longue, l’installation est complexe et nécessite de bonnes connaissances en informatique.
Dataset
Nous avons en premier lieu regroupé divers films pouvant servir de test pour les algorithmes de suivi. Ce dataset nommé The Two Dimentio-nal Tracking Dataset TD2regroupe 41 films de plus de 7 espèces animales allant du poisson à la drosophile, des particules actives, des gouttes mi-crofluidiques et des objets macroscopiques comme des voitures et des joueurs d’ultimate.
FastTrack
Pour répondre au problème du suivi d’objets multiples, nous avons développés un logiciel nommé FastTrack. Ce logiciel est basé sur une ap-proche inédite du suivi : au lieu de développer un système très spécifique qui ne sera utilisable que sur un très petit nombre de systèmes, FastTrack implémente un algorithme de suivi généraliste utilisable sur une grande variété de systèmes, un outil ergonomique de gestions des erreurs est en-suite proposé pour que l’utilisateur puisse corriger les trajectoires après le suivi.
Le flux de traitement de FastTrack peut être divisé en 3 étapes. La pre-mière consiste à détecter les objets. Ceci est fait en calculant et sous-trayant le fond aux images puis en appliquant un seuil. FastTrack intègre les opérations d’analyses d’images usuelles pour faciliter la détection. Les objets sont ensuite triés par taille ce qui permet d’écarter les artefacts. Dans une deuxième étape, les objets sont assignés d’une image sur l’autre
ce qui permet de garder leurs identités. Ceci est fait en calculant une fonc-tion de coût et en la minimisant pour trouver l’assignafonc-tion optimale. La fonction de coût comprend le déplacement, le changement d’orientation, de taille et de périmètre des objets entre deux images successives et peut être réglée par l’utilisateur au moyen d’un ensemble de paramètres de normalisation. Deux autres paramètres de seuil permettent de définir une mémoire et une taille maximale d’assignation. La troisième et dernière étape est la correction manuelle des erreurs qui se fait dans un environ-nement interactif et ergonomique.
FastTrack permet grâce à cette technique d’être applicable sur un grand nombre de systèmes. Les paramètres de normalisation permettent de l’adap-ter à n’importe quelle dynamique d’objets. Un jeu de paramètres neutres peut être automatiquement trouvé par le logiciel pour aider l’utilisateur à obtenir un suivi le plus optimal possible. Contrairement aux logiciels exis-tants, FastTrack peut tracker des films à nombre d’objets variables, c’est-à-dire dont les objets peuvent disparaitre puis réapparaitre ou de nouveaux objets entrer dans le champ de vision. Nous avons montré que les perfor-mances de FastTrack sont aussi bonnes que les logiciels existants. De plus, notre approche permet à l’utilisateur de gagner du temps sur la plupart des projets, le temps de correction manuel étant en général plus faible que celui nécessaire pour faire un suivi directement sans erreur avec un algorithme plus couteux en temps de calculs.
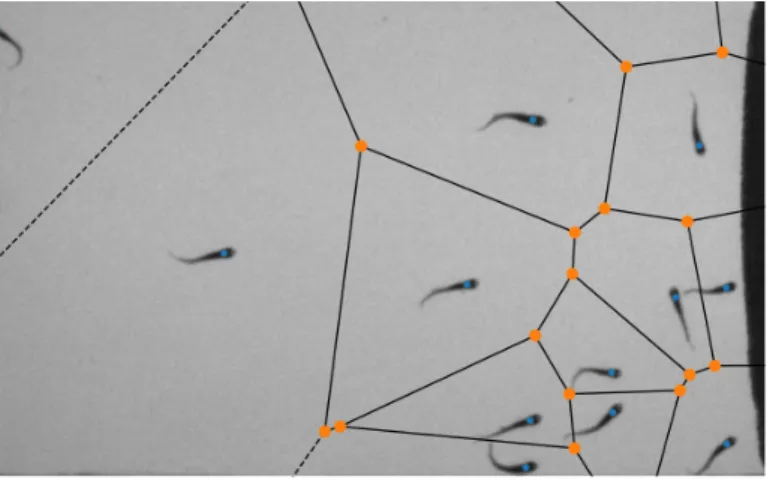
Nous avons montré comment nous pouvions classer le dataset en uti-lisant la probabilité d’incursion. Une incursion survenant lorsque l’objet à tracker sort de sa cellule de Voronoï. La probabilité d’incursion peut être définie en utilisant uniquement les propriétés géométriques de l’objet et la distribution des déplacements. Les films peuvent alors être classés sui-vant leur difficulté de suivi grâce à cette probabilité et ainsi estimer le nombre de corrections manuelles qu’il faudra effectuer. Nous définissons grâce à cette probabilité un critère permettant de calculer la fréquence d’acquisition optimale qui est une question fréquente lors de la concep-tion d’expériences.
La conception de FastTrack repose sur des bibliothèques et langages ouverts ce qui permet à n’importe qui de voir le code source et de le
mo-Figure 1 – FastTrack flux de traitement Le flux de traitement se divise en 3
étapes : la détection, l’association, et la correction. Les gindiquent les étapes nécessitant l’utilisateur (film : ZFJ_001.)
difier. FastTrack est entièrement documenté et peut être intégré dans un projet déjà existant. FastTrack dispose d’un système d’intégration et de déploiement continu (CI/CD) grâce au système GitHub Actions. Il est dispo-nible pour Linux (AppImage), MacOs et Windows et facilement installable. Un manuel d’utilisation et des tutoriels vidéos sont disponibles.
Caractérisation de la perception chimique chez le jeune poisson-zèbre
Introduction
La perception chimique est l’une des plus anciennes modalités sen-sorielles. Présente dans une grande variété de taxons, des unicellulaires jusqu’aux mammifères, elle est associée à des comportements nécessaire à la survie de l’espèce tels que trouver de la nourriture, se reproduire ou éviter des prédateurs. Les poissons sont baignés dans leur environnement chimique à chaque instant et sont pourvus d’organes pour percevoir et in-terpréter ces stimuli chimiques. Pour les poissons, la perception chimique passe par l’odorat, le goût et un sens chimique commun. Les mécanismes de perceptions ont été largement étudiés chez diverses espèces de pois-sons, mais peu est connu sur certains comportements complexes tels que par exemple les migrations.
Le poisson-zèbre est un modèle en pleine expansion dans le cadre des neurosciences. La larve est transparente ce qui permet d’observer l’inté-gralité du cerveau à l’échelle cellulaire grâce à l’image calcique à nappe de lumière. L’apparition de systèmes de réalité virtuelle pour observer le cerveau de larves effectuant des tâches a permis de mieux comprendre des comportements tels que la phototaxie, la capture de proies et la rhéo-taxie. L’application de cette technique à la perception chimique nécessite quelques étapes préalables, par exemple une bonne caractérisation des produits et de la réponse comportementale qu’ils entraînent en fonction de la concentration. Pour cela, il est nécessaire d’avoir un dispositif ex-périmental permettant de faire varier les produits, leurs concentrations ainsi que l’âge du poisson tout en caractérisant leurs préférences. Dans un deuxième temps, un montage permettant de reproduire des écoule-ments réalistes sera nécessaire pour étudier la navigation par perception chimique.
Montages expérimentaux
Pour caractériser la perception chimique chez le jeune poisson-zèbre, nous avons construit deux montages expérimentaux, l’un permettant de faire un criblage des préférences des poissons à divers stimuli chimiques, l’autre permettant de recréer des écoulements réalistes pour étudier la réponse comportementale du poisson.
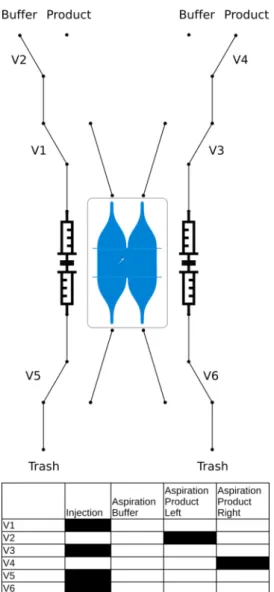
Dual Dual est un montage expérimental permettant de quantifier la
pré-férence des poissons vis-à-vis d’un produit chimique de concentration par-faitement contrôlée. Il permet de séparer un compartiment où est placé le poisson en deux zones distinctes, l’un avec un produit de concentration parfaitement connue, l’autre avec de l’eau. Ceci est réalisé grâce à un flux créé par un double pousse-seringue permettant de maintenir un écoule-ment à volume constant dans le compartiécoule-ment : quand deux seringues in-jectent d’un côté, deux seringues aspirent de l’autre. Un système de valves permet de remplir les seringues avec le produit choisi puis d’injecter en-suite. L’aquarium est coupé de l’environnement par une boîte et l’expé-rience filmée en lumière infrarouge pour éviter toutes implications d’une autre modalité sensorielle, principalement la vision. L’écoulement est vi-sualisé par un colorant infrarouge. Ce montage expérimental est open-source, flexible, et peut être reproduit pour moins de 2 000 euros avec peu de matériel (imprimante 3D et découpe laser). Un logiciel de contrôle open-source est disponible et permet de contrôler le dispositif.
The Tropical River The Tropical River est un montage expérimental qui
permet de recréer des écoulements plus réalistes auxquels sont soumis les poissons dans leur environnement naturel. Il est constitué d’un canal de 60×10×10 cm dans lequel est placé le poisson. Un écoulement lami-naire contrôlé en température et en débit alimente ce canal. Un système de valves et d’injecteurs permet de créer des jets laminaires et turbulents de manière à étudier la perception chimique du poisson dans un environ-nement plus proche de la réalité où la perception est fragmentée.
Figure 2 – A Schéma du compartiment où nage le poisson. B Image d’un
écou-lement typique avec en bas le produit visible à l’aide du colorant infrarouge. C Schéma du protocol expérimental permettant de déterminer la préférence des poissons avec un cycle contrôle B1, 2 cycles de test P1, P2 et un cycle de rinçage B2. D Le disposif expérimental Dual. E Préférence index (temps passé dans le produit moins temps passé dans l’eau divisé par le temps total) pour l’ATP en fonction de la concentrentation. On remarque une répulsion au premier cycle P1 (préférence index négatif) et une attraction au cycle P2 (préférence index positif). Résultats
Nous avons étudié la préférence de poisson-zèbre âgés de 14 jours et de 7 jours en utilisant Dual. L’expérience dure une heure durant laquelle
le poisson est soumis à un cycle avec de l’eau des deux côtés (B1) servant de contrôle, un cycle avec un produit d’un côté et de l’eau de l’autre (P1), un cycle de rinçage similaire à B1, enfin le même cycle que P1 mais en inversant les côtés (P2).
Nous nous sommes concentrés sur 5 produits : l’acide citrique et la quinine connus pour être répulsifs, l’ATP et l’adénosine connus pour être attractifs chez les poissons-zèbres adultes.
En premier lieu nous avons contrôlé que l’expérience ne contenait au-cun biais et que le colorant servant à visualiser l’écoulement était bien neutre pour le poisson. Nous avons ensuite montré que les poissons-zèbres étaient repoussés par l’acide citrique, l’intensité variant en fonction de la concentration.
Nous avons trouvé un effet de répulsion à la première présentation d’ATP, puis d’attraction à la seconde présentation chez la majorité des poissons-zèbres âgés de 14 jours. Cette étude effectuée aussi chez les larves de 7 jours manque de statistique mais cet effet ne semble pas être présent. Cela indiquerait une évolution temporelle de ce phénomène ab-sent chez les larves (7 jours), préab-sent chez les adultes (2 mois) et une partie des juvéniles (2 semaines).
Remerciements
Je voudrais en premier lieu remercier Raphaël pour son encadrement durant ces 3.5 années, qui m’a laissé la liberté et l’autonomie dont j’avais besoin pour travailler tout en me guidant sur un sujet qui fût parfois diffi-cile. Ainsi que pour les bons moments passé à bricoler Dual qui nous aura posé des énigmes jusqu’à la dernière semaine.
Merci à Hugo Trentesaux qui m’a présenté Raphaël et le laboratoire. Sans lui je n’aurais sûrement pas fait une thèse au LJP, ni pris autant de plaisir à construire des dispositifs expérimentaux.
Merci à tous les doctorants (et surtout ceux de la salle 417) pour la très bonne ambiance et l’aide qu’ils ont apportée durant ces 3 ans.
Je remercie l’équipe de la plateforme aquatique pour l’élevage des poissons, ainsi que toutes les personnes du laboratoire. Enfin je remercie ma famille pour leur soutien.
Contents
I FastTrack: a general tracking software 14
1 Introduction 15
1.1 Video based tracking . . . 15
1.2 The tracking, a not so simple problem . . . 17
1.3 Existing software . . . 18
1.3.1 Proprietary software . . . 18
1.3.2 Open-source software . . . 21
1.4 FastTrack: an original approach . . . 24
2 Movies dataset 26 3 Design and implementation 29 3.1 Tools used . . . 29
3.2 Implementation . . . 31
3.2.1 Detection . . . 31
3.2.2 Matching . . . 36
3.2.4 Manual correction . . . 41
3.2.5 Output . . . 41
3.3 Deployment . . . 42
3.3.1 Continuous integration delivery. . . 42
3.3.2 Documentation . . . 43
4 Results 45 4.1 Performance . . . 45
4.2 Dataset classification . . . 47
4.3 Parameters optimization . . . 52
5 Conclusion and perspective 55 Appendices 57 A FastTrack user interface preview 58 B Voronoï diagram 60 B.1 Definition . . . 60 B.2 Construction . . . 61 C Hungarian algorithm 62 C.1 Definition . . . 62 C.2 Description . . . 62
II Assaying chemical preference of the young zebrafish 66
6 Introduction 67
6.1 The chemical perception . . . 67
6.1.1 Olfaction . . . 69
6.1.2 Gustation . . . 71
6.1.3 Common chemical sense . . . 73
6.2 Behavioral studies . . . 74
6.2.1 Behavior . . . 74
6.2.2 Conditioned place preference . . . 75
6.2.3 Multi well-plate . . . 76 6.2.4 Direct introduction . . . 77 6.2.5 Flow . . . 79 7 Experimental setups 82 7.1 Dual. . . 82 7.1.1 Overview . . . 82 7.1.2 Construction . . . 83
7.1.3 Construction and usage . . . 88
7.2 The Tropical River . . . 89
7.2.1 Description . . . 90
7.2.2 Usage and limitation . . . 92
8.1 Methods . . . 94 8.1.1 Experiment . . . 94 8.1.2 Analysis . . . 96 8.2 Results . . . 102 8.2.1 Setup caracterisation . . . 102 8.2.2 Products screening . . . 104 9 Discussion 115 Appendices 118 E Dual bill of materials 119 F Touch-and-turn behavior 122 G Calculation 124 G.1 Mean quantities . . . 124
G.2 Statistical tests . . . 125
G.3 Image analysis . . . 125
H Kinematic parameter distributions 126
I Markov model results 128
Part I
FastTrack: a general tracking
software
Chapter 1
Introduction
Talk is cheap. Show me the code.
Linux Torvald
1.1 Video based tracking
The tracking of objects from video recordings is a problem that has gained much popularity in recent years. It is mostly due to its great poten-tial, both in academia and for commercial and security applications. Ex-amples include autonomous cars that can drive themselves, or the Airbus ATTOL project [1] that allows fully automated take-off, landing, and taxiing of planes based solely on image analysis. A large part of the research ef-fort is focused on creating pedestrian recognition and tracking algorithms to automate the analysis of video surveillance data. Tracking is also widely used in movie creation with special effects (VFX, CGI), whether to stabilize shots or to realize special effects (e.g., motion capture), and for industrial process [2]. In this case, automated tracking on images reduces costs, pro-duction time, and human operators’ use.
ecology [3,4], is a rapidly growing field because it avoids disturbing the an-imals with invasive markings. Cellular motions tracking is also widely stud-ied with very specialized algorithms developed solely for this purpose [5,6]. Other fields of science are interested in automated tracking, to name a few: microfluidic [7], active matter [8], social science [9] and robotic [10]. Auto-mated tracking generally produces large amounts of reliable data, reduces biases and avoids long and tedious manual analyses. The latter are some-times impossible to perform due to excessively large image collections.
Object tracking can be separated into two categories: the Single Ob-ject Tracking (SOT), where the goal is to detect a single obOb-ject in a more or less complicated scene, and the Multiple Object Tracking (MOT), where the goal is to detect and track several objects. In this dissertation, we will place ourselves within the MOT framework since it is more representative of the applications usually encountered in academia. For many scientific experimental setups, the inherent difficulty of tracking can be greatly miti-gated with a well-designed system. In general, the setups are designed to optimize the imaging conditions, with a fixed camera and a lighting that facilitates object detection. On the other hand, the tolerance to errors is low if one wants to produce reliable data and robust scientific conclusions. A decisive point is the algorithm’s performance, which must analyze the data in a reasonable time compared to their production rate and meet the user’s material and technical constraints. The ease of installation and use of the software that integrates the algorithm should not be neglected. The users brought to use these software are generally not experts in computer science and image analysis, and the software must be readily installable and usable by all.
We will first see why the tracking is still a complex problem and how we can reduce or bypass this complexity. We will then present a non-exhaustive list of existing tracking software applied to diverse scientific fields. Finally, we will present how the software we have developed for general-purpose tracking follows a different approach, and in which cases it can be useful.
1.2 The tracking, a not so simple problem
The image-based tracking of objects usually involves three key steps: the acquisition of the images, which, depending on the acquisition param-eters, will condition the difficulty of the tracking and the type of algorithm that can be used; the detection of objects, which consists in separating the objects from the background; and finally the assignment of objects from one image to another allowing to keep track of the objects’ identities. Ob-ject tracking is generally a complex image processing task [3]. Depending on the objects studied, each step can be difficult. For example, animals are highly deformable objects interacting with each other, making the detec-tion step complex. The scene can be complicated, with objects disappear-ing behind the decor elements, superimposdisappear-ing each other (the so-called occlusion phenomenon), or entering and leaving the field of view, compli-cating the detection and the association step.
Object detection problems can usually be circumvented by the design of the experimental setup whenever it is possible. A fixed point of view and lighting optimization usually allows for simple detection by subtracting a background image (without object) and applying a threshold. For more complicated cases, a wide variety of algorithms are available [11] and ap-plicable depending on the images’ quality. The most common is to detect points of interest in the object. This technique is invariant to the point of view and illumination but requires a sufficient image quality. Segmenta-tion allows to separate the image by area of similarities and thus to detect objects of interest, many algorithms and approaches exist to segment an image. Machine learning can also be applied for object detection [12].
Two main classes of algorithms can be distinguished to mitigate asso-ciation problems. The first class of algorithms uses the object’s kinematic quantities, such as direction or position [13], to predict or find the position of the object on the next image and thus keep its identity. This method’s error rate remains constant when we increase the number of individuals (keeping the density of objects fixed). It is generally fast, and this makes it a good candidate for real-time tracking applications. The major disadvan-tage of this approach comes from the error propagation phenomenon. If
the algorithm makes an error in the assignment, it has no way to correct the error at the next step, and it propagates to the end of the analysis. The second class of algorithms is based on recognizing the object’s points of interest, allowing the creation of a "fingerprint" unique to each object. That can be done using either a classical method [14,15], or using machine learn-ing [16,17]. This technique solves the propagation of errors problem and allows objects to be tracked over time, i.e., across several unpaired videos. For example, an animal can be recognized from one day of experiments to the next, which can be very useful, especially for behavioral studies. This method requires images of sufficient quality to extract markers represen-tative of the object. It also requires more computational resources, thus an analysis that cannot be done in real-time. However, the main limita-tion is the number of objects it can track. It is currently limited to about ten objects per image with classical methods before the algorithms’ per-formance degrades significantly. The machine learning approach makes it possible to increase the number of objects at the cost of long computation time and the need to use high-performance computers.
1.3 Existing software
Many tracking software already exist. We will make a non-exhaustive list of the most popular ones, separating them into two categories: propri-etary software and open-source software.
1.3.1 Proprietary software
The proprietary software presented here are closed-source. The user cannot modify the code to adapt the software to his project or check pcisely how the tracking is performed. On the other hand, they do not re-quire any computer knowledge and benefit from a support service conve-nient for users that do not have a lot of computer knowledge. They are an excellent alternative to other options that are sometimes difficult to implement, but their high price can be a hindrance for some users.
EthoVision XT EthoVision XT is a software developed by the company
Noldus. It accompanies the user from the acquisition of images, thanks to a system of experiment templates, to the data analysis with a module allowing to visualize standard behavioral parameters. The software is com-plete and widely used. It is somewhat specialized in the field of behavioral neurosciences. It includes modules for classical behavioral experiments (e.g., water-maze, rats social interaction). It also allows performing live tracking so that users do not have to save images for long experiments.
EthoVision XT is a mature software. A large number of modules are available as well as a system that allows the user to create its own experi-ment template. The most significant disadvantage is that the user cannot modify the software or control how the tracking is done. Price can be a bar-rier for some users, as the software costs a minimum of 5,850 USD without modules, and it is compatible only with Windows. Focused on tracking an-imals, it will not be suitable for other systems.
Any-maze Any-maze is a software developed by Stoelting Co. It is
spe-cialized in the analysis of behavioral neuroscience experiments. It directly integrates tools for standardized tests (e.g., forced swim test, fear condi-tioning test), allowing fully automated analysis of these experiments. It can track in real-time or from recorded videos.
Any-maze is a complete solution for creating and analyzing typical be-havioral experiments. It can be purchased with the experimental setup al-ready optimized and calibrated for the software. The Any-maze suite con-sists of three software packages. The tracking part is available for USD 6,495 or USD 1,500 per year. The software is available for Windows only.
ToxTrack ToxTrack [18] is a software that implements in a graphical
in-terface the ToxId algorithm [19]. In short, the algorithm extracts objects from the background by applying a threshold. The pieces of trajectories between occlusions are divided into short and long trajectories based on a user-defined threshold time. A group of long trajectories where all individ-uals are observed simultaneously is then extracted. In this case, the
assign-ment is made using the Hungarian algorithm. The remaining trajectories are then assigned to the corresponding object selecting the best correla-tion value in a trajectory identificacorrela-tion matrix, see Figure1.1. This matrix contains the similarity between every two trajectory fragments based on objects’ features. The authors report that ToxId is as powerful as other ex-isting software, fast, and can track objects in real-time. A disadvantage that can be seen in this algorithm is that it only works for a constant number of animals. The algorithm’s initialization requires to have at one moment t all the objects to be tracked simultaneously detectable for a user-defined time t + dt. The user-interface (UI) is sometimes difficult to use: the in-tegrated tracking reviewer does not permit to correct the tracking or to replay the tracking frame by frame.
The UI includes tools to define areas of interest as well as statistical analysis of the collected data. The software is only available for Windows. The project initially open-source change to a closed-source model, but the software is still under development.
1.3.2 Open-source software
Open-source software allows the user to read, modify, and distribute the software. It is the preferred alternative to commercial software. From a scientific perspective, using open-source software increase transparency and lead to easier reproducibility of scientific results. From a development standpoint, it leads to better code quality and fewer bugs. In general, no individual assistance service is provided. The collaborative development of most of these software allows the user to report bugs and participate in their development to help the community.
idTracker IdTracker [14] is a MATLAB library that allows to track multiple
objects in video recordings. It is based on the extraction of a "fingerprint" for each object, allowing a tracking without errors propagation. The ad-vantage of idTracker is that it can recognize an object over several videos and after a relatively long time, which can be useful to track individuals’ behavior over several series of experiments.
IdTracker is solving amazingly well the error-propagation problem dur-ing the association phase. However, it is limited by the number of objects it can track, currently about twenty, due to the movie’s length necessary for extracting each object’s "fingerprint". This task can go up to 30 min-utes minimum for a high object density. The required image quality is an essential factor and must be at least 150 pixels per animal. The compu-tation time is relatively long, in the order of 0.5 to 2 seconds per image, and requires a large amount of RAM. The installation of idTracker can be done without the need to install MATLAB thanks to the Matlab Run Time Compiler but only under Windows. Therefore, it is necessary to purchase a MATLAB license for other platforms and have minimal knowledge of the language to set up idTracker.
DeepLabCut DeepLabCut [16] is a framework that solves the so-called
"pose estimation" problem, which consists of finding an object and its po-sition, or part of an object, in an image. It can be directly related to the SOT problem if the objects to be tracked are different, for example, a right
mouse ear and a mouse nose, which can then be found on each image and then associated in the case where there is only one mouse. In the case of several similar objects to be found and associated from one image to an-other (MOT), this detection will have to be combined with an association step to obtain the tracking. Even if DeepLabCut answers a slightly differ-ent problem, it can, by its design, be coupled with an external association algorithm to make a tracking software.
DeepLabCut is directly based on the feature detection algorithm of the DeeperCut framework [20], specialized in the detection of human body movements. The authors of DeepLabCut have studied this algorithm’s per-formance applied to the field of behavioral neuroscience, such as the de-tection of mice snouts or drosophila legs. They have added tools to train the algorithm easily and test its robustness.
DeeplabCut takes advantage of deep learning, a machine-learning al-gorithm that consists of training a neural network containing several lay-ers [21]. In DeepLabCut, the network consists of several residual neural networks (ResNets) pre-trained on the ImageNet database. The network is then fine-tuned by training on images where the parts to be detected are annotated. In the end, the algorithm gives the probability of presence of the object in the image. The authors have shown that the performance is at least as good as human detection and can be obtained with very little training data (200 annotated images).
DeepLabCut, as previously mentioned, is a framework, and despite an excellent documentation [22], it can be challenging to use for a user with little computer skills. The installation process lasts from 10 to 60 minutes and requires a GPU installation to get the most out of the software. Be-sides, the algorithm requires a lot of computing power. To give an idea, images of 682x540 pixels, analyzed with a last-generation GPU, lead to an analysis speed of 30 frames per second. Without GPU, this time can be multiplied by a factor of 10 or 100 [23].
We see that DeepLabCut is of great interest to precisely find objects in an image. It is particularly aimed at behavioral neuroscience, allowing complex movement tracking (e.g., hand fingers of a mouse). It will not be suitable for users with little computer knowledge interested in more
ex-tensive problems and with little data to process.
Figure 1.2 – DeepLabCut workflow chart.
idTracker.ai IdTracker.ai [17] is a framework that allows tracking animals
with almost perfect accuracy. IdTracker.ai takes advantage of deep learn-ing to carry out the association. In the first step, each object is segmented by applying a threshold. A convolutional network classifies each detected blob as containing a single object or several objects. Another convolu-tional network finds the identity of each individual throughout the movie. This system requires enough data to train the network that will recog-nize each individual. The authors found that robust tracking can be ob-tained with only thirty isolated images of each individual. Therefore, it is necessary to plan for a minimum of five hundred images for a dozen indi-viduals with a minimum of twenty-five frames per second. A resolution of three hundred pixels per animal is recommended for good tracking accu-racy. A limiting factor of idTracker.ai is that it requires a lot of computing time and a lot of RAM. The authors report about twenty minutes for pro-cessing a video with eight zebrafish and about six hours for a hundred zebrafish on about two thousand high definition images. Even if a UI is available to help the user, basic computer and programming knowledge is required, and suitable hardware. The use of a GPU is strongly recom-mended.
This software is suitable for users who want perfect and fully auto-mated tracking from high-quality videos having a powerful computer. A tool is integrated to review and correct the tracking, but the lack of
ergon-omy makes it sometimes difficult to use.
Figure 1.3 – IdTracker.ai workflow chart.
1.4 FastTrack: an original approach
We have previously listed the most used tracking software in different fields of science. We can see that a fast software requiring little computing power, versatile (i.e., that can be applied to any systems with a variable number of objects), easy to install, and open-source is missing. To fill this void, we designed a software called FastTrack [24]. This software contains two distinct parts:
• An interface where standard image analysis procedures are imple-mented to detect objects, and a tracking algorithm that allows keep-ing the identity of objects from one image to another, fast and with a low error rate.
• An ergonomic interface where the tracking can be checked and man-ually corrected if necessary.
FastTrack has a different approach than the software previously mentioned. Instead of exploiting a high computational power to achieve a reliable result without any human intervention, FastTrack implements a simple, very general method. The few resulting tracking errors are left to manual
corrections. In terms of result accuracy, both approaches lead to a quasi-perfect tracking. In terms of speed, human interventions during the post-processing are costly. However, the automatic tracking part is performed much faster, and we noticed that using FastTrack is usually faster. From the images to the trajectories, the duration of the whole process is notably re-duced for small projects due to the fast installation and ease of use of FastTrack. Besides, many researchers want to double-check the resulting trajectories to ensure the reliability of the trajectories or get some sense of their objects’ dynamics to orient the subsequent analyses, which is per-formed natively in the FastTrack workflow. This solution has several advan-tages, the first one being that it does not require any programming knowl-edge. Any user can perform a perfect analysis in a very short time. More-over, we will see in the following that the post-processing work can be es-timated by an analysis of the geometrical and dynamic parameters of the studied system, which allows the user to know if the software is adapted to his needs. For many of the systems studied, the post-processing is only a quick check. If the number of occlusions is too high, and a perfect track-ing accuracy is necessary without havtrack-ing to resort to manual correction, another solution must be considered.
FastTrack is distributed under a free software license and implemented in a modular and fully documented manner. Each user can thus modify the software at his convenience or contribute to it. The tracking algorithm is decoupled from the detection and correction interface, which makes it ex-tremely easy to integrate FastTrack into an existing project. The software is easily installed in less than 5 minutes and is compatible with Linux, ma-cOS, and Windows. It can run on modest configurations and Single Board Computer (SBC) such as the Raspberry Pi.
Chapter 2
Movies dataset
To demonstrate that FastTrack can analyze movies from various sys-tems, we have compiled a collection of movies named the Two-Dimentional Tracking Dataset (TD2). This dataset can be downloaded athttps://data. ljp.upmc.fr/datasets/TD2/. The films either come from data already pub-lished in the literature or provided by the authors themselves. All the movies are under a CC-BY-NC-SA license. Each movie is identified by a 3-letter code defining the system (e.g., ACT: active matter, ZFA: zebrafish adult...) and three digits to index films from an identical system. TD2 cur-rently regroups 41 films, including different types of objects of very differ-ent nature and size
• 7 species of animals from fish to flies, • cells,
• active particles, • microfluidic drops,
• macroscopic objects such as ultimate players or cars.
A video giving a quick overview of all the systems used is available athttp: //www.fasttrack.sh/images/illustrations/mockups/trackingExample.webm.
Another essential aspect to consider is the number of objects per film and their possible appearances, disappearances, and overlaps. In 22 films out of 41, the number of objects is variable, and objects come and go out of the camera field during recording. In 19 films out of 41, objects may overlap, creating an occlusion phenomenon that the software has to manage to preserve the identity of the objects.
S1 Table. Two-Dimensional Tracking Dataset.
Description and credentials of the data that have been used for testing the FastTrack software. All movies in the dataset can be downloaded at http://data.ljp.upmc.fr/datasets/TD2. Identifier Color Number
of images Image size
Number
of objects Object type Short description Authors Reference Overlaps Preprocess
ACT_001 No 1,001 2040x2040 1141 Active particles Vibrated polar monodisperse discs in a liquid-like configuration. Olivier Dauchot 17 No No ACT_002 No 1,001 1121x996 1085 Active particles Vibrated polar monodisperse discs in a cristalline-like configuration. Olivier Dauchot 18 No Yes ACT_003 No 1,000 1728x1728 853 Active liquid Vibrated polar monodisperse discs. Olivier Dauchot 19 No Yes ACT_004 No 998 4096x3072 Variable Active droplets Motion of water droplets in an oil-surfactant medium of squalane and monoolein. Olivier Dauchot 20 No No ART_001 No 2,000 1280x1024 Variable Brine schrimps Brine shrimps (Artemia Salina nauplii) swimming. Raphaël Candelier 15 Yes No BAC_001 No 74 907x866 Variable Bacillus Subtilis Growing colony of Bacillus Subtilis. Lydia Robert Unpublished Yes Yes BLS_001 No 2,213 1024x1024 7 Black Scavengers Black scavengers walking in an arena. Juan Pablo Busso Unpublished No No DRO_001 Yes 1,803 640x360 3 Adult fruit flies Blow-up of three fruit flies (D. Melanogaster) in an Y-maze assay. Benjamin de Bivort Unpublished No No DRO_002 No 1,589 640x480 91 Adult fruit flies Fruit flies (D. Melanogaster) walking in an Y-maze assay. Very low resolution. Benjamin de Bivort 21 No Yes DRO_003 Yes 927 1280x720 12 Adult fruit flies Fruit flies (D. Melanogaster) in a multi-chamber assay. Benjamin de Bivort Unpublished No No DRO_004 No 3,490 602x228 15 Adult fruit flies Fruit flies (D. Melanogaster) in a multi-tubes odor assay. Benjamin de Bivort 22 No No DRP_001 No 700 1224x476 Variable Droplets Round droplets evolving in a narrowing microfluidic channel. Lea-laetitia Pontani 16 No No DRP_002 No 600 1224x477 Variable Droplets Polyhedral droplets evolving in a narrowing microfluidic channel. Lea-laetitia Pontani Unpublished No No DRP_003 No 835 1223x434 Variable Droplets Polyhedral droplets evolving in a narrowing microfluidic channel. Lea-laetitia Pontani Unpublished Yes No DRP_004 No 299 640x360 Variable Droplets Six-layers pattern of droplets in a diverging/converging microfluidic channel. Bibin M. Jose, Thomas Cubaud 23 No Yes DRP_005 No 660 960x730 Variable Droplets Edge-fluorescent droplets evolving in a narrowing microfluidic channel. Lea-laetitia Pontani Unpublished No Yes GRA_001 No 1,001 2040x2040 2043 Hard disks Vibrated isotropic bidisperse discs. Olivier Dauchot Unpublished No Yes GRA_002 No 1,009 900x900 Variable Hard disks Motion of dense bidisperse hard particles close to jamming. Raphaël Candelier, Olivier Dauchot 24 No Yes GRA_003 No 165 1470x1469 Variable Vibrated grains Motion of a pulled intruder in a dense set of bidisperse particles. Raphaël Candelier, Olivier Dauchot 24 No Yes HXB_001 No 1,001 2040x2048 10 Hexbugs Tiny robots vibrated in a parabolic arena. Olivier Dauchot 25 Yes N/A IND_001 No 2,255 512x512 Variable Plastic parts Plastic connectors for microfluidics moving on a conveyor belt. Some are isolated, some are overlapping. Raphaël Candelier Unpublished Yes No IND_002 No 2,463 512x512 Variable PCB Small printed circuit boards (PCB) moving on a conveyor belt. Some are isolated, some are overlapping. Raphaël Candelier Unpublished Yes Yes MED_001 No 2,134 640x480 2 Adult Medakas Two fish (Oryzias latipes) following a moving visual pattern. Hideaki Takeuchi 26 Yes No MIC_001 No 693 854x480 2 Adult mice Two white mice interacting in a dark arena. Noldus Information Technology Unpublished Yes No PAR_001 No 1,000 1024x1024 Variable Paramecia Paramecia swimming in an open field. Alexis prevost Unpublished Yes No ROT_001 No 1,311 800x800 Variable Rotifers Rotifers (Rotifera) swimming in an open field. Raphaël Candelier 15 Yes No SOC_001 No 600 1920x1080 23 Humans Aerial view of a soccer game. Raphaël Candelier Unpublished Yes Yes TIS_001 No 241 301x301 Variable Neurons Developing neurons in the hindbrain of a GCaMP3 3dpf zebrafish larva. Total acquisition time: 30 min. Raphaël Candelier Unpublished No Yes TIS_002 No 241 301x300 Variable Neurons Developing neurons in the optic tectum of a GCaMP3 3dpf zebrafish larva. Total acquisition time: 30 min. Raphaël Candelier Unpublished No Yes TRA_001 Yes 1,171 1280x720 Variable Vehicles Aerial view of traffic. No Copyright Footage Unpublished No Yes ULT_001 Yes 383 1280x720 Variable Humans Aerial oblique view of a sequence of Ultimate (flying disk) game. Paulin Huger Unpublished Yes Yes ULT_002 Yes 953 1280x720 Variable Humans and disk Aerial top view of a half-field Ultimate (flying disk) game. Paulin Huger Unpublished Yes Yes ZFA_001 No 15,000 1920x1080 5 Adult zebrafish Five adult zebrafish interacting. Gonzalo G. de Polavieja 13 Yes No ZFA_002 No 2,000 1218x482 2 Adult zebrafish Two long-fin (TL) and normal fin (AB) zebrafish interacting. Benjamin Gallois Unpublished Yes No ZFA_003 No 2,000 1217x471 3 Adult zebrafish Three Tupfel long-fin (TL) zebrafish interacting. Benjamin Gallois Unpublished Yes No ZFA_004 No 2,000 1212x472 4 Adult zebrafish Four zebrafish (TL, AB) interacting. Benjamin Gallois Unpublished Yes No ZFJ_001 No 200 524x338 14 Juvenile zebrafish Three weeks-old zebrafish swimming in a flow. Benjamin Gallois Unpublished Yes No
Chapter 3
Design and implementation
Testing can only prove the presence of bugs, not their absence.
Edsger W. Dijkstra
3.1 Tools used
The choice of tools and libraries used in designing software is paramount, and several selection factors must be taken into account.
The first criterion to consider is the license. We chose to put FastTrack under a free license (GPL3), which implies that the language used and the libraries must also be under compatible licenses. The choice of an open-source license is preferable in the case of scientific software [25]. Poor code quality naturally leads to what is called a technical debt. Choosing the "quick and dirty" implementation instead of a time-costly but main-tainable solution can hurt the project in the long goal by costing time and effort to run and maintain the code. Open-source can help to solve this problem. First, it is a strong incentive to produce clean code, knowing that it can be read, checked, and used by other people. Moreover,
coop-erative work can help solve bugs faster than a closed-source model. Fi-nally, open-source projects, well documented, can make accessible tools for non-technical scientists that would otherwise have been impossible.
The second criterion is to carefully choose the libraries used, consider-ing the future of the software so that the developers do not have to change libraries if their capabilities prove insufficient as the software evolves. Ma-ture libraries offering long-term support are thus preferred.
In this perspective, FastTrack has been implemented in C++ using the Qt [26] and OpenCV [27] libraries for the graphical interface and image anal-ysis, respectively. Unit tests are performed using the Google Test library.
C++ is a computer language created by Bjarne Stroustrup in 1985 [28]. Offering high performance, it is standardized by the International Organi-zation for StandardiOrgani-zation (ISO). It is the language of choice for image anal-ysis applications and the creation of complex graphical user interfaces.
Qt is an open-source GUI library created by Haavard Nord and Eirik Chambe-Eng, two physicists, in 1991 when developing ultrasonic image analysis software. With extensive documentation and a large community, it is very mature. It allows creating graphical user interfaces for Linux, Mac, and Windows from the same source code.
OpenCV is an open-source image analysis library created by Intel in 1999. Very complete and efficient, it has become the reference in image analysis for both academic and commercial applications.
Google test is a suite for automating unit tests in C++. OpenCV notably uses it. The purpose of unit tests is to verify that each part of the program works as expected. This practice has several advantages: detecting more easily possible errors during the implementation of new features and fa-cilitating software development when it grows in size to avoid any error inclusions. This series of tests are automatically performed on each new commit, see Section 3.3.1for more information.
3.2 Implementation
FastTrack’s operation can be divided into three parts: the objects’ de-tection (dede-tection), the objects association from one image to another (matching), and finally, a manual correction step (post-processing).
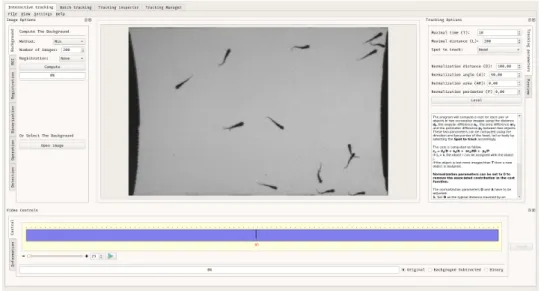
Each analysis begins with the opening of an image sequence or a video file. The user can choose between two types of interfaces, an interactive in-terface where he can only open one film at a time. It allows the user to see, in real-time, the impact of parameters on the images, which facilitates the determination of optimal analysis parameters. A second interface allows many movies to be opened simultaneously, either by giving a parameter file or selecting the parameters in the interface. It is useful when the user wants to analyze many movies for which he already knows the optimal analysis parameters.
Both interfaces can be used in a complementary way. The user can find the optimal parameters with the interactive interface and then automate the analysis of many movies by tracking them in batches in the software. 3.2.1 Detection
The purpose of the detection step is to extract each object’s kinematic parameters, which will be used later during the association step. FastTrack includes a collection of image analysis filters that allow the user to opti-mize object detection without external software.
Background Calculation Each analysis starts by calculating a background
image. If the user already has a previously saved background image, he can directly open it in the software. Otherwise, three calculation methods are possible:
• Projection of maximum intensity. • Projection of minimum intensity.
Figure 3.1 – FastTrack workflow chart. The workflow divides into three mains parts:
detection, matching, and post-processing. A gindicates the few steps that require user input. Sample dataset: ZFJ_001.
• Projection of the average intensity.
All three methods are based on the same principle. The user chooses n images in the sequence. The software will make a projection of the stack along the time component, either the maximum, minimum or average of each pixel. In practice, the maximum (resp. minimum) will be projected if the objects are darker (resp. lighter) than the background so that the objects disappear and thus obtain the background. The user can make the registration of each image before the projection in order to correct for possible minute camera movements.
Registration The user can choose to register the images. Three methods
are proposed in the software. Each method is implemented in a pyramidal way, i.e., the registration is first carried out on a degraded image to roughly correct the displacement. The correction is then refined by increasing the image quality until the original quality is reached. This speeds up the pro-cess, as registration is often a relatively time-consuming process.
The first method proposed is phase correlation [29]. It corrects the translational movements between two images using the Fourier theorem in the frequency domain. This method is swift but remains limited to small translational movements only.
The second proposed method is the Enhanced Correlation Coefficient (ECC) [30] method. In FastTrack, it is restricted to correcting translational and rotational movements only. It consists of using the correlation coef-ficient as a measure to find the best transformation between two images. This method’s advantage is that it is relatively fast since this non-linear op-timization problem can be solved linearly. It is efficient for noisy images and having photometric distortions.
The third method is a method based on the identification of key points. It allows for correcting movements and deformations (homography). The key points (about 500) are automatically determined on two images thanks to the ORB algorithm [31]. These points are then associated two by two us-ing the hammus-ing distance. The RANSAC algorithm [32] is used to find the best transformation between the two images. This method, more precise, requires a sufficient image quality to be able to discern key points.
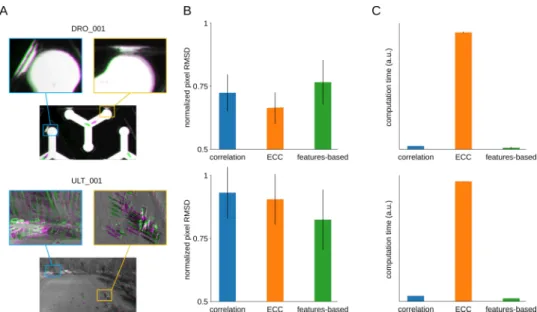
Figure3.2provides a rough comparison of the performance of the three methods. Using two recordings of the TD2dataset, we benchmarked both the accuracy – with the root mean squared difference (RMSD) of pixel in-tensities between the reference and the corrected image – and the relative computation time. Choosing the right method to obtain the best accuracy depends on each movie’s characteristics. However, one can use the rule of thumb that if the objects to track occupy a large fraction of the total area, the best accuracy is more likely to be obtained by using ECC and using the features-based method otherwise. However, as shown in Figure3.2-C, the ECC method is generally slower by an order of magnitude. Hence, we
rec-Figure 3.2 – Image registration. Two recordings with severe drift are used for the
benchmarking (top: DRO_001, bottom: ULT_001). (A) Comparison of a frame (ma-genta) with the first frame (green) and magnification of details in the scene. (B) The root mean square deviation (RMSD) of pixel intensities after registration onto the first image, averaged over all time frames and normalized by the RMSD with-out registration, for the three registration methods. Error bars: standard deviation across time frames. (C) The relative average computation time of the three regis-tration methods, normalized by the total number of pixels in the movie (arbitrary units). Error bars: standard deviation across time frames.
ommend using the features-based method in the general case and long movies.
Binarization Each image is then binarized by subtracting the background
image and defining a threshold value. In the interactive mode, the user can see the impact of the parameters on the image, which makes it easier to adjust the binarization threshold. The software also detects if the back-ground is darker (resp. lighter) than the objects allowing to have at the end of this operation a binary image where the pixels belonging to the ob-ject are equal to 1, and the pixels belonging to the background are equal to 0.
Morphological operation A set of morphological operations (dilation,
ero-sion, opening, etc.) can be performed on the binary image to improve de-tection and eliminate possible artifacts. Different shapes and sizes of ker-nels are available.
ROI The user can select a region of interest and exclude the rest of the
image from the analysis. This speeds up the analysis process and avoids the detection of interfering objects. In interactive mode, this ROI can be drawn directly on the image.
Sorting To exclude objects that are too small (e.g., noise) or too large (
e.g., two objects overlapping each other), the user must select two charac-teristic sizes. The objects are colored either red or green in the interactive mode depending on whether their size belongs to the selected range.
Extracting kinematic parameters Based on the binary images, the
soft-ware will detect the contour of each object. An essential step in any track-ing procedure is the extraction of the parameters used in the matchtrack-ing step. It is generally with the choice of these quantities that the tracking algorithms can differ to be more specialized for a given type of object. In FastTrack, the parameters extracted are the center of mass, the orien-tation, the area, and the object’s perimeter. These quantities are quickly calculated and general enough to adapt to a wide variety of objects.
To do this, FastTrack calculates the object’s equivalent ellipse from the second-order moments of the binary image [33]. This procedure is acceler-ated by directly using the contour thanks to Green’s formula [34]. The ob-ject’s orientation is given by the ellipse’s major axis and is defined in the interval [0; π[. The direction in the interval [0; 2π[ is determined by project-ing each object’s pixel on the major axis of the equivalent ellipse, and cal-culating the skewness of the distribution of distances of these projected points to the center of mass. The sign of the skewness is a robust indicator of the object’s asymmetry along its principal axis. For deformable objects, the previously calculated direction may be different from the direction of
motion. For example, in the case of zebrafish, it bends its body periodically to move. Only the head is directed at the motion. This is why the object is decomposed into two equivalent ellipses. The user can then choose which ellipse best represents the direction of the movement.
Figure 3.3 – Detection Details of the detection phase for one object of the movie
ZF J_001. (A) raw image. (B) binarized image obtained by subtraction the back-ground image and applied a threshold. (C) equivalent ellipse of the object. (D) two equivalent ellipses, useful for a deformable object.
3.2.2 Matching
The purpose of the association step is to keep the objects’ identity from one image to another. To do so, FastTrack uses a method derived from [13], which takes advantage of the fact that each object’s position, area, perimeter, and direction changes very little from one image to another.
For each pair of objects (i, j) belonging to two successive images, two costs are calculated: a hard cost that is a threshold set to 1 or +∞, and a soft cost that is a normalization parameter. This terminology is brought from statistical physics, where particles can have soft, long-ranged inter-actions or hard, binary contacts. The hard cost is defined as follows:
(
hi,j = 1 if ri,j < hd
hi,j = inf else (3.1)
with ri,j the distance between objects i and j, hda threshold representing the maximum travel distance allowed between two successive images. The hard cost allows discarding obvious impossible assignments to speed up the computation. It is essential with a non-constant number of objects because it allows new objects entering the field of view to be assigned with new identities.
The soft cost is then defined as follows: ci,j = δri,j sr +δαi,j sα +δAi,j sA +δPi,j sP (3.2)
where δαi,jis the angular difference, δAi,jthe area difference and δPi,jthe perimeter difference between objects i and j. To compare these quantities expressed in different dimensions and magnitudes, one need to normal-ize them. We define the soft normalization coefficients: sr, sA, sP and sα. These coefficients represent the typical value of the parameter that they normalize. We can construct the cost matrix:
Ci,j = (
ci,j if ri,j < hd
∞ else (3.3)
This cost matrix is, in general, rectangular because the number of objects can vary from one image to the following. A memory parameter can be selected to assign a new identity to an object that disappears on more than the selected number of images. In this case, the row corresponding to this object is removed from the cost matrix and the object cannot be assigned in the subsequent images. We want then to find the best possible matching. This problem is called the rectangular assignment problem and can be solved exactly by using the Hungarian algorithm, see Annexe C. FastTrack uses the Kuhn-Munkres implementation in C++ to solve it. 3.2.3 Automatic tracking parameters
Finding the optimal tracking parameters is necessary to have a track-ing accuracy as good as possible. FastTrack can automatically determine a neutral set of soft normalization factors sr, sα, sA, and sP to help the user. These factors allow comparing terms of very different nature and amplitude into a single cost function. The set of parameters automatically found by FastTrack will give each term the same weight inside the cost function. Therefore, the user must perform parameters’ fine-tuning, with some system insight, to get the best set of parameters possible.
It is intuitive to use the standard deviation of the increments of each kinematic parameter. However, some trajectories are needed to estimate
the standard deviations. We set up an iterative, rapidly-converging algo-rithm to perform this talk.
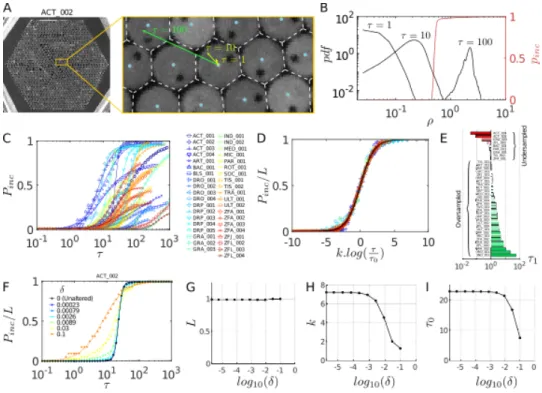
Let us use ZFJ_001, a movie with many occlusions and objects of dif-ferent sizes to illustrate the algorithm’s details. For simplicity, let us use only the position, angle, and area as kinematic parameters. There is no gain to expect by adding the perimeter parameter because objects’ shapes are very similar. The Figure3.4-A. shows a snapshot of this movie.
To evaluate the distributions of dr, dα, and dA, we start by tracking the movie setting the hard parameters and random soft parameters. The resulting distributions are shown in Figure3.4-C to E. For kinematic param-eters whose differential values can be positive or negative, the distribution is fitted by a Gaussian function, and the soft parameter is set to the stan-dard deviation. For instance, with the angular difference dα the fit reads:
f (dα) = 1 sα √ 2π e −dα 2 2s2α (3.4)
and sα (orange bar in Figure3.4-D) is stored as the soft parameter to use during the next iteration. The computation of the soft parameter for the displacement sris different since distances can only be positive. Assuming that the displacements along the x and y axes follow two independent Gaussian processes, the resulting displacement follows a χ distribution with 2 degrees of freedom, and the fit reads (see AnnexeDfor the detailed derivation): f (x) = x (sr σ0) 2e −12( x sr σ0) 2 (3.5) where sr(orange bar in Figure3.4-C) is stored as the soft parameter to use for the next iteration and σ2
0 = 2 − µ20= 4−π2 .
Once all soft tracking parameters have been derived from the distri-butions, the software recomputes new trajectories with these updated pa-rameters. This iterative process, depicted in Figure 3.4-B, is run until the tracking parameters converge. In practice, the convergence is very fast,
re-gardless of the initial position in the parameters space. We drew 100 sets of seed parameters from uniform distributions spanning large intervals, and convergence has been attained in very few iterations for all parameters Figure 3.4-F.
FastTrack’s implements this algorithm by taking the kinematic quanti-ties’ sample standard deviation for a subset of 200 images in the movie to increase speed and efficiency. The convergence criterion implemented is that soft parameters should vary less than 10−3 of the corresponding parameter.
To characterize the resulting tracking, we computed the number of swaps with respect to the ground-truth:
Pswap = Nswap
Nobj− nap (3.6)
with Nswap being the total number of swaps, Nobjthe total number of ob-jects on all frames and napthe number of times a new object appears. If the number of objects is constant and noted n, then nap = nand Nobj = nT, with T the number of frames in the recording, such that Pswapcan be sim-plified:
Pswap = Nswap
n(T − 1) (3.7)
Pswap converges very fast to a value that is nearly-optimal. For 77% of the parameter sets Pswap is decreased or remain equal, with an aver-age drop of 0.0119 (155% of the converged value), while for 23% of the parameter sets Pswap is increased with an average rise of 0.0011 (14% of the converged value). Thus, the expected difference is −0.0090 (116% of the converged value) for this movie. Therefore, the automatic parameters are an excellent starting point in the general case. The user can fine-tune the weights given to the kinetic parameters to consider the specificities of each movie.
We computed the converged soft parameters ˆsr, ˆsα and ˆsAfor several sampling rates of τ > 1 (Figure3.4-H to J). We used these parameters to
track the ZFJ_001 movie at different timescale τ (see Section 4.2) and compute Pswap. A comparison between Pswapand Pinc(see Section4.2) as a function of τ is shown in Figure3.4-K. This comparison illustrates that Pswapis a noisier measurement of a movie’s trackability than Pincand con-firms that the iterative algorithm produces trajectories with a number of errors that is close to the statistical limit.
Figure 3.4 – Automatic tracking parameters. (A) Snapshot and blow-up of
ZF J_001 movie, with definition of ~dr and dα (B) Scheme of the algorithm deter-mining the tracking parameters automatically. (C-E) Distribution of displacements dr(in pixels), angular differences dα (in radians) and area differences dA (in pix-els) when the default parameters of the software are used on ZFJ_001, for τ = 1 (black). The corresponding χ and Gaussian fits are displayed in red. Orange bars: resulting soft parameters. (F) Evolution of sr, sαand sAwith algorithm iterations for ZFJ_001. Left: iterations 1 and 2; right: iterations 2 and 3. A hundred runs with random initial values are shown. The run with the software default parameters is highlighted in red. (G) Evolution of Pswap with algorithm iterations, same runs. (H-J) Evolution of the converged parameters ˆsr, ˆsα and ˆsA as a function of the timescale τ for ZFJ_001. (K) Comparison between Pswap(blue crosses) obtained with the converged parameters and Pinc(red dots) for ZFJ_001. The solid black line is the logistic fit of Pinc.
3.2.4 Manual correction
FastTrack integrates a manual tracking correction tool. Once the anal-ysis is completed, the result can be displayed in an ergonomic interface created solely for this purpose. The user can replay the film by superim-posing the results of the analysis on the original movie. The user can inter-actively see each object’s parameters. More importantly, the user can also correct tracking errors by deleting objects or exchanging objects’ identity. This interface is designed with ergonomics and performance in mind. Key-board shortcuts and an on-the-fly selection of objects by clicking on the video allow the user to check and correct the trajectories quickly. It is also possible to record a film with the tracking results overlay superimposed.
This manual correction interface makes it possible to shift the work-load from the traditional pre-processing of data to the tracking result’s post-processing. In the following chapter, we will see how this method can save the user time, the correction time being in general lower than the conception and computational time of system-specific tracking algo-rithms.
3.2.5 Output
After the tracking, the software generates several files containing the results and the tracking parameters. The result file is named tracking.txt, and it contains the raw data of the analysis with one image and one object per line. This format is compatible with the most used analysis software (R, Python, Julia, spreadsheet). Examples in Python and Julia are available in the documentation to get started.
Figure 3.5 – FastTrack CI/CD workflow. The CI/CD workflow is divided into two
parts: the CI tasks (blue rectangle) and the CD tasks (red rectangle). The CI must be performed successfully in order to integrate the changes into the project.
3.3 Deployment
3.3.1 Continuous integration delivery
The deployment is one part that should not be overlooked in software design, and two aspects are crucial to consider. From the user’s point of view, the software must be easy to install on supported platforms and with fewer bugs as possible. From the maintainer’s perspective, the deploy-ment part must be easily achievable and reproducible so that patches and new functionalities can be quickly integrated. From the developer’s per-spective, the source code’s consistency and correctness have to be tested at each change to avoid introducing bugs and facilitate collaboration be-tween developers. With this in mind, FastTrack follows the CI/CD philos-ophy [35] [36] taking advantage of the recent GitHub Actions system, see Figure3.5.
Continuous Integration (CI) is a set of practices designed to integrate changes quickly into the project in an automated manner. It is coupled with the automation of unit testing. FastTrack takes advantage of GitHub’s

![Figure 6.3 – Schematic drawing of a typical taste bud of teleosts from [83]. Dark cells (Cd), light cells (Cl) and Merkel-like basal cells (Cb)](https://thumb-eu.123doks.com/thumbv2/123doknet/14698171.563888/76.892.275.614.402.884/figure-schematic-drawing-typical-taste-teleosts-dark-merkel.webp)